For more information or copies of this publication, please contact:
Department of Homeland Security
U.S. Fire Administration
16825 South Seton Avenue
Emmitsburg, Maryland 21727
800-561-3356
www.usfa.dhs.gov
FA-219/June 2008
U. S. Fire Administration
Public Fire Education Planning
A Five Step Process
FA-219/June 2008
Public Fire Education Planning - A Five Step Process
U.S. Fire Administration
Mission Statement
We provide National leadership to foster a solid foundation
for local fire and emergency services for prevention,
preparedness and response.

i
To the Reader:
Public Fire Education Planning: A Five-Step Process describes a systematic approach to designing, im-
plementing, and evaluating community safety education programs.
This manual will help those of you who are new to community safety education understand
some of the basic concepts about how to get started with an organization’s community safety
education programs. It also will assist you with some hints and techniques on a variety of
topics, such as methods for locating partners to assist with community education or tech-
niques for locating resources for your safety programs.
Acknowledgment:
The contributions of the following subject matter experts are gratefully acknowledged:
Management Systems
Training & Technology Co.
1331 Pennsylvania Ave., NW
Suite 1415
Washington, DC
Ed Kirtley, Chief,
City of Guymon Fire Department
Guymon, Oklahoma
Mike Weller
Life Safety Education
Hagerstown Fire Department
Hagerstown, Maryland
USFA Project Team
John Cochran,
Fire Management Specialist
Kathleen Gerstner,
Public Fire Education Specialist
Gerry Bassett,
Training Specialist

Table of Contents
Public Fire Education Planning:
A Five-Step Process
Introduction
Chapter 1
Step 1: Conduct a Community Risk Analysis ............................................................................................ 1-1
Identify Data to be Analyzed ....................................................................................................................... 1-3
Develop a Community Risk Profile ............................................................................................................ 1-14
Write a Problem Statement ....................................................................................................................... 1-16
Prioritize Issues ......................................................................................................................................... 1-17
Identify Target Areas and Populations ........................................................................................................ 1-19
Chapter 2
Step 2: Develop Community Partnerships ................................................................................................ 2-1
Identify Possible Partners ............................................................................................................................ 2-2
Interpret Community Risks and Problems................................................................................................... 2-3
Form a Community Planning Team ............................................................................................................. 2-4
Chapter 3
Step 3: Create an Intervention Strategy .................................................................................................... 3-1
Review Data about Risks and Target Populations ......................................................................................... 3-3
Identify Places for Intervention ................................................................................................................... 3-3
Identify Target Populations and Locations ................................................................................................... 3-4
Identify Interventions ................................................................................................................................. 3-7
Identify Resources Required ..................................................................................................................... 3-10
Develop the Evaluation Strategy ................................................................................................................ 3-12
Chapter 4
Step 4: Implement the Strategy ................................................................................................................. 4-1
Conduct Pilot of Intervention ..................................................................................................................... 4-3
Establish Responsibilities and Timetable ...................................................................................................... 4-4
Market Intervention Programs .................................................................................................................... 4-6
Initiate Activities.......................................................................................................................................... 4-8
Monitor Progress......................................................................................................................................... 4-8
Report Progress Periodically ........................................................................................................................ 4-9
Chapter 5
Step 5: Evaluate the Results ....................................................................................................................... 5-1
Collect Data ................................................................................................................................................. 5-2
Compare Data to Baseline............................................................................................................................ 5-3
Note Interventions as Necessary.................................................................................................................. 5-5
Modify Interventions as Necessary .............................................................................................................. 5-6
Report Results to Sponsoring Organization and Community ...................................................................... 5-7
Conclusion
Bibliography
Appendix
ii

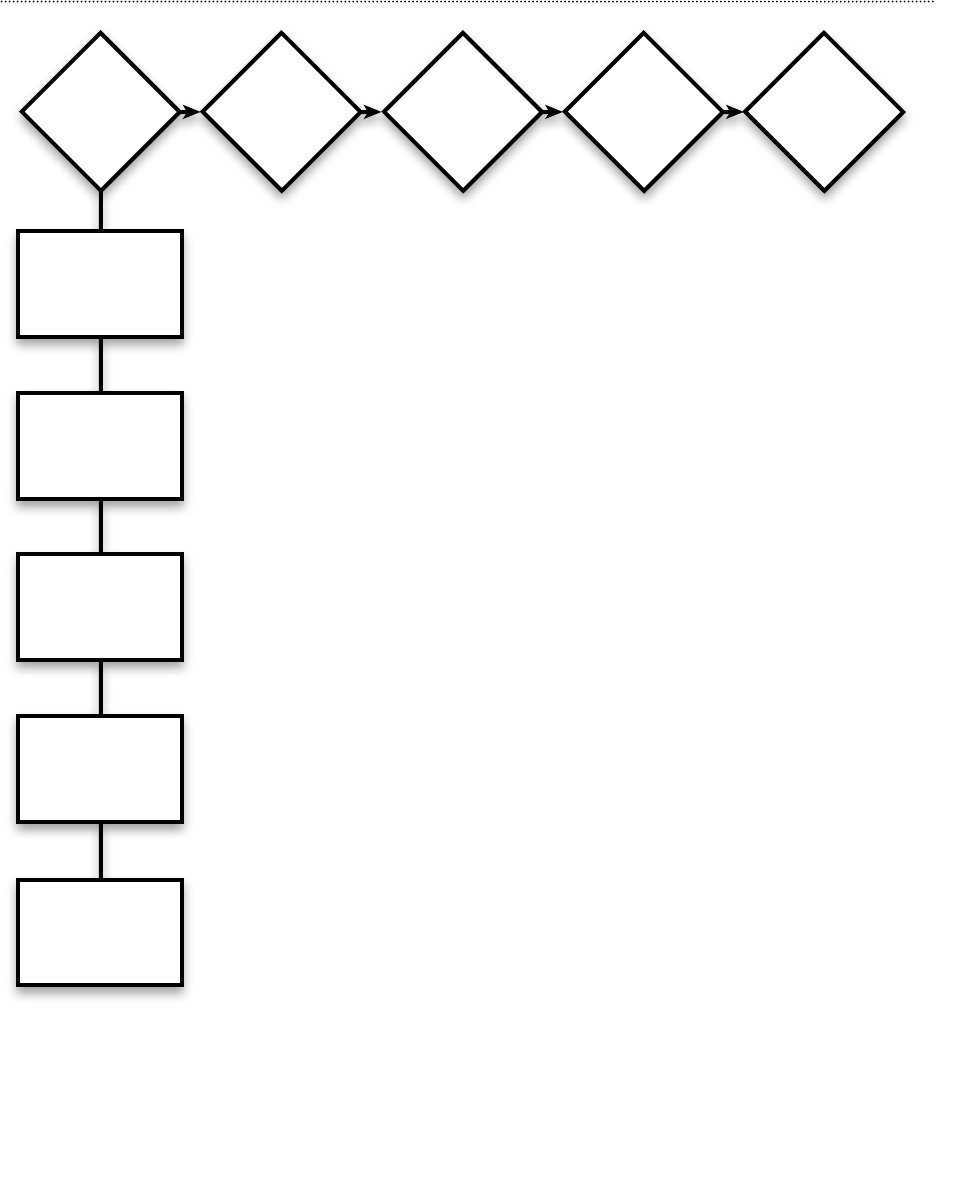
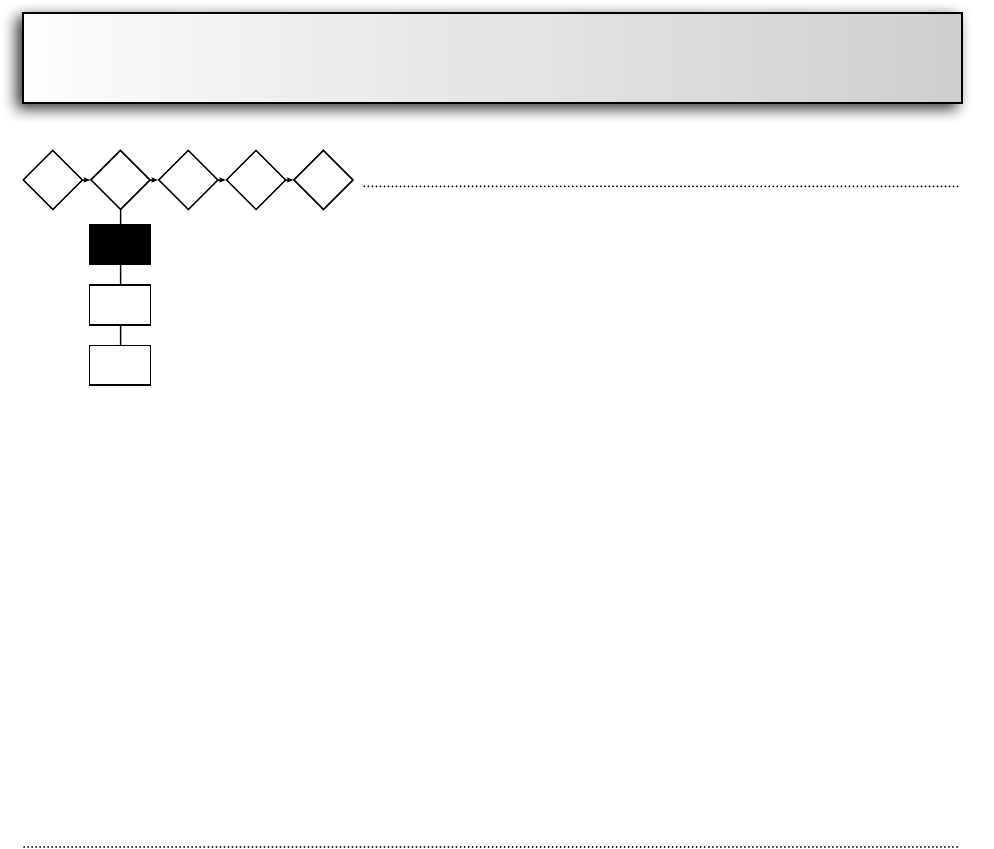
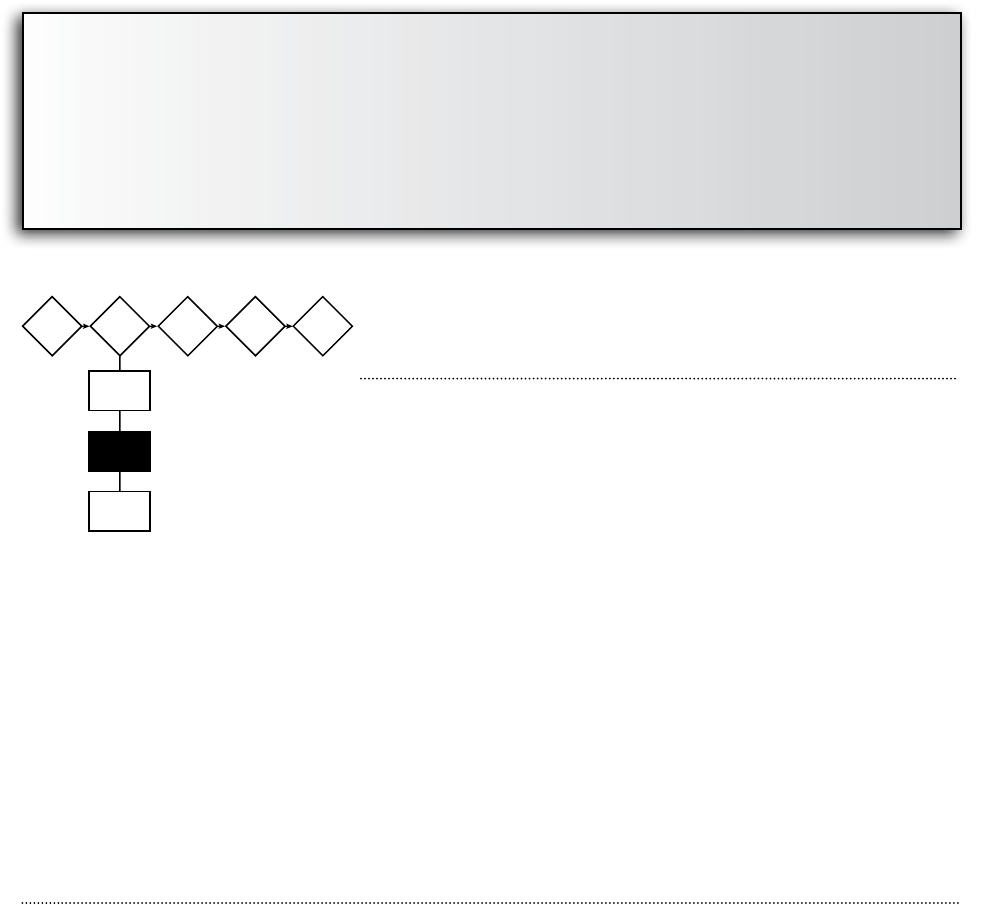
Five-Step Process Summary
Step 1: Conduct a Community Risk Analysis
A community risk analysis is a process that identifies fire and life safety problems and the
demographic characteristics of those at risk in a community.
Step 2: Develop Community Partnerships
A community partner is a person, group, or organization willing to join forces and address
a community risk. The most effective risk reduction efforts are those that involve the com-
munity in the planning and solution process.
Step 3: Create an Intervention Strategy
An intervention strategy is the beginning of the detailed work necessary for the development
of a successful fire or life safety risk reduction process. The most successful risk reduction ef-
forts involve combined prevention interventions:
Education: Providing information (facts) about risk and prevention.
Engineering: Using technology to create safer products or modifying the environ-
ment where the risk is occurring.
Enforcement: Rules that require the use of a safety initiative.
Step 4: Implement the Strategy
Implementing the strategy involves testing the interventions and then putting the plan into
action in the community. It is essential that the implementation is well-coordinated and se-
quenced appropriately. Implementation occurs when the intervention strategy is put in place
and the implementation plan schedules are followed.
Step 5: Evaluate the Results
The primary goal of the evaluation process is to demonstrate that the risk reduction efforts
are reaching target populations, have the planned impact, and are demonstrably reducing
loss. The evaluation plan measures performance on several levels, outcome, impact, and pro-
cess objectives.
iii

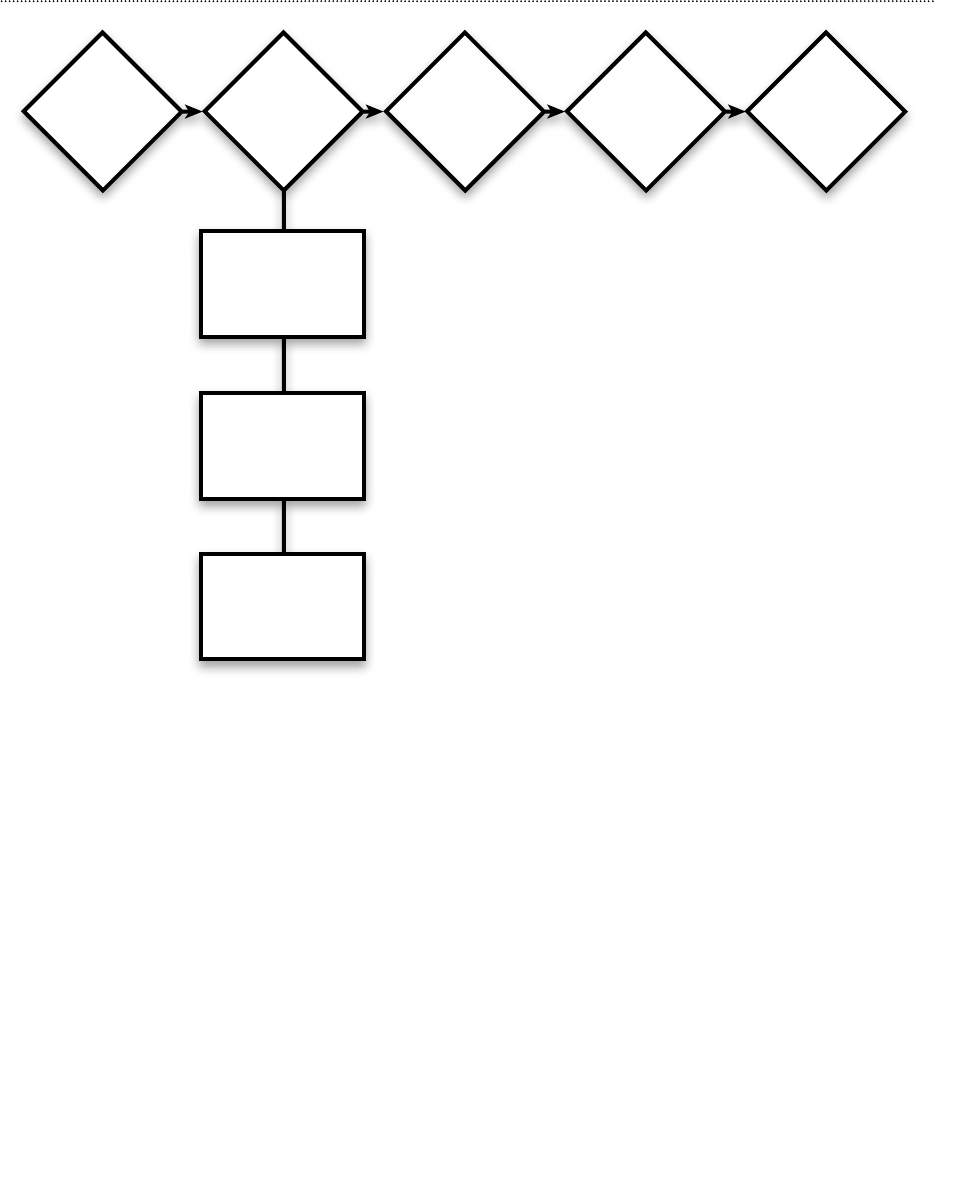
Conduct a
Community
Risk
Analysis
Develop
Community
Partnerships
Create an
Intervention
Strategy
Implement
the
Strategy
Evaluate
the
Results
Identify Data
to be
Analyzed
Identify
Possible
Partners
Review Data
about Risks and
Ta rget Populations
Conduct Pilot of
Intervention; Revise
as Necessary
Collect
Data
Develop a
Community Risk
Profile
Interpret
Community Risks
and Problems
Identify Places
for
Intervention
Establish
Responsibilities
and Timetable of
Activities
Compare Data
to
Baseline
Write a
Problem
Statement
Form a
Community
Planning Team
Identify Ta rget
Populations
and Locations
Market
Intervention
Programs
Note
Interventions
as Necessary
Prioritize
Issues
Identify
Interventions
Initiate
Activities
Modify
Interventions as
Necessary
Identify Ta rget
Areas and
Populations
Identify
Resources
Required
Monitor
Progress
Report Results
to Sponsoring
Organization and
Community
Develop the
Evaluation
Strategy
Report
Progress
Periodically
Introduction

Introduction
Introduction - 1
The purpose of this guide
Today fire departments use many terms for educational fire and injury prevention programs.
Programs differ in size and approach, but the goals are the same: Change the behavior of the
public so that there are fewer dangerous situations, fires, and injuries.
This guide uses a five-step planning process for developing and implementing successful fire
and life safety public education programs. From identifying the fire and injury risks in the
community, developing and implementing a program, and evaluating the results, planning
is the process that ensures that the program strategies and initiatives really address the prob-
lems. This guide takes you step by step through that planning process.
A successful program follows a ve-step process:
1. Conduct a community analysis.
2. Develop community partnerships.
3. Create an intervention strategy.
4. Implement the strategy.
5. Evaluate the results.
The temptation to “just get something implemented” is hard to resist. Unfortunately, this is a
trap. Yes, it’s easy to schedule some presentations at a school; pass out brochures, stickers, and
plastic helmets; and do some media interviews. But do those presentations address the com-
munity’s worst fire or injury problems? Do the solutions being promoted really work? Is the
appropriate target audience even being reached? Are community groups working together?
Is the program being implemented in the best way?
A “ready, fire, aim” approach will not hit the target. It can give the impression that the depart-
ment is out there educating the public, but may achieve little else. Successfully reducing fires
and preventable injuries involves effective community planning. Notable public education
programs around the country always prove this to be true.
This updated guide recognizes that fire prevention is now an important part of the larger
goal of preventing injuries and unsafe situations. Fire departments often provide emergency
medical services. Preventing injury, illness, and other unsafe situations is often part of the
mission of saving lives.

What is the history of public education?
America Burning
Public education as an important component of a fire department’s mission came to the fore-
front when America Burning was published in 1973. This report of the National Commission on
Fire Prevention and Control, the forerunner of the United States Fire Administration (USFA),
provided both insight into the scope of the American fire problem and possible solutions.
America Burning identified the need for public education as part of an overall prevention strat-
egy. “Public education about fire has been cited by many Commission witnesses and others
as the single activity with the greatest potential for reducing losses.”
1
Motivational Psychology Fire Prevention Study
In 1974, Richard Strother published a report called “A Study of Motivational Psychology
Related to Fire Prevention Behavior in Children and Adults,” one of the first scientific studies
to document the effectiveness of public education messages. It also demonstrated the impor-
tance of evaluation as an essential part of a public education program.
Public Fire Education Planning: A Five-Step Process
In 1977, the National Fire Prevention and Control Administration published a program for
public educators detailing an effective planning model. Public Fire Education Planning: A Five-Step
Process is a model that’s been used for years by public educators to develop and implement
fire safety education programs. The basic approach is still applicable today; however, changes
in culture and the scope of problems require the updated planning model provided in this
guide.
Learn Not to Burn
In 1979, the National Fire Protection Association (NFPA) introduced a new fire safety cur-
riculum for use in elementary schools; Learn Not to Burn
©
was the first nationally available
school-based curriculum to address fire safety behaviors for young children. The curriculum
is based on research into the fire problem, the needs and characteristics of the target audi-
ence, and the behaviors appropriate for the target audience. In other words, Learn Not to Burn
©
is the culmination of a public education planning process.
Reaching the Hard to Reach
In 1981, the TriData Corporation, in cooperation with the USFA, published Reaching the Hard
to Reach. This document emphasizes the need for local-level planning to identify the best ap-
proaches for reaching difficult-to-reach target audiences.
Introduction - 2
1
National Commission on Fire Prevention and Control, America Burning: The Report of the National Commission on Fire
Prevention and Control (Washington: U.S. Fire Administration, 1973) 105.

Introduction - 3
National Safe Kids Campaign
A new public education era began in 1988 when SAFE KIDS Worldwide was initiated in Wash-
ington, DC. The campaign is a cooperative effort between the National Children’s Hospital
and Johnson & Johnson Corporation. The goal is to reduce preventable childhood injuries,
including those from fire. Safe Kids focuses on two key messages. First, public education initia-
tives must be based on local problems and target the people at risk. Each community must
conduct its own planning process to identify specific problems and the best methods for
addressing them. Secondly, any local initiative must involve the entire community. One orga-
nization alone can’t make a big impact in preventing fires and injuries. Fire departments are
recognizing that preventable injuries are as much of a problem in their communities as fires.
Today, many fire departments have accepted the concept of working with other organizations,
and have become key members of local Safe Kids coalitions.
Risk Watch
In 1995, the NFPA began working with the National Safe Kids Campaign to develop an all-risk
injury prevention curriculum called Risk Watch
®
. Again, effective planning proved to be a key
to the project’s success. Using the planning process, the NFPA was able to identify the major
risk areas for children, determine appropriate messages and behaviors, and develop success-
ful methods for teaching the behaviors and messages. Risk Watch
®
is now an effective public
education tool.
Lessons Learned
Since 1973, there have been many lessons learned about what constitutes effective public
education initiatives at the local level. Experience shows that successful programs have the
following characteristics:
• There is strong individual and organizational commitment to the public education
initiatives. The initiatives involve more than a few presentations and distribution of bro-
chures. Successful public educators understand the amount of effort involved and commit
themselves to a long-term approach. In addition, the organization’s leaders understand
that the program requires full organizational commitment that includes time for person-
nel to work on the program, resources required to buy materials and equipment, and
most importantly, visible program support from all department members and other local
decisionmakers.
• The program is based on a comprehensive planning process that identies commu-
nity re and injury problems, and the people most likely to be involved. Few, if any,
successful programs are haphazard. Organizations with successful programs have used a
planning process. In some cases this takes time. In other cases (for example, in a small
community with a specific problem) the process may be shorter. The complete planning
process should be used by organizations of all sizes.

Introduction - 4
• Partnerships are established so that the community as a whole is involved in the so-
lutions. Solutions to fire and injury problems can be complex. Several local organiza-
tions should form a team and work together to solve community safety problems. This
approach brings a variety of resources to bear on the problem and reduces the cost to
any one organization. Everyone has a vested interest in the success of the program and in
improving the quality of life of the target audience.
• There is an evaluation of the program’s results and processes. Evaluation is crucial to
determining if a program’s goals have been achieved, and essential to planning future
programs. Evaluation identifies what worked, what didn’t work, and what to do in the
future to be successful. The evaluation also provides the ammunition needed to market
the program to the community.
What has improved?
Public education, along with engineering and enforcement (the three E’s), have reduced fires
and related deaths, burn injuries, and other types of preventable injuries. Consider the fol-
lowing fire and injury statistics:
• From1995to2004,overallreincidentsdeclinedsteadilyby20percent.
• Thenumberofannualdeathsduetoredeclined21percentfrom1995to2004.Now
the annual average is fewer than 4,000 deaths each year.
• From1995to2004,thenumberofinjuriesfromresidentialresdecreasedby29per-
cent.
• Thedeathratefromreamongchildren14andunderdeclinedby68percentfrom1987
to 2005.
• Theoverall unintentional injury-relateddeathrateamongchildren14 and under de-
creased by 45 percent between 1987 and 2005.
However, additional statistics indicate that more work is needed. Consider some different
statistics:
• Thegreatestnumbersofredeathsoccurinthehome,withthemajorityinone-and
two-family dwellings.
• In2005, morethan1,400childoccupants(0-14)died inmotorvehiclecrashesand
nearly half were unrestrained. In the same year, 203,000 child occupants were injured.
• Everyyearmorethan5,000Americanchildrenages14andunderdiefromunintentional
injury

Introduction - 5
• Theelderly,theyoung,andthepoorcontinuetobeatasignicantlyhigherlevelofrisk
from fire than the average person.
• WhileAfrican-Americansaccountfor13percentofthepopulation,theyaccountfor24
percent of the annual fire deaths.
• Theamountofannualpropertylossduetoreeachyearaverages$11billion.
What needs to be done in the future?
The 2000 USFA report, America Burning Recommissioned, states, "There is wide acknowledgement
and acceptance that public education programs on fire prevention are effective...no preven-
tion effort can succeed without a public education component."
2
Fire service leaders and public educators responsible for programs must use new educational
approaches, methods, and processes, such as the following:
• Greater organizational focus on prevention. Fire departments must continue to increase
the emphasis on prevention initiatives. Prevention is an important, cost-effective risk re-
duction tool. Fire chiefs, fire marshals, public educators, and all fire service leaders must
be advocates for these initiatives. They should be the national leaders in fire and injury
prevention efforts.
• Improved data collection and analysis. This directly supports the need for better plan-
ning. Currently, information on fires is available in most States through the National Fire
Incident Reporting System (NFIRS). However, there are voids in available information.
It is essential that each community gather data on fires and preventable injuries. This re-
quires collaboration with agencies such as law enforcement, hospitals, burn units, health
departments, and State fire marshals. Data analysis is part of the overall planning process,
as well as the development of an effective public education program.
• Integrated use of prevention interventions. The most effective prevention programs
incorporate education, code enforcement, and engineering interventions in one com-
prehensive prevention strategy. The three interventions working together hit the problem
from all sides so the ability to reduce deaths and injuries is improved dramatically.
• Improved technology. Safety technology is progressing rapidly. No longer are the smoke
alarm and automatic sprinkler system the only prevention tools available to the public
educator. New technologies include digital projectors, fire detection systems that provide
building occupants with more time to escape from a fire, and computers that increase the
ability of the public educator to reach others with prevention messages. These technolo-
gies must be part of the public educator's toolbox and be integrated into education and
prevention programs.
2
U.S. Fire Administration, America Burning Recommissioned (Washington: Author, 2000) 24.

Introduction - 6
• Higher level of prevention and public education training for emergency services per-
sonnel. Firefighters and emergency medical technicians (EMTs) are routinely delivering
public education presentations and assisting with public education activities. They must
be adequately trained in educational methods. NFPA 1001, Standard for Fire Fighter Profes-
sional Qualification requires new firefighters to have the skills to deliver a public education
presentation from a prepared lesson plan. NFPA 1021, Standard for Fire Officers, specifies
the requirement of the ability to deliver presentations and also to develop a department
public education program. These skills can be included in job descriptions and specified
as a prerequisite for promotion. Every emergency service provider is a public educator at
some level, and can benefit from public education training.
• Changing the current paradigms about the causes of re and injuries. The term “ac-
cident” has been used for years to describe the cause of fires and injuries. By definition,
an accident is an uncontrolled event—something that cannot be predicted or prevented.
When matches are left in the reach of a young child and that child starts a fire with
them, it is not an accident. It is an incident that could have been prevented. When a fire
occurs in a home without a working smoke alarm and the residents are killed, it is not
an accident. A working smoke alarm and education on home escape plans can prevent
these deaths. The public educator must teach the public that injuries and fires are seldom
accidents. Rather, they are predictable events that can be prevented through education,
enforcement, and engineering initiatives.
Can I make a difference?
This is a question that many newly-appointed public educators ask. The answer is, without a
doubt, yes! Public education has proved itself over and over as an effective prevention strate-
gy. The SAFE KIDS Worldwidecampaignestimatesthat,onaverage,a$33smokealarmgenerates
$940inbenetstosociety,suchasmedicalcostsandothercostsassociatedwithresuppres-
sion and property loss. What a return on an investment of one dollar! Safe Kids also estimates
that as many as 90 percent of unintentional injuries to children can be prevented.
Community risk reduction uses prevention processes to reduce or eliminate hazards and risks
in the community, thus reducing the frequency and severity of fires and injuries. This effort
requires planning. But the foundation for success is laid long before the planning step. First,
it’s important to have proactive individual and organizational attitudes about the community
education program, and a strong personal and organizational commitment to making the
program achieve its goals and objectives.
The community educator is the heart and the soul of the program. This person must motivate
others to be involved and support the program. A sound, rational argument for your commu-
nity education program is important. However, a positive attitude and strong commitment is
what actually convinces others that a program should be implemented.

Introduction - 7
Department and community members will assess the level of commitment on the part of the
department leadership. Does the fire chief support community education? Is the fire chief
providing money, time, and people for the program? Do the fire chief and other senior of-
ficers make community education part of day-to-day operations? When others see that com-
munity education is part of the department’s mission, they will lend their support. Commu-
nity involvement is needed to be successful.
What is my personal commitment?
Several specific actions are needed to build and maintain an effective planning process and a
successful community education program. These actions become a personal action plan.
Do the right things and do things right. It is important to have an understanding of the steps
that must be completed in order to establish a sound program. This includes completing a
planning process, gaining support of the department leaders, and developing a partnership
with the community. Take the time to do quality work. Short cuts seldom work and often
take more time to fix than doing it right from the start. Be dependable and willing to do your
share.
Invest the required time and effort. Organizing successful community education initiatives
takes time, resources, and support. It takes time to build a community partnership and to
develop a relationship with the target audience.
Follow a proven successful process to identify and reduce community risk. This guide
provides a proven method for conducting a planning process. However, take the time to read
journal articles and textbooks on community education. If possible, attend the National Fire
Academy (NFA) community education courses, or similar courses taught at the State or local
level. It helps to learn several proven methods of planning community education and risk
reduction. Get insight into programs that have been less than successful and avoid falling into
the same traps.
Collect data and be objective. No one knows all the answers to solving fire and injury prob-
lems. Be objective in your decisionmaking and in the use of educational methods. Before
guessing about the community’s problems and risks collect accurate data. Don’t rely on intu-
ition to determine solutions. Instead, meet with the target audience and the other members
of the community team. Get as much information as you can from them and then analyze
what the information means. If needed, get help in the analysis but don’t get stuck in ‘‘pa-
ralysis from analysis.’’ Step forward, make decisions, and move ahead.
It is easy to become protective of department initiatives and programs, even to the point
of excluding other agencies. Be willing to give up sole program ownership and encour-
age others to share ownership

Introduction - 8
Be a community education activist. In any great change effort there are always leaders who
step forward and lead the charge. That person, the public educator, becomes a cheerleader,
an organizer, a promoter, a recruiter, and a coordinator all in one. Get others excited about
the possibilities of reducing fires and injuries through community education, and then chan-
nel that excitement into action and involvement. Enthusiasm will get others on the team.
Continually discuss community education programs with department leaders so they stay
committed.
The toughest task is winning the support of other department members. Take the time to
listen and consider their program recommendations and recruit assistance in marketing
the program to the community.
Why is organizational support so important?
Organizational commitment is essential for success. There may be some short-term victories
without organizational commitment, but long-term, community-changing results will not
be possible.
There are several tangible benefits that come with organizational support. First, department
resources are available more readily. This includes the most valuable department resource—
its people.
Secondly, fire department leaders will help make connections with other leaders in the com-
munity. Fire chiefs are active in the community and interact regularly with other leaders. The
chief will facilitate introductions to the other leaders so the public educator can promote the
community education initiative directly to decisionmakers. In short, the fire chief can open
doors easily that otherwise might require a great deal of effort.
Finally, when the organization is supporting community education initiatives publicly it
sends a signal to other community organizations and agencies: Reducing fires and injuries in
our community is important! When your department supports community education, other
community partners will get on board.
What department actions support community education?
Organizational commitment for community education is not a one-time thing. It’s an all-the-
time effort that becomes a part of the department culture. This level of commitment takes
strong leadership from the public safety educator. It is not easy to achieve. These points are
key: 1) Community education can reduce fires and injuries effectively when used as part of
the department’s overall prevention strategy; 2) It may take months or years for community
education initiatives to be fully effective; 3) The community looks to the fire department for
leadership; and 4) Effective community education requires a partnership.

Introduction - 9
Make sure the chief understands what community education is, and what is required to
have a successful education program. Educate the chief and other decisionmakers and
leaders about community education.
The following paragraphs discuss several organizational actions that are important in order
for a community education program to be effective and to achieve its goals.
Institutionalize community education as an organizational value. Fire suppression is a
program deeply ingrained as a department value. Firefighters don't argue that fire suppres-
sion is a key mission of the department. The same should be true for community education.
Community fire and life safety education should be included in the mission statement. It
should be part of the department's budget. Job descriptions should include community edu-
cation as a required duty, and personnel should be trained as community educators. Com-
munity education should be part of the department's overall prevention strategy.
Commit department resources to the community education program. Community edu-
cation, just like any other department program, requires resources. Those resources include
money and people. Some community education initiatives require a multiyear commitment
from the department. For example, school-based education programs such as the NFPA's Risk
Watch must be used in the classroom over a period of years to be effective.
Identify the short- and long-term resources required for any community education program.
Make decisionmakers aware of all the resources required for the program when gaining their
support. This information allows decisionmakers to budget to meet ongoing needs.
The public demands that fire suppression crews be staffed adequately and have the ap-
paratus and equipment necessary to put out fires and respond to EMS emergencies. The
community educator should avoid demanding the same funding as suppression: This
will alienate the fire chief and operational personnel. Rather, work with the fire chief to
obtain the resources necessary for success while respecting the needs and roles of other
department programs, including suppression.
Community education is made a department activity. The fire departments with the most
successful community education programs all share one common strategy: every person on
the department is a community educator. This includes firefighters, code inspectors, investi-
gators, and even administrative personnel. Everyone must be involved in the overall commu-
nity education program. When this happens a multitude of resources become available.

Introduction - 10
Decisionmakers and senior ofcers are taught the process of re and injury prevention.
Senior officers should receive training on how to develop a prevention strategy which in-
cludes conducting a community risk analysis, identifying the appropriate strategies to reduce
the problems, and methods for involving the community in the prevention program.
Senior officers and department leaders find it difficult to support what they don’t understand.
Identify training opportunities such as the NFA’s Community Education Leadership and Strategic
Analysis of Community Risk Reduction courses. Similar State and local training programs also may
be available.
Encourage the senior officers and decisionmakers to take these classes as part of their
professional development. The lessons and skills they learn will be an asset to you and
the community education program.
Prevention strategies include adopting and enforcing up-to-date re safety codes and
standards, and building plans review. A comprehensive prevention program includes com-
munity education, adopting fire and life safety codes, code enforcement, and building plans
review. Education alone will not be fully effective.
Expand prevention strategies to include injury prevention. In many communities the
greatest risk to the health of the public is not fire, but rather more generally preventable in-
juries. Most departments provide some level of emergency medical services (EMS), so injury
prevention should be part of the department’s prevention mission.
The community educator should have a good relationship with the re chief. The educa-
tor must make a commitment to building and maintaining a good working relationship with
the chief. What does a good relationship involve? Here are some important considerations:
• Trust. Part of the relationship with the fire chief is mutual trust. A fire chief must be able
to trust the information being provided by an educator. Always be completely truthful,
even if it’s painful to do so.
• Mutual Respect. Respect the fact that there are more programs to consider than just com-
munity education. There are times that resources requested are not going to be available
because of other department priorities.
• Acting proactively. Look to the future and have at least a 2- to 3-year plan for the pro-
gram. Maintain a community planning process. Advanced planning helps to align depart-
ment resources more effectively for program support.

Introduction - 11
• Seek to understand before being understood. Take the time to learn about the rest of the
department’s programs and needs and then relate the education program’s needs in those
terms.
• Play by the rules. It is tempting to bend the rules and to go outside regular channels to
get things done. But this strategy breaks down mutual trust. There are always rules and
policies. Learn them and use them effectively.
• Do a few things well. Identify the highest priorities for the community through a plan-
ning process, and then attack those priorities with all the resources available so that the
program will be successful.
Summary
Success comes from building internal support for community education, understanding the
role the community educator plays in successful programs, and creating an organization that
is focused on prevention and community education. The community educator must be the
leader in this process, and be responsible for guiding and educating other people and groups.
The “five-step” process outlined in this guide is a key to success. It really works!
The public educator must complete the planning process by determining the most serious
fire and/or injury problems facing the community and the best solutions. Then he or she
must be willing to reach out to the community and work with other agencies as part of a
community team. Finally, program results must be evaluated correctly.
This guide provides you with information to develop the skills for conducting a basic but ef-
fective planning process. Through the years, the lessons and processes have proved effective.
It’s now up to you to use the planning process as the foundation for your public education
Conduct a
Community
Risk
Analysis
Develop
Community
Partnerships
Create an
Intervention
Strategy
Implement
the
Strategy
Evaluate
the
Results
Indentify Data
to be
Analyzed
Develop a
Community Risk
Profile
Write a
Problem
Statement
Prioritize
Issues
Identify Ta rget
Areas and
Populations
Step 1: Conduct a Community Risk Analysis

1-1
Chapter 1
Step 1: Conduct a Community Risk Analysis
Introduction
What is a community risk analysis? A community risk analysis is a process that identifies fire
and life safety problems and the demographic characteristics of those at risk in a community.
A thorough risk analysis provides insight into the worst fire and life safety problems and the
people who are affected. The analysis results create the foundation for developing risk reduc-
tion and community education programs.
Conducting a community risk analysis is the first step toward deciding which fire or injury
problem needs to be addressed. Risk analysis is a planned process that must be ongoing, as
communities and people are constantly changing.
Why conduct a community risk analysis? Fire and rescue departments must use facts in
order to correctly identify leading safety risks that need attention. A community risk analysis
will provide these data.
Consider this: A group of people decide to plan a trip. How will they know the best route to
take without knowing where their starting point is? Likewise, it is important to know where
a community is before beginning a community education program that will reach a risk re-
duction goal.
Too often, an objective and systematic community risk analysis is a step that is overlooked in
the community education process. Many emergency service organizations address risks based
on a perceived need for service that isn’t really there. An educator may want to teach people
about something that is not a problem, perhaps just because a particular subject is interesting.
First, it will be hard to get people to participate in an unnecessary program. Second, nothing
actually will be accomplished. This approach can be costly in terms of misdirected resources,
continued property loss, injuries, and deaths.
Examples
• An organization reads about a high occurrence of electrical fires in a neighboring com-
munity and decides to begin a campaign to address these types of fires.
However, a data analysis of its own community’s fire occurrences reveals that it has very
few electrical fires. What it does have is a large number of unattended cooking fires.
Result: Because its campaign is misdirected to electrical fires, cooking fires and related
injuries continue.

1-2
• An organization located in the northeastern United States reads of swimming pool drown-
ings occurring in the southwestern part of the country. The organization begins a safe
swimming campaign.
If this organization looked carefully at community data, it would identify that only two
swimming pool drownings had occurred in the prior 10 years. Further study would have
revealed a large number of child pedestrian injuries and deaths.
Result: Because its campaign is misdirected toward deaths by drowning, child pedestrian
injuries and deaths continue.
It is easy to become distracted from local issues by big media splashes about national hap-
penings. Don’t let that happen. Stay focused! Invest the time to conduct an objective com-
munity risk analysis. Having facts about the leading causes of risk and the people being
affected will set the stage for a successful risk reduction process.
Objectivity means using reliable data to make conclusions based on facts, not beliefs.
What does a community risk analysis include? A community risk analysis includes five
important activities:
1. Identify data to be analyzed.
2. Develop a Community Risk Profile.
3. Write a problem statement.
4. Prioritize issues.
5. Identify target areas and populations.
The analysis provides a factual overview of the risk issues, using the information obtained,
and should be used to develop a risk reduction proposal. This will produce a picture of what
is wrong and who is at risk.
1-3
Identify Data to be Analyzed
What is problem-related information?
Problem-related information identifies three things:
1. The leading causes of community risks.
2. Where problems are occurring.
3. Who is being affected by the risk.
Problem-related information is obtained by conducting research, asking questions, and mak-
ing comparisons based on quality data.
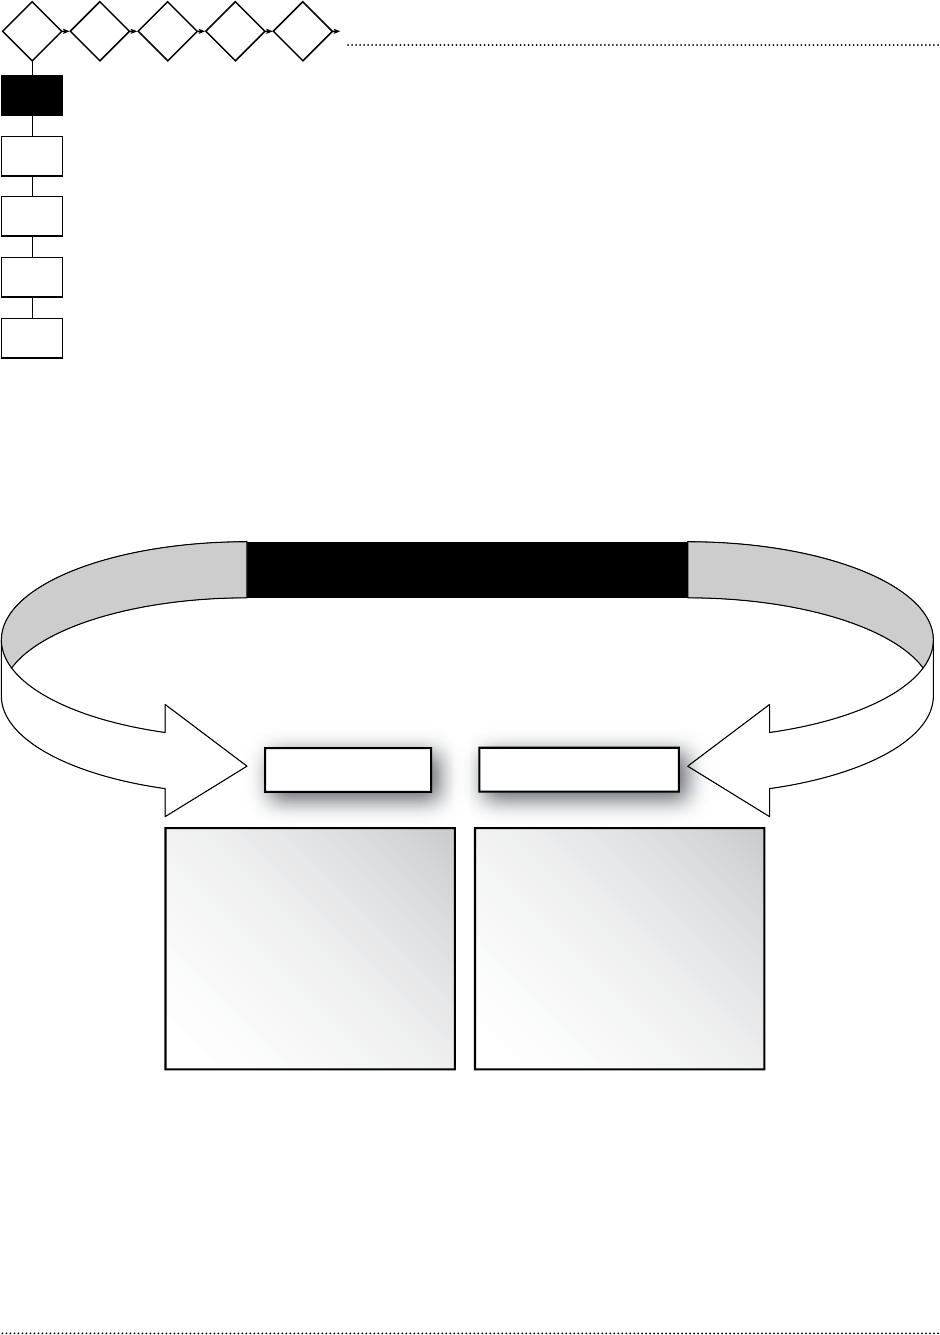
COMMUNITY ANALYSIS
PEOPLE PROBLEM
Ta rget Audience
Characteristics of
Audience
Relationship of
Audience to Problem
Nature of Fire/Injury
Problem
People Affected by Problem
Cause of Problem
Solution to Problem
Figure 1: Community Analysis.
How do you locate problem-related information?
Here is an example. A fire department in Safe City, USA, wants to examine the leading cause(s)
of fire in the community
1-4
The fire department locates valid data sources to identify the leading causes of fire in Ameri-
ca. Sources include the NFPA and the USFA. National injury data also can be sought from the
Centers for Disease Control and Prevention (CDC) and the National Safe Kids Coalition. Na-
tional sources are sought so a comparison can be made to State and local data. The National
Fire Data Center Web site provides community educators with published statistical informa-
tion on the national fire problem.
Figure 2: U.S. Fire Administration Web site.
A community educator can log onto the Internet, go to the USFA and NFPA Web sites, and
instantly review a profile of the national fire problem.
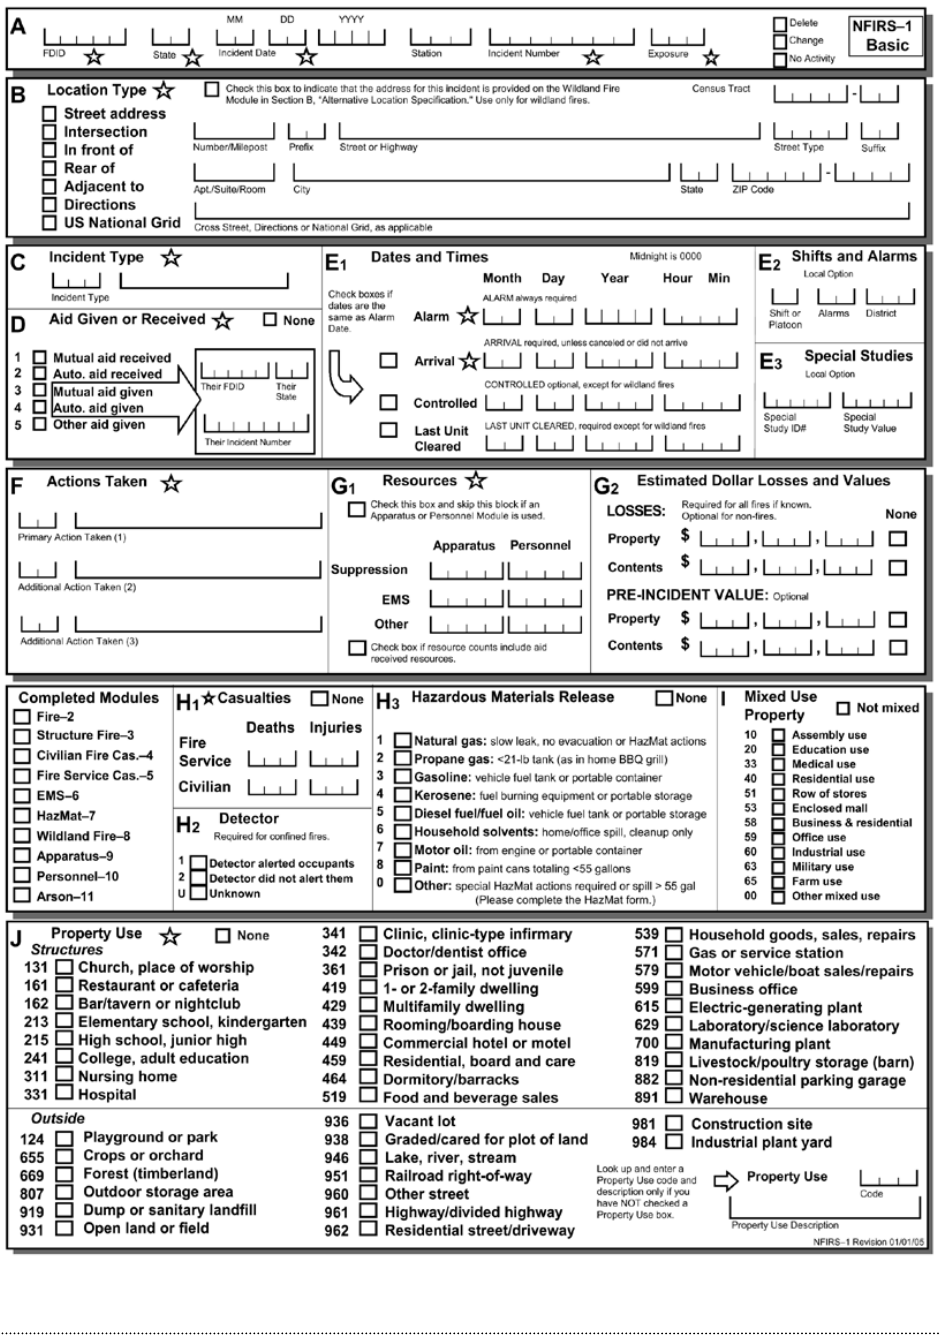
These organizations are reviewing data regularly from NFIRS. This allows them to build a
national profile of how many fires and other incidents occur, note their causes, and indicate
where they occur and who is affected. A copy of one page of the NFIRS report form is on the
next page.
LOCAL STATE FEDERAL
1-5
Figure 3: NFIRS Form.
1-6
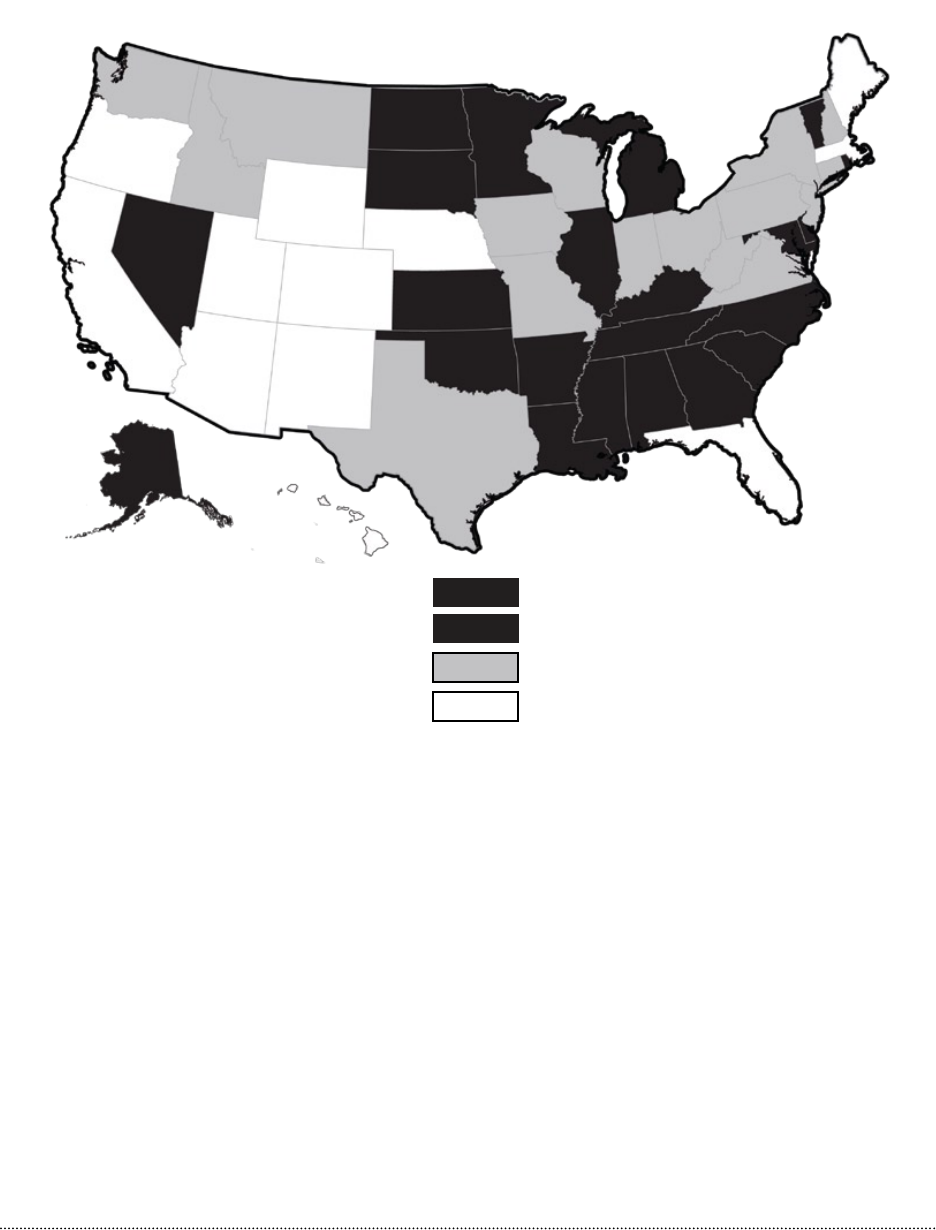
The fire department locates data sources to identify the leading causes of fire in the State.
State data, usually available from the State fire marshal’s office, should be used to make a
comparison to national and local data.
Some examples of State data include a comparison of your State’s fire deaths to those of the
whole United States. This information will provide an indicator of the magnitude of the
problem in your State. The bar chart in Figure 5 illustrates such a comparison.
25+ Deaths per Million Population
18-25 Deaths per Million Population
11-18 Deaths per Million Population
Under 11 Deaths per Million Population
Note: 1995 data from Indiana and Nevada are
incomplete. 1994 data are shown.
Sources: State Fire Marshals and the United States
Fire Administration.
Fire Death Rate by State in 1995
Figure 4: Death Rates by State.

1-7
86 87 88 89 90 91 92 93 94 95 86 87 88 89 90 91 92 93 94 95
100
80
60
40
20
0
100
80
60
40
20
0
86 87 88 89 90 91 92 93 94 95 86 87 88 89 90 91 92 93 94 95
NEVADA NEW HAMPSHIRE
PENNSYLVANIA RHODE ISLAND
Fire death rate
per 1,000,000
population
Average U.S.
re death rate
per 1,000,000
population
10- Year Fire Death Rate by State
Compared to National Average
Figure 5: Comparison of State and
National Fire Deaths by Year.
1-8
The fire department examines local fire/injury experience data to identify the extent and
leading causes of community fire/injury. Sources include fire department incident records,
local hospital records, and local health department records. Additional injury data may be
available from other community organizations, such as the local Safe Kids Coalition.
It is most important to identify the leading causes of risk at the local level. Local issues may
be different from those at the State and national level. Local data are by far the most impor-
tant source of information. It is through local data that specific risks in your community are
identified.
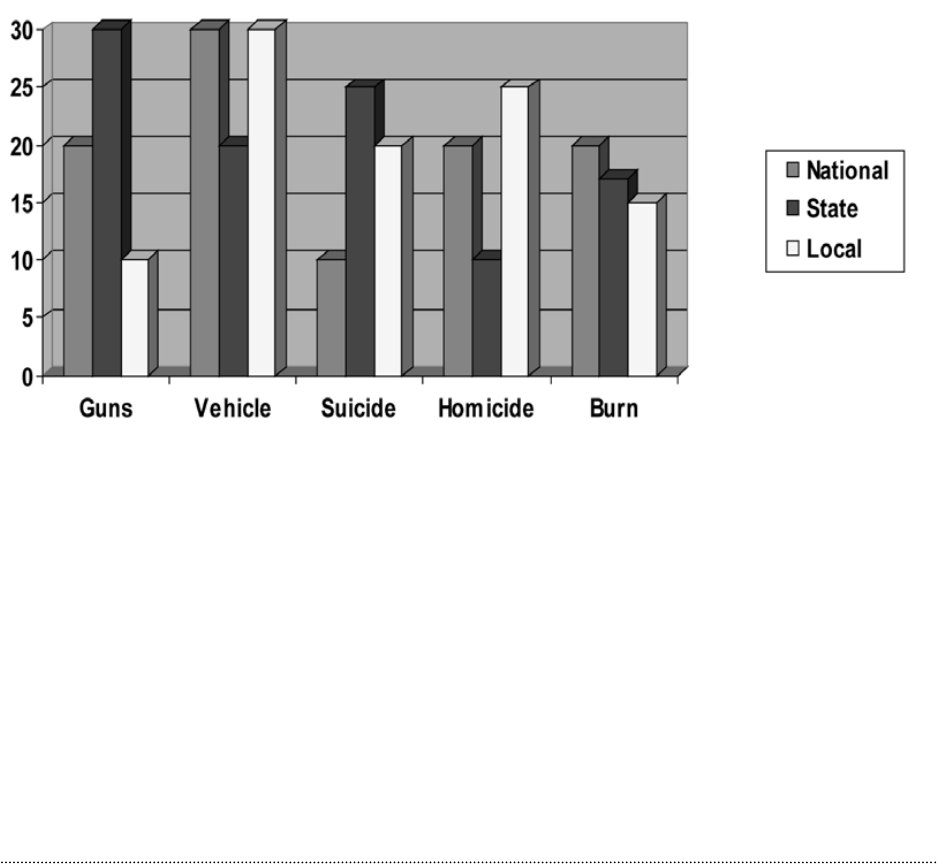
Figure 6 gives an example of local data compared to State and national data on injuries by
cause of injury.
Figure 6: Local Injuries by Cause.
The goal is to identify the leading causes of fire/injury at the national, State, and local level.
It is important to examine all levels so that comparisons can be provided to potential partners
from the local community.
If an organization does not have a formal data collection system, it is never too late to start
one! Potential sources to assist with learning how to collect data are listed at the end of this
section.
Injuries by Cause
How much local problem information is needed?
Quite a bit of information is required in order to draw accurate conclusions. Even though
national and State information is available, it is critical to develop the same type of profile at
the local level.
Examine at least 3 years (more if possible) of data. This will allow the identification of a
baseline (average) of how many times a specific incident occurs annually. The smaller the
community, the further the history search should be extended.
Leading Causes of Home Fires and Deaths
1993-1997 Annual Averages
Figure 7: Annual Average Comparison of Home Fires and Deaths.
It is easy to create a simple database from existing run sheets. This allows the fire department
to identify fire and injury causes and their occurrences.
For example the following activity report can be used to study the fire problem in your city.
1-9
Susp.
Dist.
Playing

1-10
Aug.
2001
Aug.
2000
Year to
Date
2001
Year to
Date
2000
SUPPRESSION
Total Incidents 150 156 1,218 1,102
Estimated Loss 6,102 265,905 854,642 657,654
Multiple Alarm Fires 0 1 1 2
Average Number of Firefighters Per Incident 7 7 8 7
Average Response Time 2:41 2:24 2:38 2:44
Average Time Spent Per Incident 19:16 23:38 22:36 26:56
Civilians Injured 0 1 7 5
Civilian Fatalities 0 0 0 0
Civilians Rescued/Revived 0 0 0 1
TRAINING
Monthly In-House Training Hours Provided 0 0 20.5 26.5
Firefighters Injured 0 0 6 2
Firefighter Fatalities 0 0 0 0
INVESTIGATIONS
False Alarms 6 4 48 40
False Alarm Arrests 0 0 1 2
False Alarm Convictions 0 0 1 2
Incendiary Fires/Fireworks 5/0 6/0 30/0 23/0
Arson Arrests/Fireworks 1/0 6/0 21/0 17/0
Arson Convictions/Fireworks 1/0 2/0 19/0 10/0
INSPECTIONS
Total Inspections 84 125 711 848
Site and Building Plans Reviewed 28 22 164 174
Citizen Complaints Received about Fire Violations 1 0 6 6
Number of Appeals 0 0 0 1
Legal Action Taken 0 0 0 0
PREVENTION/EDUCATION
Free Smoke Detectors Installed 15 6 215 236
Public Education Programs
(Children’s Village - 1; School - 0; Other 1) 9 11 134 131
People in Attendance
(Children’s Village - 30; School - 0; Other - 30) 450 340 5,890 4,935
Media Articles/Programs 6 15 74 90
’
Figure 8: Local Activity Report.
Activity Report for August 2001
Fire Department
Safe City Example
The Safe City, USA, fire department responds to 100 structure fires each year. The fire
department decides to examine 10 years of structure fire experience data to identify the
leading structure fire cause in Safe City.
The Safe City Fire Department discovers it has responded most often to fires resulting
from unattended cooking: 400 such calls over a 10-year period. To determine the aver-
age number of cooking fires per year, divide the total number of cooking fires in the
10-year study (400) by the number of years in the study (10). The result: Safe City Fire
Department experiences an average of 40 cooking fires per year.
These data can be restated as 40 cooking fires per 100 yearly structure fires (40/100, or
40 percent.
Safe City Fire Cause
Although 40 cooking fires each year may not seem like a large number, comparing the occur-
rence with all other fire causes identifies it to be the leading structure fire problem. Cooking
fires also are a frequent cause of burn injuries.
By completing this data analysis, Safe City Fire Department has identified the following in-
formation:
1-11
Safe City Fire Cause
Cooking
Other
• Theleadingcauseofstructurereisunattendedcooking.
• Theredepartmentismostlikelytodecreasethenumberofstructureresinitscom-
munity by developing a campaign to reduce cooking fires.
• ThebaselineaveragenumberofcookingresinSafeCityis40peryear.Bycomparing
next year’s incidence of cooking fires to this baseline number, the fire department will be
able to evaluate the progress of its campaign to reduce unattended cooking.

1-12
Examining at least 3 years of data (more if possible) will provide a more accurate
prole of leading risk issues.
Examining less than 3 years of data will not provide an accurate prole of leading
risk issues, and the real issues may be overlooked.
What type of local problem-related information is needed?
To conduct an objective risk analysis, the following types of local information must be ob-
tained:
• typesofincidents(res,falls,etc.);
• rootfactorsleadingtoincident(howdoesatypicalincidenthappen?);
• howoftentheincidentsoccur;
• locationoftheincidents(geographicdistribution);
• whenincidentsoccur(time,day,month);
• costoftheincidents(expense,injuries,lossoflife);and
• typesofincidentshappeningmostfrequently.
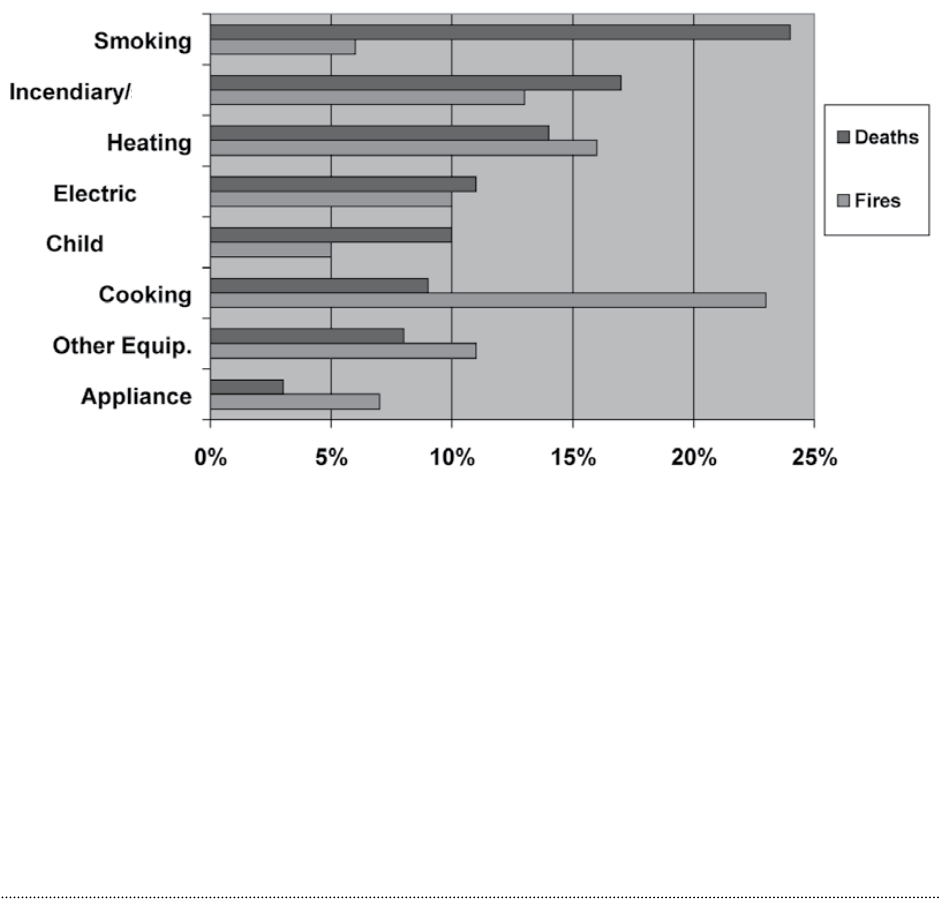
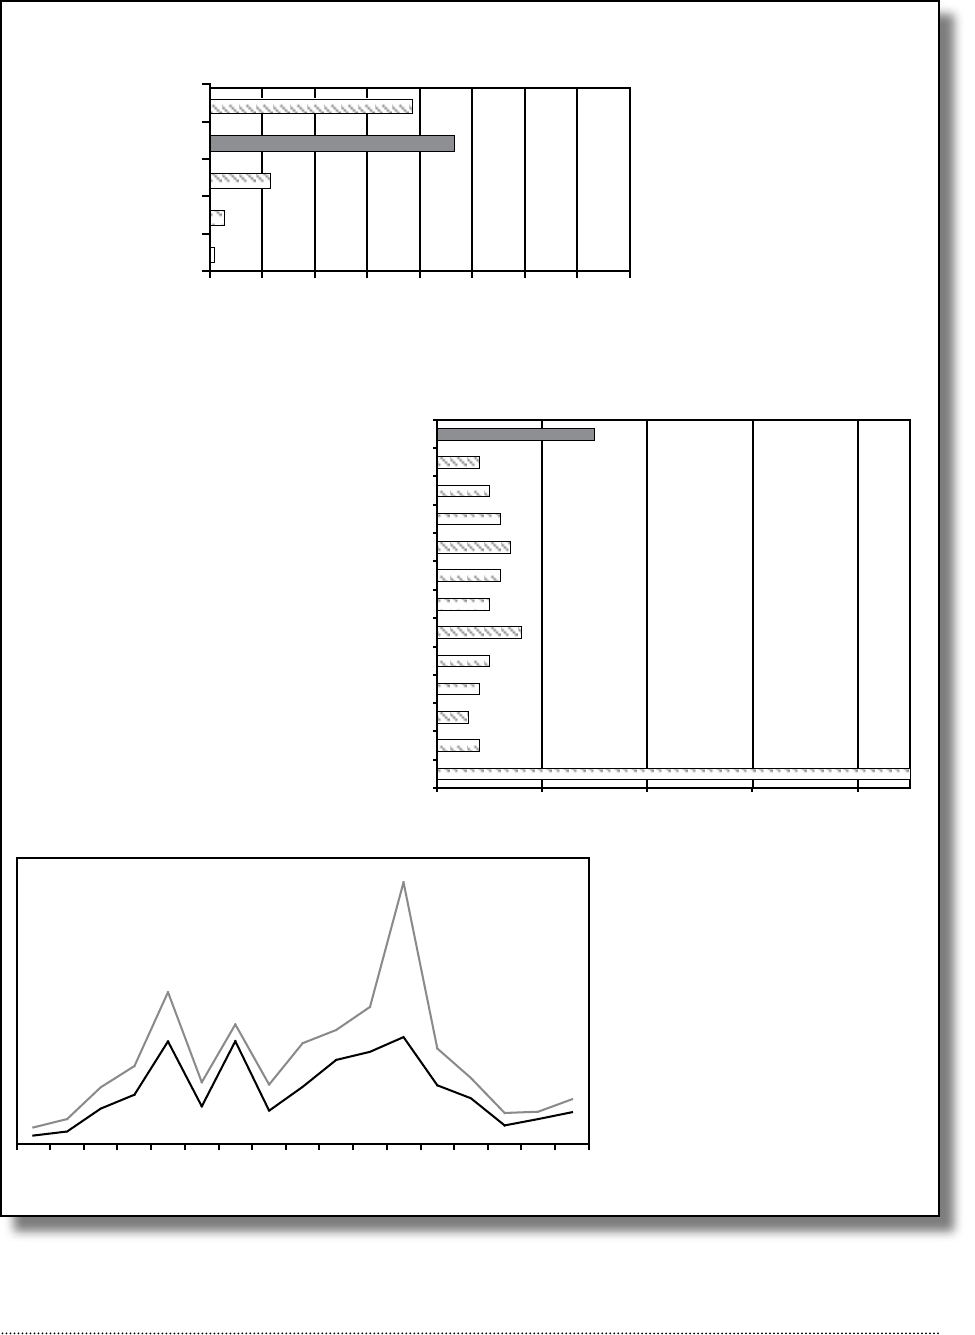
This type of local information can be displayed like the examples on the following page in
order to analyze the information and make decisions about local problems.
1-13
Figure 9: Examples of Local Data Displays.
0.9
2.7
11.4
46.5
38.6
01020304050607080
Other
Vehicle
Residential
Percent
0 10 20 30 40
Unknown
Exposure
Natural
Other Equipment
Other Heat
Open Flame
Appliances
Electrical Distribution
Cooking
Heating
Careless Smoking
Children Playing
Incendiary/Suspicious
678910 11 12 123 45 6 7 8910
Cooking Fires
Non-cooking Fires
AM PM
Dollar Loss By Property Type
Causes of Fires
When Incidents Occur
Nonresidential
Outside
Percent

1-14
Conducting a comprehensive analysis of risk helps to ensure selection of the “pri-
ority” issues.
Examining only one area (such as expense) may not provide enough information
to make an objective decision on what issue to address.
What is a community risk prole?
A community risk profile is an overview of the information gathered about the
community. It can serve as an introduction to a problem statement. A community
profile should include the following information:
• demographicdescriptionofcommunity;
• demographicdistributionofhigh-riskpopulations;
• briefdescriptionofselectedre/injuryriskissue;
• publicperceptionoftheproblem;
• existingmythsabouttheproblem;
• politicalsupportfortheissue;and
• resourcescurrentlyavailabletoaddresstheriskissue;
Develop a Community
Risk Prole
A community profile does not have to be a lengthy report. A paragraph or two for each sec-
tion is enough. The community profile leads a reader to the problem statement. Several pro-
files may need to be developed, one for each targeted risk selected.
Data collected for the local area can be summarized in charts that represent a demographic
profile. The following chart details the demographics for one county in terms of age, sex,
and income.

1-15
Prole of Health Status Indicators
Figure 10: Local Demographics Example.
Demographics
Males Females
COUNTY
# ALL
RACES
%
WHITE
%
AFRICAN-
AMERICAN
%
NATIVE
AMERICAN
%
ASIAN
COUNTY
# ALL
RACES
%
WHITE
%
NATIVE
AMERICAN
%
ASIAN
ALL AGES 2,961 98.5 0.1 1.3 0.0 ALL AGES 2,964 98.2 0.1 1.6 0.1
< 1 41 93.9 0.7 5.4 0.0 < 1 33 98.3 1.0 0.0 0.7
1 to 4 147 93.5 0.5 6.0 0.0 1 to 4 154 93.2 1.1 5.2 0.5
5 to 9 246 98.0 0.0 2.0 0.0 5 to 9 203 97.0 0.0 3.0 0.0
10 to 14 280 99.3 0.0 0.7 0.0 10 to 14 268 98.9 0.0 1.1 0.0
15 to 19 217 97.7 0.0 2.3 0.0 15 to 19 198 98.0 0.0 2.0 0.0
20 to 44 935 98.2 0.2 1.5 0.1 20 to 44 886 97.5 0.2 2.2 0.1
45 to 64 657 99.8 0.0 0.2 0.0 45 to 64 648 98.9 0.0 1.1 0.0
65 to 74 243 99.6 0.0 0.4 0.0 65 to 64 294 99.7 0.0 0.3 0.0
75 + 195 100.0 0.0 0.0 0.0 75 + 279 100.0 0.0 0.0 0.0
STATE
# ALL
RACES
%
WHITE
%
NATIVE
AMERICAN
%
ASIAN
STATE
# ALL
RACES
%
WHITE
%
NATIVE
AMERICAN
%
ASIAN
ALL AGES 1,586,887 83.0 7.7 8.1 1.2 ALL AGES 1,666,742 82.9 7.7 8.1 1.3
< 1 21,371 78.4 10.1 10.0 1.5 < 1 20,090 76.8 10.4 10.4 2.4
1 to 4 100,081 78.0 10.3 10.0 1.7 1 to 4 96,344 77.5 10.6 10.3 1.6
5 to 9 122,245 77.6 10.1 11.1 1.2 5 to 9 116,596 77.3 10.2 11.1 1.4
10 to 14 132,867 77.9 9.3 11.5 1.3 10 to 14 124,696 77.1 9.7 11.8 1.4
15 to 19 123,129 78.9 9.3 10.5 1.3 15 to 19 116,201 78.6 9.6 10.5 1.3
20 to 44 590,427 82.5 8.2 7.6 1.7 20 to 44 589,875 82.0 8.4 7.9 1.7
45 to 64 317,486 87.8 5.2 6.2 0.8 45 to 64 340,946 86.9 5.6 6.4 1.1
65 to 74 109,361 89.8 4.3 5.5 0.4 65 to 74 133,876 89.0 4.9 5.6 0.5
75 + 70,141 90.0 4.5 5.3 0.2 75 + 128,773 90.0 4.6 5.2 0.2
Income/Poverty
Income Levels County
Number
State
Number
County
Rate
State
Rate
Income < 100%
Poverty
523 527,088 8.8% 16.25%
Income < 150%
Poverty
1,170 884,987 19.7% 27.2%
Income < 185%
Poverty
1,646 1,070,444 27.8% 32.9%
Income < 200%
Poverty
1,895 1,242,886 32.0% 38.2%
Poverty by Age Groups
Age 0-17 162 189,553 9.7% 21.7%
Age 18-64 243 247,597 7.5% 14.2%
Age 65-74 31 32,837 5.9% 13.5%
Age 75 + 100 58,620 21.2% 24.1%
Income
Per Capita Income $18,667 $17,610 -- --
Median Family Income $31,279 $28,554 -- --
Unemployment
Unemployment Rate 67 57,867 2.4% 3.6%
Household
# Female-Headed
Households
74 87,945 -- --
Nursing Facilities County Number State Number
Beds per 1,000 Elderly (Age > 75 yrs) 131 185
Patient Rate per 1,000 Elderly (Age > 75 years) 115 144
%
AFRICAN-
AMERICAN
%
AFRICAN-
AMERICAN
%
AFRICAN-
AMERICAN

1-16
What is a problem statement?
A problem statement provides a fact-based overview of the problem and who is af-
fected by it. It also provides a vision of what the organization proposes to do about
the problem.
Here is an example of a problem statement developed in Safe City:
Write a Problem Statement
Safe City Example
Community Risk Prole
Safe City, USA, population 20,000, is a small but densely populated community located
in the southeastern United States. The town grew from a small village to its present size
beginning in the early 1900s. Most homes are more than 30 years old and are of ma-
sonry construction.
Although the railroad industry once thrived in Safe City, most residents now commute
to larger cities for work.
Safe City is an aging community, in terms of both people and properties. A significant
percentage (30 percent) of Safe City’s citizens are retired. Many reside in city-owned
housing units. A significant portion of the older adult population has difficulty with
mobility, hearing, or sight. Most live on a fixed income.
Unattended cooking is the leading cause of fire and fire-related injury in Safe City: 40
percent of both structure fires and related injuries are caused by this risk. Half of the
fires (an average of 20 each year) occur in the homes of older adults living in city-
owned housing units.
During a recent survey conducted by the fire department, only 10 percent of the older
adult population could identify (or guess) that cooking was the leading cause of fires in
Safe City. Most of the older adults stated they were safe from fire while in their homes.
The community of Safe City is very supportive of its older adult population. Although
progress on issues related to the elderly is sometimes slow, the local housing authority
plans, in response to projected community demographics, to double the number of
housing units for older adults over the next 15 years.

1-17
Safe City Example
Problem Statement
Unattended cooking causes 40 percent of fires and fire-related injury in our communi-
ty. Half of these cooking fires (an average of 20 each year) occur in the homes of older
adults who reside in city-owned housing units. Interviews with fire victims identify
that most fires occur because the cooking process has been left unsupervised.
The Safe City Fire Department proposes the development of a community-based cam-
paign to address cooking fires among the older adult population living in city-owned
housing units. This proposal is based on the following factors:
• Thereisahighoccurrenceofcookingresandre-relatedinjuriesatthecomplex.
• Thecommunityandhousingauthorityaresupportiveoftheolderadultpopulation.
• Thereisarealisticpossibilitythatsuchaninterventionwillbesuccessful.
• Asuccessfulcampaigncanserveasamodelforfuturecitywideefforts.
Done well, the community risk profile and problem statement will provide a factual
rationale of why the selected risk issue should be addressed.
Share the document with the community and convince others to join the team! A
poorly written problem statement (lacking facts) may damage your organization’s
credibility and result in less support for your proposed effort.
Prioritize Issues
How should the priority risk issue be decided?
Making an objective decision on which risk issue to address is a process that takes
time, effort, and patience. It is a decision that must be governed by local need. Fol-
lowing an organized process leads to selecting the risk issue that most needs atten-
tion as the priority risk issue.
These factors can influence a fire department’s decision to select a particular risk
issue:

1-18
• highinjury/fatalitystatistics;
• highdollarloss;and
• rapidincreaseinfrequencyofoccurrence.
Once an idea has developed about a particular risk issue. It is time to examine the
second phase of community risk analysis: people and community information.
Relying solely on problem-related data wouldn’t provide enough information to
formulate a risk reduction campaign. Additional factors should be considered.
What is people- and community-related information?
People- and community-related information is based on demography. Simply stated, demog-
raphy is the study of people and their environments.
Examples of demographic information:
• housinginformation:numberofhomesinthecommunity;typesofproperties;owner
occupied/rental units; general condition of structures; age of homes, etc.;
• peopleinformation:numberofresidents;populationdensity;age/gender/educationlev-
els; family structures; disability types, etc.; and
• economicinformation:familyincomes;individualmedianincome;overallcommunity
economic projections; number of people in poverty; number of people getting financial
assistance, reduced rent, or free or reduced lunch.
Demographic information can be gleaned from both formal and informal sources.
Formal sources may include local planning and community development offices, the Census
Bureau, the Chamber of Commerce, economic development offices, hospitals, and health
departments.
Informal sources may include local schools and Head Start centers, women’s shelters, assisted
living facilities, day care centers, community associations, social services, and reports by
clergy and established community leaders.
Comparing problem-related information with community demographics helps identify who
is most at risk, what factors place them at risk, and where a risk reduction campaign should
be directed.

1-19
Safe City Example
Safe City, USA, identified these facts about its cooking fire problem:
• Mostcookingres(50percent,infact)occurinthehomesofolderadultswith
limited incomes who reside in city-owned housing units.
• Mosthousingunitsarelocatedinthecenterportionofthecommunity.
Invest the time and effort to learn about the community. Find out who is most at
risk from the selected risk issue. The success of the program will depend upon it.
Omitting this step (or not performing a quality analysis) can result in future ef-
forts not being directed at the correct target population.
What factors place people at greater re/injury risk?
Some population types have a disproportionately higher rate of morbidity and mor-
tality. (Morbidity refers to injuries and mortality refers to deaths.) Several factors
increase the risk level of a population segment:
• Age:childrenunderage5andadultsoverage65.
• Disability,includingcognitiveanddevelopmental,mobility,visual,andhearing.
• Socioculturalandeconomicstatus.
• Gender:Maleshistoricallyexhibithigherreandinjurymorbidityandmortality
rates.
• Languageandcommunicationsbarriers.
Identify Target Areas and
Populations

1-20
Several national organizations have conducted research on high-risk populations.
Apply their conclusions to your community. References are listed at the end of this
section.
Making assumptions about high-risk populations can be a dangerous strategy. Guess-
ing which interventions will work among various groups of people may result in
the inability to reach this audience effectively.
A disability can affect a person’s ability to react and respond effectively to an emergency in
progress. Disabilities can affect any population.
Cognitive and developmental disabilities refer to a person’s inability to process information.
Mobility refers to a person’s ability to move about. Vision and hearing refer to the ability to
process sight and sound. Poverty generally increases the risk of fire and injury.
Social and cultural diversity are realities in all communities. Changing family structures, peer
influences, and language diversity are all examples of social and cultural issues that must be
considered when planning to address risk.
A person’s vulnerability to risk can dramatically increase when several of the above-listed
factors apply to that person.
Example: A visually-, mobility-, and hearing-impaired older adult living in poverty will be at
substantially increased risk of unintentional injury or fire.
Once a specific risk issue has been identified, the affected populations profiled, and the loca-
tion of occurrences plotted, the next logical step is to learn why the risk exists.
This is the time to consider the sequence of events and root factors that led to the existence
of the selected risk event.

1-21
Why examine the events and root causes that led to the problem?
An effective risk reduction intervention requires investing the time to obtain facts about what
is causing the local risk in order to create an objective community profile and problem state-
ment.
Event sequencing and root factor exploration can be conducted in two ways:
1. If a good incident reporting system is available, the data may be obtained there.
Example: NFIRS 5.0 reporting software includes a section for human actions contribut-
ing to an event.
2. If reporting system data are not available, an organization may decide to conduct post-
incident interviews with victims to determine actions that led to an event.
Interviewing people who have experienced a fire or injury provides valuable insight into
why it is occurring.
Effective research is accomplished by asking the question “Why?”

1-22
Safe City Example
The Safe City Fire Department found that older adults who left food cooking unat-
tended on the stove caused most cooking fires. The fire department interviewed 25
older adults who had experienced this type of fire.
A profile of the typical sequence of events and root factors leading to the local cooking
fire problem identified the following elements:
• Apersonbeginsthecookingprocess,usuallyonthestovetop,andturnstheheat
on high. Why? Poor eyesight causes the person to have trouble seeing the control
setting.
• Thepersonleavesthekitchenwhilecookingforvariousreasons(telephone,tele-
vision, bathroom, etc.). Why? The person leaves the room intending to come right
back but gets sidetracked and forgets the stove is on (e.g., starts watching televi-
sion or talking on telephone).
• Theunattendedpanignitesonstovetop.Why?Heatissetathightemperature.
• Thesmokealarmalertsthepersontothere.Why?Thealarmisinworkingcondi-
tion and the person hears the alarm.
• Thepersonreturnstokitchenandrespondsinappropriatelybyremovingtheam-
ing pan from the stove and carrying it away. Why? The person does not know the
appropriate response to a stovetop fire, which is to turn off the heat and cover the
pan with a lid.
• Thepersonisburned.Why?Thepersondropstheamingpanathis/herfeetand
spills the burning food.
• Theredepartmentisnotied.Why?Thepersonishurtandrealizesthereis
now out of control.

1-23
Fire and injury prevention can be studied using a scientific approach. The process of develop-
ing a sequence of events and identifying the root cause shows how and why risk events are
understandable, predictable, and preventable.
Summary
A community risk analysis identifies fire and life safety problems and the demographic char-
acteristics of those at risk in a community. A risk analysis provides insight into the most
significant fire and life safety problems and the people who are affected by them. The results
create the foundation for developing risk reduction and community education programs.
Conduct a
Community
Risk
Analysis
Develop
Community
Partnerships
Create an
Intervention
Strategy
Implement
the
Strategy
Evaluate
the
Results
Identify
Possible
Partners
Interpret
Community Risks
and Problems
Form a
Community
Planning Team
Step 2: Develop Community Partnerships

Chapter 2
Step 2: Develop Community Partnerships
Introduction
There are many reasons for developing community partnerships. The main reason should be
obvious. Consider this example: There is a major forest fire in a remote area. A single fire
department is sent to fight it with one engine unit and one firefighter. No matter how much
effort is expended, the fire is just too big to be affected in any significant way without addi-
tional help. The same is true when attacking a significant community fire or injury risk. One
person or organization will find it impossible to make a positive change without assistance.
Just like fire suppression, public education aimed at reducing community fire and injury risk
is serious business. When suppressing fires, most departments rely on mutual aid from other
organizations. The same strategy should be applied to community risk reduction programs.
Having one or more partners makes sense in terms of having more minds, bodies, and re-
sources to tackle the problem. Sharing the tasks of targeting the problem, developing a plan,
and implementing the solution is more productive in terms of creativity, credibility, and
overall effectiveness. The most successful risk reduction efforts are those that involve the
community in the planning and solution process.
What community resources are needed for risk reduction?
When the term “resources” is used, many people immediately think of money. It is true that
financial funding is needed to reduce most risks. However, money alone will not accomplish
anything. A broader spectrum of resources is required to conduct a successful risk reduction
effort. Examples of additional important resources include the following:
Knowledge: Knowledge of the problem and possible solutions, including a factual descrip-
tion of the community and its associated risks, is very important. Such knowledge is needed
for an accurate community risk analysis.
There are always many people and groups that will be able to offer insight into the communi-
ty, the people who live and work in the community, and the risks found in the community.
Think teamwork! As with reghting, and even baseball, community risk reduction
is best done by a group working together.
The work of a single organization aimed at reducing risk will cost a lot over the long
haul in terms of money, time, and effort spent, with little to show for all the effort.
2-1
It is up to the community educator to identify them and work with them to reduce the
risks.
In-kind support: This involves resources provided in lieu of money, including equipment,
printed materials, supplies, and personal effort. Donated professional services such as con-
sultations, program evaluations, and graphic design work are all examples of in-kind re-
sources.
Political support: Support for the risk reduction process from elected officials is very helpful
to finding success. The public educator should discuss any plans or ideas with elected officials
who have a stake in the program outcome. These people may know how additional resources
can be obtained, and often will have information important to program development.
Community support: Partnerships with people and organizations in the community can
identify risks, planning measures, and resources required to get the risk reduction process
started and the program implemented.
Emphasis is often placed on nances, but additional resources are equally important.
Identify Possible Partners
What is a community partner?
A community partner is a person, group, or organization willing to join
forces and address a community risk. It is important to identify a group of
partners who have a stake in the success of the risk reduction program.
How does the public educator nd help?
An easy way to start finding help is to just start networking and talking to people you know.
In addition, the use of the Internet and telephone directory is an easy way to start. A logical
first step is to find out which groups might be interested in a specific risk reduction effort or
already are addressing the selected risk issue. It is important to avoid duplication of effort.
Think about what part of the population needs to change in order to reduce the risk. Con-
sider which groups are already providing services to these people. Think about those in the
community who care about the risk issue and the people it is affecting.
These people may be the best ones to deliver the message. Another approach is to find out
who has the resources needed to address the problem.
2-2
Bottom line questions: Which people are the movers and shakers in the community who
will help get the effort started and the job done? Who can offer leadership, skills, credibility,
contacts, influence, and resources?
These are some possible community partners;
• groupsalreadyinterestedoraddressingthesameorasimilarriskissue;
• membersofthepopulationwhoareaffectedbytheriskissue;
• people/groups who feel thenancial impact of therisk issue(insurancecompanies,
property owners, American Red Cross disaster services);
• groupsalreadyprovidingservicestothepopulationaffectedbytheriskissue;
• communityserviceandadvocacygroups;and
• groupsthatcanhelpdelivermessages(media,clergy,schools,marketingorganizations).
2-3
Recruit a core group of primary stakeholders who will share the responsibilities of
developing and implementing a quality risk reduction effort.
Working alone may seem like a good idea; however, failure to obtain the perspec-
tive of, and creative input from, others will limit risk reduction efforts.
Interpret Community Risks
and Problems
Don’t expect everyone in the community to recognize instantly that a par-
ticular problem exists. Instead, expect them to be part of the solution pro-
cess by educating them about the problem. Use the community profile and
problem statement as the powerful tool that it is. This work provides a good
rationale for why others should consider partnering. Share the vision of the
plan and possible solutions with community leaders.
The most effective risk reduction efforts are those that involve the community in the planning
and solution process. The community needs to understand and agree that there is a problem
and that it can be solved. Sharing the information you have collected in a professional man-
ner will be important. Be sure to explain how and where the information was obtained. Then
work with others to continue the process of interpreting the community risk problem.

Discuss your organization’s intention of forming a planning team to reduce
the risk problem. Explain what resources your organization can provide.
• Askthepersonorgroupifhe/she/itwilljointheplanningteamtoad-
dress the issue.
• Solicitsuggestions frompeopleandgroupsaboutotherswhowill make
good partners.
2-4
Form a Community
Planning Team
Allow others the opportunity to provide suggestions.
Trying to state your proposed solution as the only solution will prevent others from
offering important insights and suggestions.
Additional benets of community planning teams
Community planning teams often lead to the development of formal coalitions. A coalition is
a group of people with different interests who come together to work on a common problem
or issue.
Examples of coalitions that exist in many communities:
• localchapteroftheNationalSafeKidsCoalition;
• localchapterofMothersAgainstDrunkDrivers;
• localCrimeStoppers/SolversCoalition;and
• neighborhoodassociations.
Coalitions usually include a broad representation of people from the community and lend
themselves well to the advancement of political issues. Using integrated prevention interven-
tions to reduce fire and injury risks often requires extensive community and political sup-
port.

2-5
Summary
Community partnerships are needed in order to reduce any significant fire or injury risk. It is
impossible for one person or organization to reduce a serious community fire or injury risk
alone. Fire and rescue departments generally rely on mutual aid from other organizations for
fire suppression efforts. The same strategy should be applied to community risk reduction
programs.
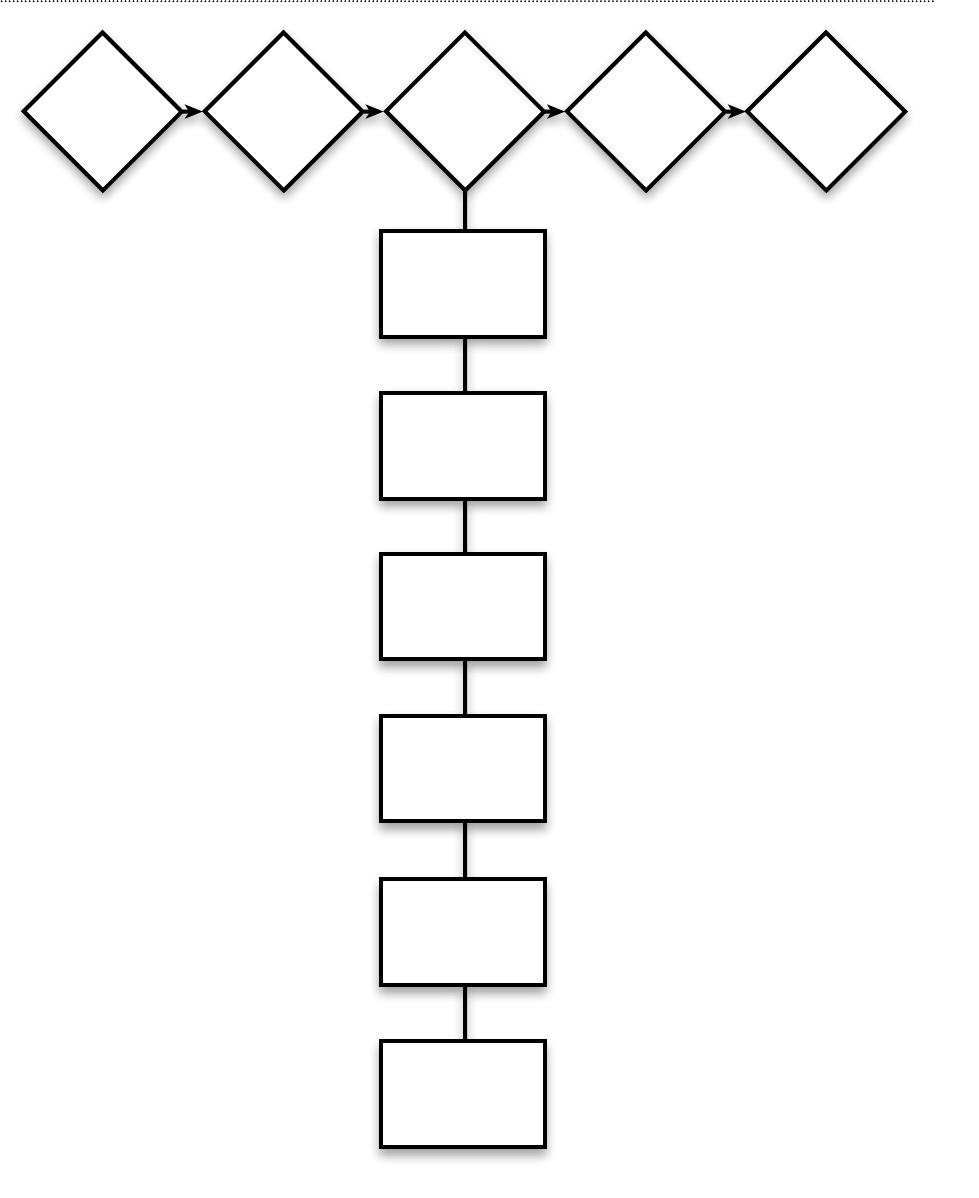
Conduct a
Community
Risk
Analysis
Develop
Community
Partnerships
Create an
Intervention
Strategy
Implement
the
Strategy
Evaluate
the
Results
Review Data
about Risks and
Ta rget Populations
Identify Places
for
Intervention
Identify Ta rget
Populations
and Locations
Identify
Interventions
Identify
Resources
Required
Develop the
Evaluation
Strategy
Step 3: Create an Intervention Strategy

3-1
Chapter 3
Step 3: Create an Intervention Strategy
Introduction
What is an intervention strategy?
An intervention strategy is the beginning of the detailed work necessary for the development
of a successful fire or life safety risk reduction program. The strategy should include what
will be done, where it will be implemented, how the implementation will occur, and who
will conduct the program once it is developed. It also should include an evaluation compo-
nent that measures the effectiveness of the process and the program. Creating an intervention
strategy requires a carefully thought-out plan of action developed through a group effort.
Why develop an intervention strategy?
Consider these questions:
• Would a pro football coach send a team to the Super Bowl game without an action
plan?
• Wouldthecommander-in-chiefoftheU.S.militarysendalliedforcesintobattlewithout
a plan of attack?
The answer to both questions: Of course not! Yet too many times an emergency service orga-
nization will try to address a community risk without an organized plan of action. Just as in
the two examples above, money and lives are at stake.
Developing an intervention strategy is as important as conducting pre-emergency planning
for high-hazard occupancies within a community. Taking the time needed to design a quality
intervention strategy will help gain long-term risk reduction success.
An organized sequence of events should guide the development of the strategy. These events
can be described as follows:
• convenethecommunityplanningteamandreviewthecommunityproleandtheprob-
lem statement;
• identifyplacesforintervention;
• identifypotentialtargetpopulationsandthephysicallocationsforinterventionopportu-
nities;
• identifyspecicinterventions;
• identifyrequiredresources;and
• developanevaluationplan.
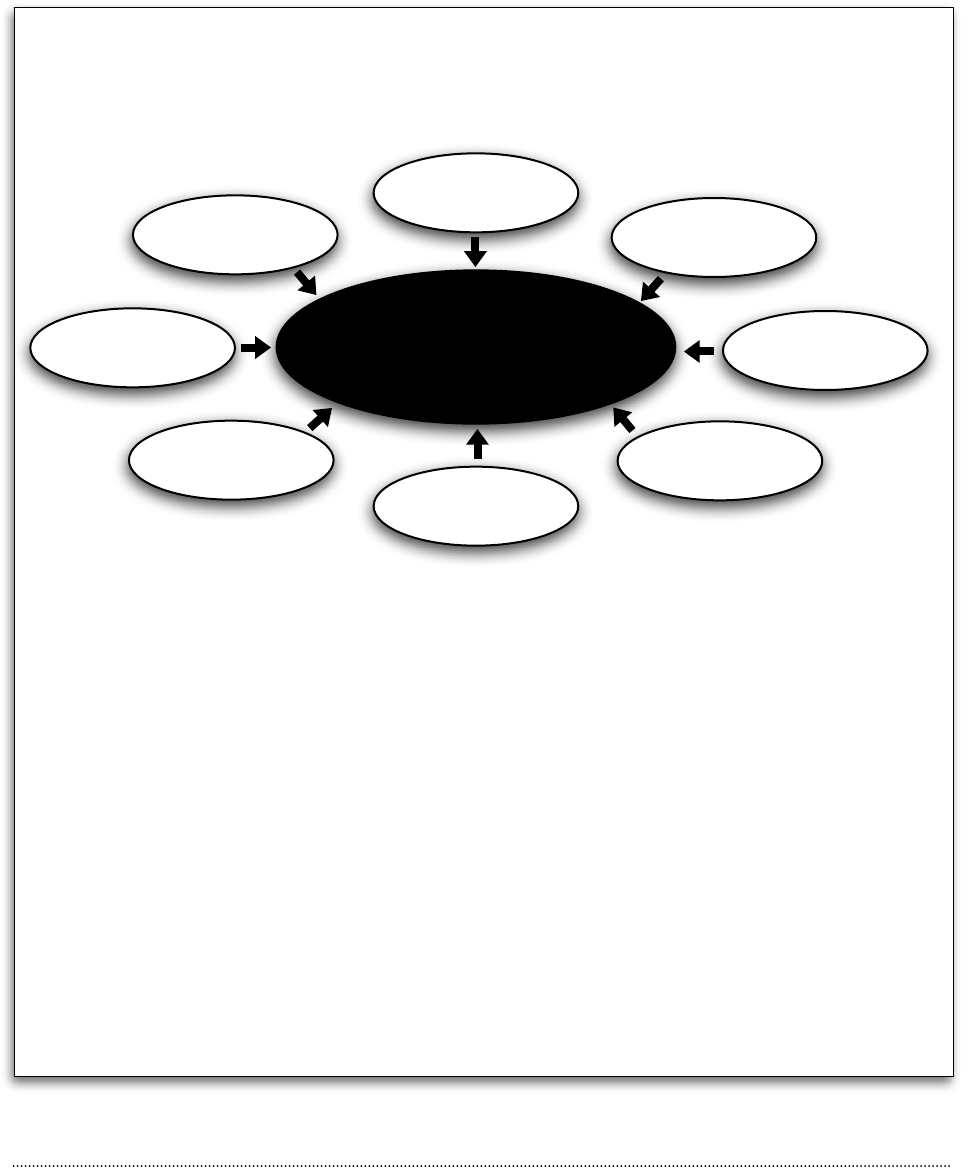
3-2
The planning team
A community planning team is comprised of a core group of individuals who have a primary
stake in the community risk issue or can offer key resources to the intervention process.
Safe City Example
Safe City selected the following planning team members:
• thecommunityeducator(andpossiblyselectstaff)fromtheSafeCityFireDepart-
ment;
• membersofthepopulationaffectedbythecookingres(olderadultswhoresideat
the housing units);
• thepropertyowner(cityhousingauthority)ofthestructuresbeingdamagedbythe
fires;
• communityserviceproviders(foodandhealthservices)whoservetheolderadult
population;
• familymembers(children)oftheolderadultpopulation;
• thepresidentoftheHousingUnitTenantAssociation;
• media(TV,radio,newspaper)representatives;
• arepresentativefromthelocalCommissiononAging;
• aprofessionalexperiencedinmarketresearch;and
• aprofessionalexperiencedinorganizingandperformingprogramevaluations(op-
tional).
Community
Planning Team
Market
Research
Property
Owners
Family
Members
Fire Dept.
Program
Evaluator
Affected
Population
Media
Service
Providers

3-3
Review Data about Risks
and Target Populations
The planning team must review the community profile and the prob-
lem statement so that everyone on the team has a factual description
of the community and the problem. It is also important for the team
to review the sources of the information used to develop the com-
munity profile and problem statement.
Develop a goal
A goal is a broad statement about the problem and the new condition
the planning group would like to create.
Safe City Example
Problem: A high number of cooking fires are occurring within the homes of older
adults residing in city-owned housing units.
Goal: Decrease the number of cooking fires occurring within the homes of older adults
residing in city-owned housing units by 25 percent in the first year, and then continue
decreasing that number by an additional 25 percent in the 2 succeeding years.
Here is an example of a goal developed by the Safe City planning team in response to the
cooking fire problem:
Identify Places
for Intervention
Review the analysis of the selected risk
Once the planning team has established a goal, the sequence of how
and why a typical incident occurs should be revisited.
The planning team also should review the sequential analysis of a
typical incident so that a broad range of prevention interventions can
be considered. Consider the following possibilities:
• Apersonbeginsthecookingprocessonastovetop.Theheatis
turned on high because the person has trouble seeing the con-
trol setting.
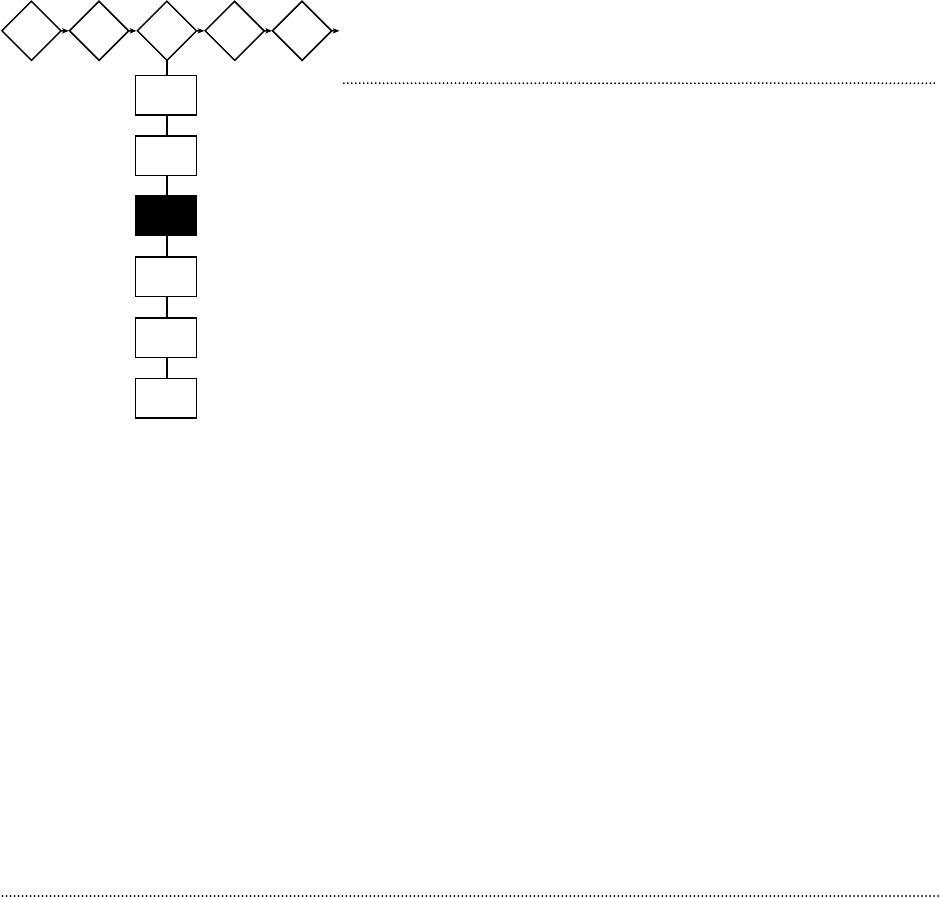
3-4
Identify Target
Populations and Locations
Initial targeting efforts were started during the community risk
analysis section. It is now time to pinpoint as exactly as possible
what efforts will be addressed, to whom, and where.
It is critical for the planning team to identify very carefully who the
risk affects most often and where it happens.
A target population is the group from which knowledge gain, be-
havior, and environmental modifications are being sought.
Example: The community planning team with the cooking fire
problem already has identified these important facts:
• Thecookingreproblemmostoftenaffectstheolderadultpopulationresidingindepen-
dently within city-owned housing units.
• Knowledge gain, behavior, and environmental modications must take place in these
households if successful risk reduction is to occur.
• Thehousingunitsrepresentalogicalplacetodirectinitialeffortsbecausesupportfrom
both tenants and city officials is a realistic possibility.
Where the risk most often occurs is related to the population affected by the risk. In the above
case the housing units represented a logical place to direct efforts. Another way to character-
ize where the risk occurs is to look at the geographic distribution of the risk in the city or
• Apersonforgetsthestoveisonandleavestheroomtowatchtelevisionortalkonthe
telephone.
• Anunattendedpanignitesonstovetopbecausetheheatissettoohigh.
• Thesmokealarmdoesn’talertapersontoarebecausethealarmisnotinworkingcon-
dition.
• Apersonreturnstothekitchenandperformsinappropriateactions(forexample,car-
rying a flaming pan from the home) because the person doesn’t know the appropriate
response to a stovetop fire.
Each of these scenarios has different implications for the most effective intervention.

3-5
county. In Chapter 1: Conduct a Community Risk Analysis the geographic component of the
analysis process is discussed.
Once the team has identified all of the possible interventions, the primary population seg-
ment affected, and where the risk occurs most often, it is time to conduct market research.
Conducting market research
Market research is the process of learning about a population from that population. It in-
volves direct communication with members of the target group. The goal is to gain insight
into how risk reduction efforts should be designed and conducted.
Market research can be accomplished through direct interviews with people or by holding
a focus group meeting. A focus group meeting includes people from the target population.
These individuals offer insight into how their peers best receive and respond to information
and requests. They also can provide important information about social and cultural issues
specific to the group.
It is possible to enlist the services of a professional who specializes in market research. Per-
haps this person or group may provide some services as an in-kind contribution to your
organization.
Market research is a critical step in the risk reduction process that must not be overlooked.
Do not assume you know everything about the target population. Seek information about a
group’s social, cultural, and political climate from members of the group.
If members of the proposed target population are not involved in the planning and solution
process, the group may reject any intervention strategy that you attempt to implement. Don’t
take that chance!
Successful risk reduction efforts are more likely to be effective when the members of the
target population:
• areawareoftheproblem;
• understandtheproblemandthefactorsthatcontributetoit;
• believethemselves,ortheirlovedones,tobepersonallyatrisk;
• believethattheriskisunacceptableandserious;
• understandthatsolutionstotheproblemexist;
Remember: people generally do not like having things done to them. Getting peo-
ple to accept new ideas and make behavior changes can be a challenging process.
Working with people from the target community from the beginning is vital to the
success of the project.

3-6
• believethatchangingtheirbehaviorwillreducetherisk;
• believethatthebenetstochangeoutweighthebarriers;
• believethattheyarecapableofmakingtheexpectedbehavioralchange;
• areinvolvedwiththeprocessfromthebeginning;and
• haveanopportunitytoprovideinputandsuggestions.
Remember: the people from whom you are asking advice will offer valuable infor-
mation about what may or may not work. Listen to them!
Failure to heed advice from the community may result in the creation of a risk re-
duction strategy that is rejected by the target population.
Let’s look at a successful effort:
Safe City Example
Safe City conducted interviews with older adults at the housing units. A local market re-
search professional also helped conduct a focus group meeting. This is what was learned
about their older adult population through market research:
• Theirolderadultpopulationwasunawareoftheexistingcookingreproblem.Results
of a survey conducted by the housing authority revealed that only 10 percent of resi-
dents could identify cooking as the leading cause of fire.
• Membersofthegroupbelievedtheywereverysafefromreintheirhomes.
• Oncetheyweremadeawareoftheproblem,thegroupbelievedtheycouldbeatrisk.
They were most concerned about those with mobility, vision, and hearing difficul-
ties.
• Groupmembersbelievedthattheirpeerswouldhelpwithpreventionefforts,once
they became aware of the problem and its potential solutions.
• Thegrouprespectsthelocalemergencyservicesasacrediblesourceforriskandpre-
vention information.
• Whenreceivinginformation,groupmemberspreferdirectcontactwithpeoplethey
know and trust. Examples: service providers, housing management, and fire depart-
ment.

3-7
Once market research has been conducted and analyzed, the planning team must make some
important decisions about what specific interventions will be pursued.
• Thegroupenjoysandrespondswelltoguestspeakersattenantassociationmeet-
ings.
• Uponreviewingthecommunityprole,problemstatementandsequentialanalysis,
the group believes the risk is serious enough to pursue an organized prevention effort.
Identify Interventions
Combined prevention interventions
At this early stage of planning, it is very important to be creative
and attempt to identify as many interventions as possible that
could be applied to each problem noted
This is an important brainstorming session for the plan-
ning team.
If this work is not performed, an important intervention
that may prove to be effective may be overlooked.
Most successful risk reduction efforts make use of combined prevention interventions. If the
planning team with the cooking fire problem simply sends out a brochure about cooking fire
prevention that urged older adults to be more careful, the cooking fire problem will not drop
significantly. Combined prevention interventions include
• Education: Providing information (facts) about risk and prevention.
• Engineering: Using technology to create safer products or modifying the environment
where the risk is occurring.
• Enforcement: Rules that require the use of a safety initiative.

3-8
Treat risk reduction as a science. Community partners and target populations
must understand why risk occurs and how it can be prevented.
Let’s examine how to use combined interventions to address the cooking fire problem in Safe
City for each possible scenario (the sequence of how and why a typical incident occurs).
Safe City Example
A person begins the cooking process on a stovetop. The heat is turned on high because
the person has trouble seeing the control setting.
Intervention Ideas:
Education: Teach the older adults to cook with lower heat.
Engineering: Modify heat settings on stoves; provide better lighting at stovetops; make
temperature dials easier to read.
Enforcement: Require modifications to stoves and stovetops.
A person forgets the stove is on and leaves the room to watch television or talk on the
telephone.
Intervention Ideas:
Education: Educate the older adults to stay in the kitchen when using the stove.
Engineering: Relocate the TV and telephone to the kitchen area and/or install an alarm
on the stove that sounds a warning that the device has been left unattended.
Enforcement: Require the TV and telephone to be near the kitchen area; require an
alarm on stove; institute a penalty for people having an unattended cooking fire.
An unattended pan ignites on stovetop because the heat is set too high.
Intervention Ideas:

3-9
Education: Teach the older adults to stay in the kitchen and cook with lower heat.
Engineering: Create a stove that uses lower temperatures; install a stovetop fire sup-
pression system; install fire-resistant building materials at the stove area.
Enforcement: Require installation of the above-listed equipment/materials.
The smoke alarm doesn’t alert a person to a fire because the alarm is not in working
condition.
Intervention Ideas:
Education: Reinforce the importance of working smoke alarms.
Engineering: Hard-wire smoke alarms and alarm systems into home electrical sys-
tem; upgrade alarms to add enhanced audiovisual warnings.
Enforcement: Require updated smoke alarms and alarm systems; institute penalties
for nonworking alarms.
A person returns to the kitchen and performs inappropriate actions (for example, car-
rying a flaming pan from the home) because the person doesn’t know the appropriate
response to a stovetop fire.
Intervention Ideas:
Education: Educate the older adults about what to do if a stovetop fire occurs.
Engineering: Install an automatic stovetop fire extinguishing system.
Enforcement: Require the installation of an automatic extinguishing system.
Do not cut corners with this step! Time and effort are required to consider and
plan for the use of combined interventions. Used alone as an intervention, educa-
tion may not produce the desired level of risk reduction.
After many intervention ideas have been identified, begin isolating specific and realistic areas
within the sequence to intervene.

3-10
Identify Resources Required
By following an organized process, the planning team develops an
idea of what risk interventions might work and how best to get the
job done. The next step is to identify the types of interventions that
will be pursued and the supporting resources they will require.
Although it is important to aim high and pursue the use of com-
bined interventions, be realistic when designing the intervention
strategy. Not every intervention identified during the sequencing
process can possibly be implemented.
Using the community profile, problem statement, market research,
and resources available the planning team should select interven-
tions that have a reasonable chance of success.
Education intervention resources must be tailored to meet the needs of the local community.
Materials must target the population and focus only on the key program messages. They must
be created after your target injuries, population, intervention strategies, and implementation
methods are established. Consult with your target audience and potential users concerning
materials. They can tell you whether the materials do what you want them to do and how to
revise them if necessary.
“Off the shelf” materials that have been developed by organizations such as the NFPA or the
USFA can be useful in addressing local needs. It may be necessary to create local materials
in order to address the specific needs of your community. If “off the shelf” materials do not
have copyright restrictions then they can, in some cases, be modified to meet local needs.
As an example, let’s look at the interventions that Safe City decided to pursue. Also included
is the rationale for selecting each intervention and the resources that will be needed.
Safe City Example
Educational intervention: Provide awareness education about the cooking fire problem
and proposed solutions to those who often interact with the older adult population re-
siding in city-owned housing units.
Rationale: Those who frequently interact with the older adult population have the capa-
bility of delivering and reinforcing safety messages.

3-11
Resources needed: Consultation, collaboration, and support will be needed from all
groups that are represented on the planning team.
Educational intervention: Provide awareness education about the cooking fire prob-
lem and proposed solutions to the older adult population residing in city-owned hous-
ing units.
Rationale: This is the population directly responsible for the occurrence of the problem.
Their homes are catching fire! Behavior change is needed in this group.
Resources needed: Direct delivery of the message and political support of the proposed
combined interventions.
Engineering intervention: Modification of the older adults’ kitchens, including:
Short term:
• improvelightingnearstove;
• installstoveknobswithlarger-printsettings;
• installatelephoneinthekitchen;and
• locatetelevisionwithinsight/hearingdistanceofstove;
Long term:
• installre-resistantwallcoveringnearstovearea;
• installautomaticreextinguishingsystemoverstovetop;
• upgrade smoke alarms and alarm system, including enhanced audiovisual warings;
and
• replaceagingstoveswithnewunitsthatshutdownpriortoignitiontemperature.
Rationale: Relying on education as a single intervention may not produce a significant
drop in cooking fires, injuries, and property losses. Modifications to the kitchen envi-
ronment and equipment should result in a safer food preparation area.
Resources needed: Employing engineering interventions and environmental modifica-
tions will take time, planning, and support. Funding, in-kind services, and political sup-
port must be sought from the groups represented on the planning team—in this case
specifically, the city, housing authority, and tenants.
To sum it up: There must be a clear understanding of your community, its risks, the people,
and the political climate to construct an effective intervention strategy.
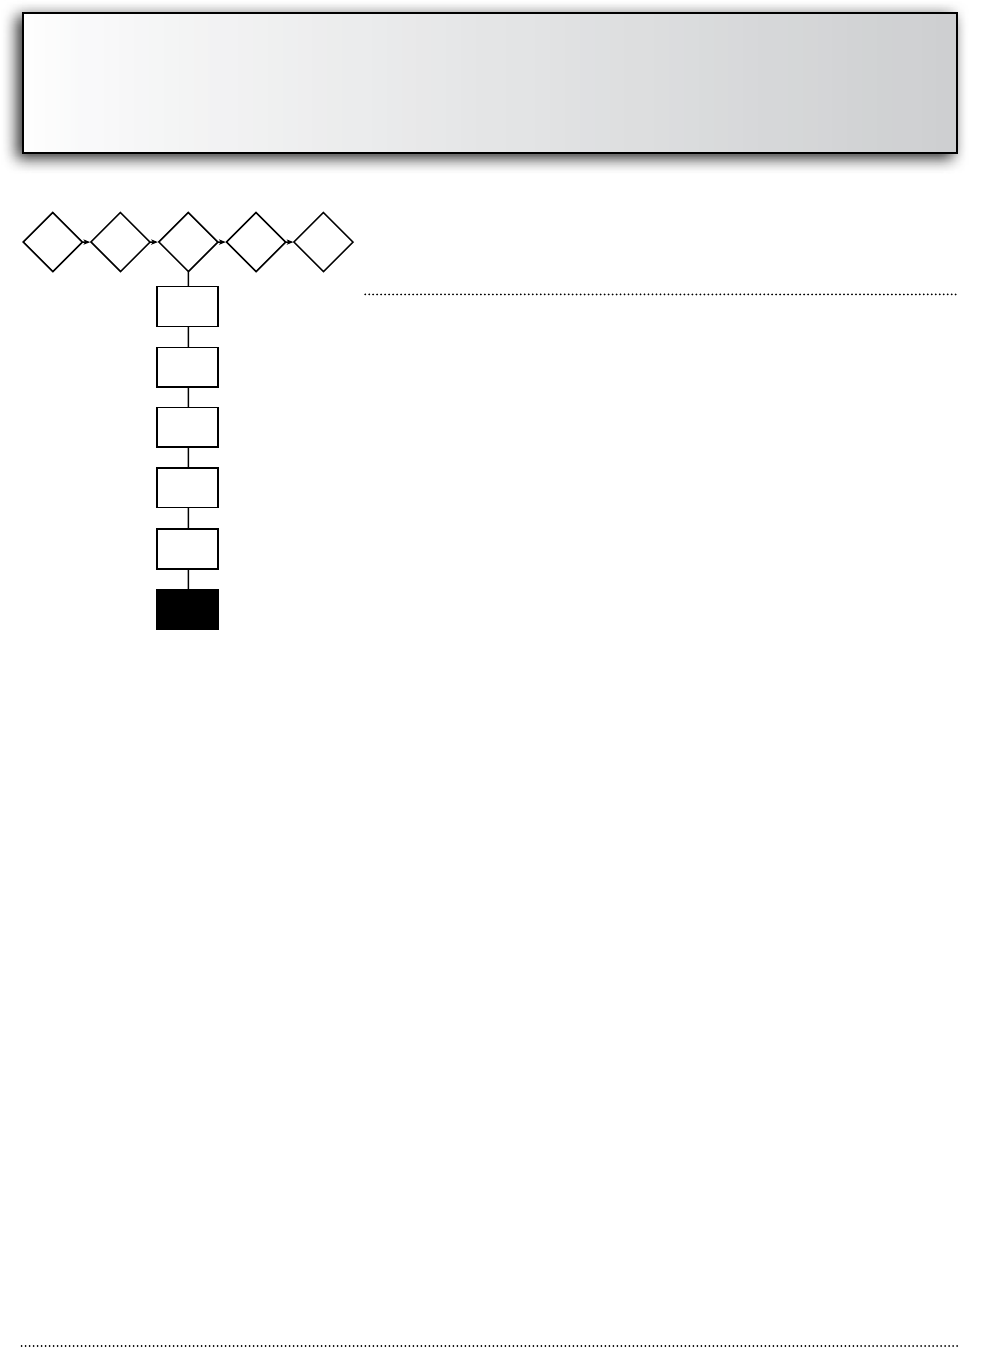
3-12
The use of combined interventions often requires extensive political support.
Obtaining such support will take time and effort but is well worth it. Now is the
best time to start planning for the future.
Develop the
Evaluation Strategy
The planning team has more work to do. Development of an evalu-
ation component is critical so that the effectiveness of the program
can be determined. This component is called the evaluation plan.
The evaluation plan is a critical component of the intervention strat-
egy. The plan outlines the following:
• Specictaskstobeperformed.
• Timelineforcompletionofthetasks.
• Benchmarksthatwillbeusedtomonitortheprogressandsuc-
cess of the intervention strategy.
Benchmarking is the comparison of various measures of effectiveness, performance, and cost
to relevant standards, or benchmarks. The term comes originally from the field of surveying,
where the benchmark is the topographical high point that serves as the point of reference
against which all other elevations are measured. In the fire service the benchmark might be
the fire rate for the State as a whole, or the national average, or the average of all those com-
munities that local citizens and politicians see as equivalent to their jurisdiction.
One of the most useful benchmarking techniques is to calculate the average of a group of
appropriate comparable communities. Therefore, the community will have a higher or lower
fire rate, death rate, or injury rate than the average for communities of its size or composition.
The comparison also can be made to the State or national average in the relevant categories.
To measure that to a more exact standard, it is very easy to figure percentage comparisons to
the average.
Why develop an evaluation plan?
Everyone has been involved with a project that failed because people or committees didn’t
follow through on what they promised to do.
Far too many times, a group starts out with the best intentions of completing a task only to
have the effort fail because the group lacked an organized plan to keep things on track.

3-13
Adding an evaluation plan to the intervention strategy will help keep the risk reduction effort
on track to reach the intended goal.
What is included in an evaluation plan?
An evaluation plan includes the problem statement, goal, and a series of objectives that sup-
port the goal. The objectives allow the evaluation of three levels of performance: outcome,
impact, and process.
Here is an explanation of the three levels of evaluation:
• Theoutcomeportionoftheevaluationmeasuresendresults.Examplesincludechanges
in the occurrence of the specific risk issue, dollar loss, and the number of injuries and
death.
• Theimpactportionoftheevaluationmeasuresknowledge,behavior,andenviron-mental
changes and also tracks changes in policy and legislation.
• Theprocessportionoftheevaluationmeasurestheeffectivenessoftheprogramactivity,
the outreach effort, and the team members.
Why write objectives?
Having specific objectives will clearly identify
• whatisgoingtobedone;
• whoisgoingtodoit;
• whenitisgoingtogetdone;and
• whatthespecicprogrambenchmarksare.
Characteristics of well-written objectives
Well-written objectives have the following characteristics:
• Theobjectivesarespecic:theyclearlyidentifywhatwillbedone,whowilldoit,and
when.
• Theobjectivesaremeasurable:theyincludeabenchmarkofwhatlevelofperformanceis
being sought.
• Theobjectivesareachievable:themeasurementofdesiredperformanceisrealisticbased
on local factors such as characteristics of the target population, social issues, and political
climate.
• Theobjectivesareconsistentwiththegoal:theydirectallactivityandperformanceto-
ward achieving the overall goal.

3-14
How do you create an evaluation plan?
The first and most important step in developing an evaluation plan is to understand that
creating the evaluation plan is relatively simple. The hardest work (the intervention strategy)
already has been completed.
The evaluation plan is created based on the intervention strategy. It simply involves finding
out where the community is statistically (baseline) and plotting where the community wants
to be (benchmark). In the case of outcome and impact objectives, a baseline measurement is
required, so that existing conditions can be compared with future performance.
Let’s look at the interventions the Safe City, USA, team decided to pursue, and look at the
evaluation plan it prepared.
Safe City Example
Educational interventions:
• Provideawarenesseducationaboutthecookingreproblemandproposedsolu-
tions to those who often interact with the older adult population residing in city-
owned housing units.
• Provideawarenesseducationaboutthecookingreproblemandproposedsolu-
tions to the older adult population residing in city-owned housing units.
Engineering interventions: Make short-term and long-term modifications in older
adults’ kitchens.
Enforcement interventions: Require the city to proceed with the identified engineer-
ing interventions and environmental modifications.
Here’s an evaluation plan for the intervention strategies selected by the Safe City plan-
ning team.
Evaluation Plan
Problem: A high number of cooking fires occur within the homes of older adults re-
siding in city-owned housing units.
Goal: A significant decrease in the number of cooking fires occurring within the
homes of older adults residing in city-owned housing.
Outcome Objective: Within 4 years, the number of cooking fires that occur in homes

3-15
of older adults residing in city-owned housing units will be reduced by more than 50
percent.
Recall that Safe City Fire Department learned in its community risk analysis that one
half of its yearly average of 40 cooking fires occurred in older-adult housing units. The
baseline for measurement is therefore 20 cooking fires per year.
Note: An evaluation plan usually has one outcome objective. The reason: Outcome
measures the bottom line–the degree to which the program has reduced occurrence
of risk, dollar loss, and injuries or deaths. Outcome objectives are usually expressed 3
to 5 years in advance. Impact objectives can be expressed within 1 to 3 years. Process
objectives can be expressed within a timeframe of 6 months to 2 years.
Method of evaluation: Annual response statistics.
Group responsible: Fire department staff and the planning team, led by a community
educator.
The following impact objective and four-process objectives support the educational
interventions outlined in the intervention strategy:
Impact Objective: Within 2 years, 70 percent of older adults living in city-owned
housing will identify cooking as the leading fire cause and state appropriate preven-
tion/reaction strategies
The baseline for measurement is 10 percent. Recall that the planning team asked the
housing authority to survey older adults and seek opinions on the leading cause of fire.
Only 10 percent of residents identified cooking as the leading cause.
Method of evaluation: The results of a second housing authority survey conducted after
completion of educational interventions.
Group responsible: Fire department and housing authority staff; planning team mem-
bers.
Process Objective 1: By the end of 6 months, 100 percent of the planning team
members will have conducted cooking fire awareness training with their organiza-
tion’s staff.
Method of evaluation: The organization’s record of training.
Group responsible: Planning team members.

3-16
Process Objective 2: By the end of year one, 80 percent of the organizations repre-
sented by planning team members will be conducting cooking fire awareness efforts
among the older adult population residing in city-owned housing units.
Method of evaluation: The organization’s record of staff activity.
Group responsible: Planning team members.
Process Objective 3: By the end of year one, the fire department will have presented
cooking fire awareness programs at all city-owned older-adult housing units.
Method of evaluation: Fire department staff activity records.
Group responsible: Fire department staff, led by a community educator.
Process Objective 4: By the end of 18 months, the fire department (supported by
members of the planning team) will have made direct in-home contact with 50 percent
of older adults living in city-owned housing to discuss cooking fire awareness.
Method of evaluation: Fire department record of visitations.
Group responsible: Community educator, fire department staff, and planning team
members.
Why this intervention and evaluation strategy will be successful
Safe City has set itself up for a successful risk reduction outcome. Its intervention and evalu-
ation strategy will lead to success because:
• Thestrategyisbasedonfacts.Thecommunityproleandproblemstatementarebasedon
information obtained through a close examination of the local community.
• Thestrategyisspecic.Thestrategyfocusesontheleadingriskissue(cooking)and
population (older adults) most affected by the risk.
• Thestrategyisrealistic.Thestrategyfocusesonolderadultslivingincity-ownedhousing.
It is realistic because the core group of primary stakeholders is relatively small.
This strategy is a good starting point for gaining the political support needed to promote and
use combined prevention interventions.

3-17
• Thestrategyiscommunity-based.Theredepartment,planningteam,olderadults,and
housing authority will take part in the problem-solving process.
• Thestrategywillbeimplementedovertimeandwillreceiveperiodicevaluations.
• Evaluationwillbeanongoingprocesssothatactivitiescanbemonitoredandadjustedas
needed.
Summary
Creating an intervention strategy involves detailed work and a team approach in order to de-
velop a successful risk reduction effort. The strategy must include what will be done, where
it will be done, how the implementation will occur, and who will conduct the program. An
evaluation component measures the effectiveness of the process and the program. Creating
an intervention strategy requires a carefully thought-out plan of action based on a review of
the risk data, the target population, locations, and available resources.
Develop an evaluation plan with assistance from the planning team. Base the plan on
information from the community prole, problem statement, and market research.
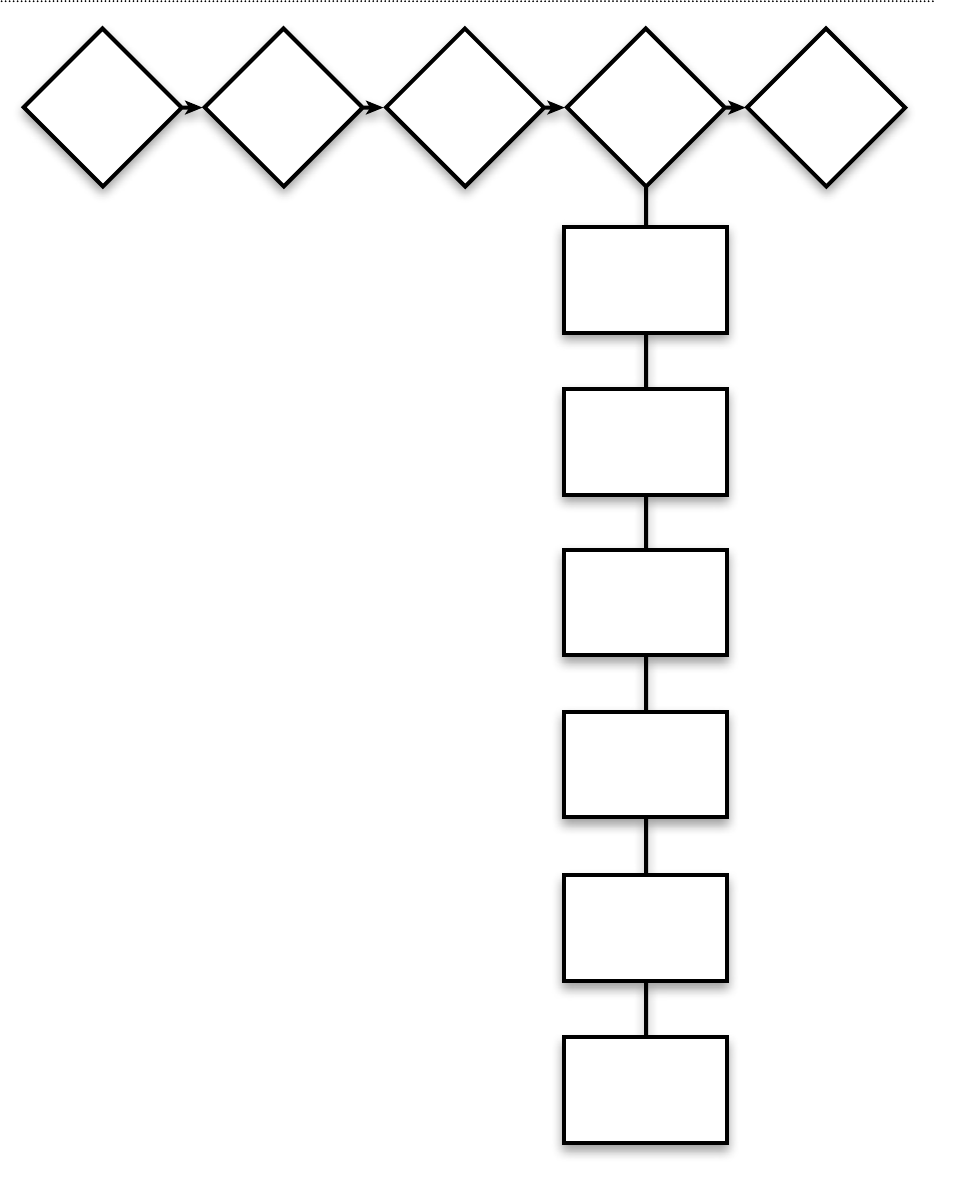
Conduct a
Community
Risk
Analysis
Develop
Community
Partnerships
Create an
Intervention
Strategy
Implement
the
Strategy
Evaluate
the
Results
Conduct Pilot of
Intervention; Revise
as Necessary
Establish
Responsibilities
and Timetable of
Activities
Market
Intervention
Programs
Initiate
Activities
Monitor
Progress
Report
Progress
Periodically
Step 4: Implement the Strategy

4-1
Chapter 4
Step 4: Implement the Strategy
Introduction
Implementing the strategy puts the plan into action
Implementing the strategy involves testing the interventions and then putting the plan into
action in the community. Sometimes modifications are made to the program as the result of
a pilot implementation. In a real sense, the implementation step is where “the rubber meets
the road.”
Think about the interventions developed by the Safe City, USA, Fire Department for the cook-
ing fire problem. The interventions included an awareness education program for the older
adults and for those whose provide services to the older adults. Other interventions included
modifications of the kitchens of older adults. The implementation plan identifies the steps to
take to bring those interventions into the community.
The implementation plan outlines the steps for implementing the program in the commu-
nity and provides the following details:
• Howtheprogramwillbeimplemented,includingwhen,howlong,where,etc.
• Itidentiestherolesandresponsibilitiesoftheprogramimplementationteam.
• Theprocessforthepilottestimplementation.
• Provisionsformakinganymodicationstotheprogrambasedontheresultsofthepilot
implementation.
• Apredeliverychecklistidentifyingtasksthatmustbedonepriortotheimplementation.
• Adescriptionofpotentialimplementationproblemsandcontingencies.
An action plan is a step-by-step outline of work that needs to be done in order to meet the
stated objective. Each objective requires its own action plan. An Action Planning Chart is a
useful tool that can be used in planning the implementation as well as in monitoring prog-
ress.

4-2
Action Plan
Goal: Objective:
Date:
Step#
Action
To Be
Completed By
Person
Responsible
Resources
Needed
Date
Completed
Figure 11: Action Planning Chart.
The actions in the implementation step:
1. Conduct pilot of intervention; revise as necessary.
2. Establish responsibilities and timetable of activities.
3. Market intervention program.
4. Initiate activities.
5. Monitor progress regularly.
6. Report progress periodically.
Develop the implementation plan by working together with the community team and rep-
resentatives from the target audience. The implementation plan simply identifies the best
approach for putting the interventions into action.
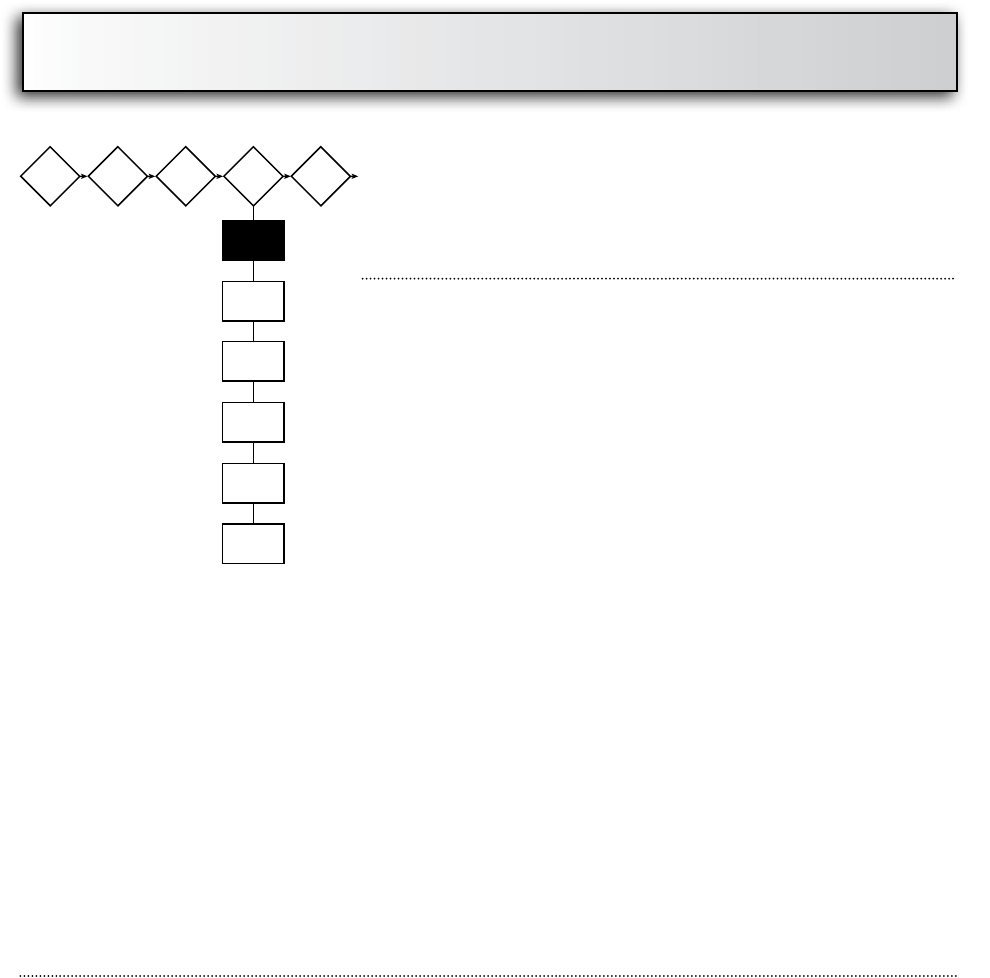
4-3
There is a temptation just to put the program into action without an implementation plan.
Take the time to develop a step-by-step implementation plan. An essential element of the im-
plementation plan is the identification of the roles and responsibilities of each team member.
One of the most common problem areas during implementation is the confusion surround-
ing who should be doing what, and when it should be done. The implementation plan clearly
spells out individual and group tasks, authority, and overall responsibility.
Some people actually will deliver the presentations. Some will assist with scheduling the
presentations and making connections with the older adults. Others will be involved in the
evaluation process. The implementation plan should describe what is to be accomplished by
each task, and when each task will be completed.
Match people with tasks that suit them well, and that they are prepared to complete.
Conduct Pilot of
Intervention; Revise as
Necessary
Why spend time on a pilot test?
The purpose of the pilot test is to identify and resolve problems
with the program. It is easy to believe that all the problems have
been worked out during the development process, but there are
always problems and challenges that occur when the program
is implemented with the target audience. The pilot program
provides an opportunity to identify problem areas, make the
needed changes, and then be prepared to complete the imple-
mentation with a proven program.
Evaluating of the pilot program involves the evaluation of two different areas: the program
results and the pilot implementation process. The implementation process includes how to
gather data, the methods to be used to interpret the data, and the people who will do the
evaluation. The information gathered as part of this process is used to modify the program
prior to full implementation.
The pilot program offers an opportunity to conduct the evaluation of the program on a small
scale. This allows more interaction with the target audience and with those conducting the
program. The evaluators should provide an objective review of the program. Remember,
evaluation is a key part of every program. If it is worth doing it is worth evaluating.
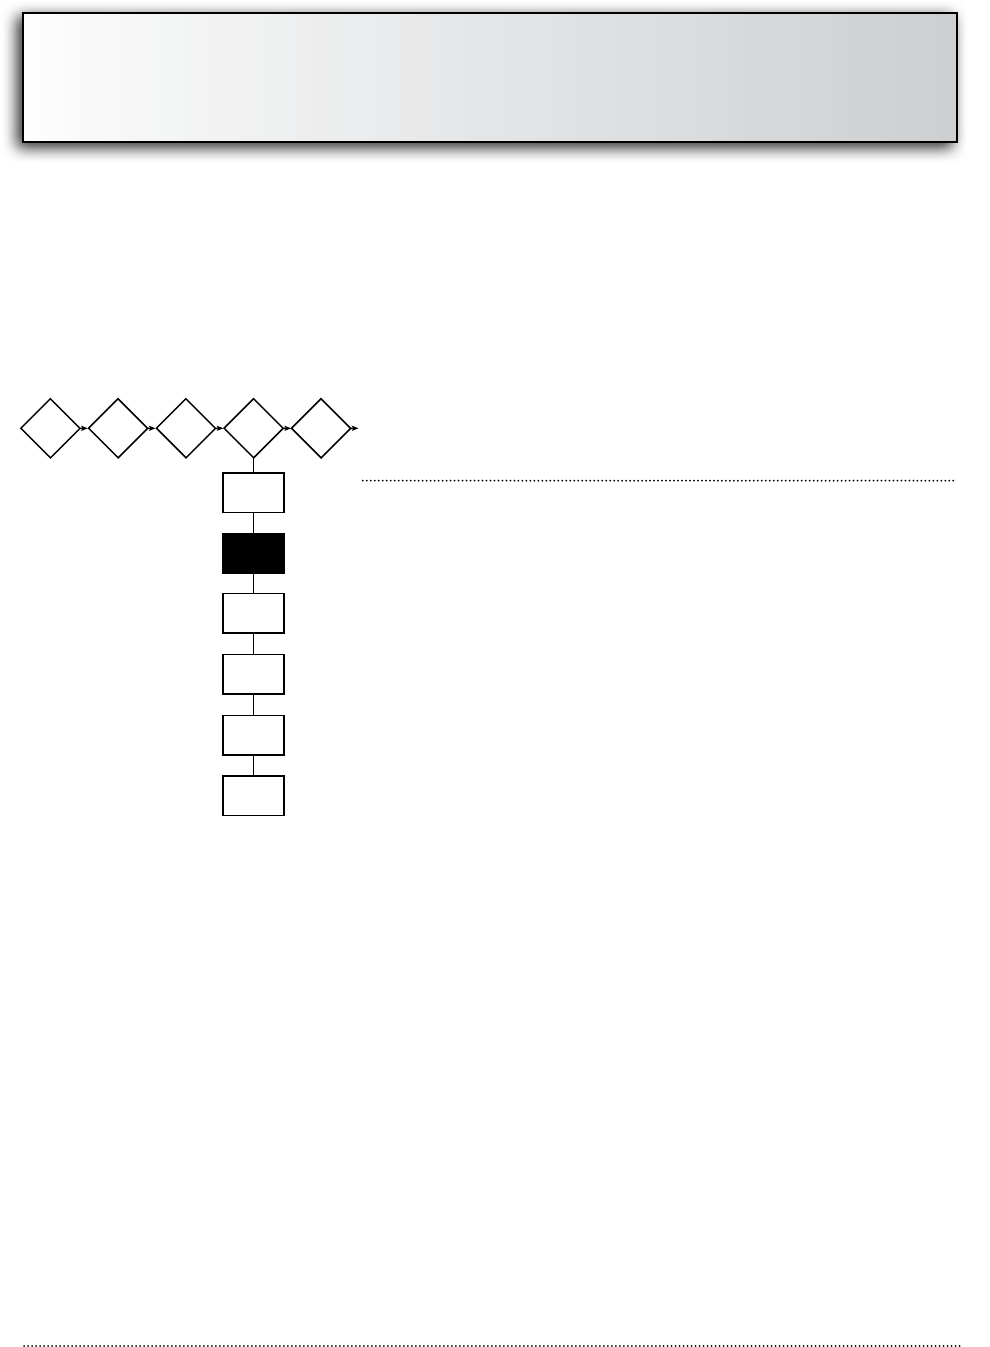
4-4
The success of the overall program may depend on the effectiveness of the pi-
lot implementation. A representative of the target audience should be involved
throughout the pilot test to provide feedback directly to the development team.
Modifying the program
The evaluation of the pilot program should provide information on what worked and what
didn’t work. Be careful not to make drastic changes without solid justification. Also, keep the
target audience representative closely involved in the modifications. Finally, ensure the modi-
fications do not take away from the strengths of the program.
Establish Responsibilities
and Timetable of Activities
Predelivery checklist
It is essential that the implementation be well coordinated and
appropriately sequenced. The predelivery checklist lists all the
tasks that must be completed prior to the program’s full deliv-
ery and implementation. Think of the predelivery checklist as
a checklist for success. The checklist identifies the following in
order of completion:
• Thepeopletonotifyabouttheimplementation.Thismay
include program team members, the target audience, the
media, or other groups with an interest in the program.
• Theequipmentandmaterialsrequiredfortheimplementa-
tion; this might include audiovisual equipment, brochures,
etc.
• Appointments and meetings that must be scheduled in-
cluding presentations to the target audience.
• Transportationandothersupportrequirements.
The checklist is a road map for the tasks that must be completed in order to implement the
program. However, the checklist isn’t foolproof. Expect additional needs to arise in the pro-
cess.
The Safe City predelivery checklist below provides an example of some of the tasks that must
be completed as part of the implementation of this intervention.
4-5
Safe City Example
Predelivery Checklist
Contact managers of the city-owned housing units to schedule a 1-hour
presentation to the residents.
Recruit personnel to deliver the presentations.
Send the handout materials and videotapes to the presenters.
Contact the media with a news release about the program.
Implementation problems
Seldom is there a community education initiative that doesn’t experience problems during
implementation. However, some common and expected problems can be identified and pre-
pared for with a contingency plan.
To address potential problems, bring the development team together with the representative(s)
of the target audience and brainstorm potential problems and appropriate solutions. It is
especially helpful to involve educators and community leaders who have been involved in
similar programs in the brainstorming process. Their experience is invaluable in identifying
potential problems.

4-6
Market Intervention
Programs
Marketing the results
Always inform the community, especially the target audi-
ence, of the results of the program. Many will have a keen
interest in the results of the program, including:
• membersofthecommunityplanningteam;
• electedofcials;
• programsponsors;
• fundproviders;
• organizationalleaders;
• membersofthetargetaudience;
• thegeneralpublic;and
• themembersoftheimplementationteam.
The purpose of marketing the results of the program is to inform people about the effective-
ness of the program in reducing fires, injuries, etc. Let the community know the program
works! Future programs may depend on how well you market the results of the current
program.
What kind of information should be communicated?
The information communicated to the community may include
• theeducationalgaininthetargetaudience;
• thedetailsofprogramactivities,includingthenumberofpresentationsconducted;
• anecdotesofthoseinvolvedintheprogram,includingmembersofthetargetaudience;
and
• reportondecreaseinthenumberofres,injuries,etc.
It is easy to disseminate information that doesn’t mean a thing to the public.
Always use terms that are easy to understand, and make statistics simple and easy to
grasp. Have someone who has not been involved look at the materials to see if they
make sense.
4-7
How to get information out
Some of the more common methods of disseminating information are provided below.
• Local media—Using local media is the best way to reach the general public. This includes
news stories, articles, and features. The local media can be reached through phone calls,
news releases, or news conferences.
• Newsletters—Newsletters generally have specific audiences. A story in a newsletter may
reach a target audience that otherwise would be difficult to reach.
• Direct mailing—If the program involves a specific geographic area, a direct mailing may
be effective. Address lists often are available through the county clerk’s office; the local
Chamber of Commerce; utility departments; etc.
• Meetings—To reach members of the coalition and development team, meetings are the
fastest and most effective way to disseminate the information.
Consider recruiting a marketing professional to assist with marketing. This person
will have experience with reaching specic groups with information.
Team recognition
Successful programs are the result of hard work by people who are committed to making
things better in their communities and who are willing to make a personal sacrifice to bring
that change to reality.
You should recognize anyone who has been involved in the development and implementa-
tion of the program. Of course, those who contribute the most should receive the highest
recognition. There are many ways to recognize the efforts of the team; some of those meth-
ods are listed below.
• certicatesofappreciation;
• giftcerticatestolocalbusinesses;
• itemsthatcanbeusedathomeorwork;
• lettersofappreciationbylocalofcials;and
• appreciationdinnersorotherevents.
Regardless of the recognition method selected, ensure that the recognition is sincere and
meaningful. Recognition of the team members says, “Thank you for a job well done.” It sends
the message that the sacrifice and hard work had meaning to you and to the community. It
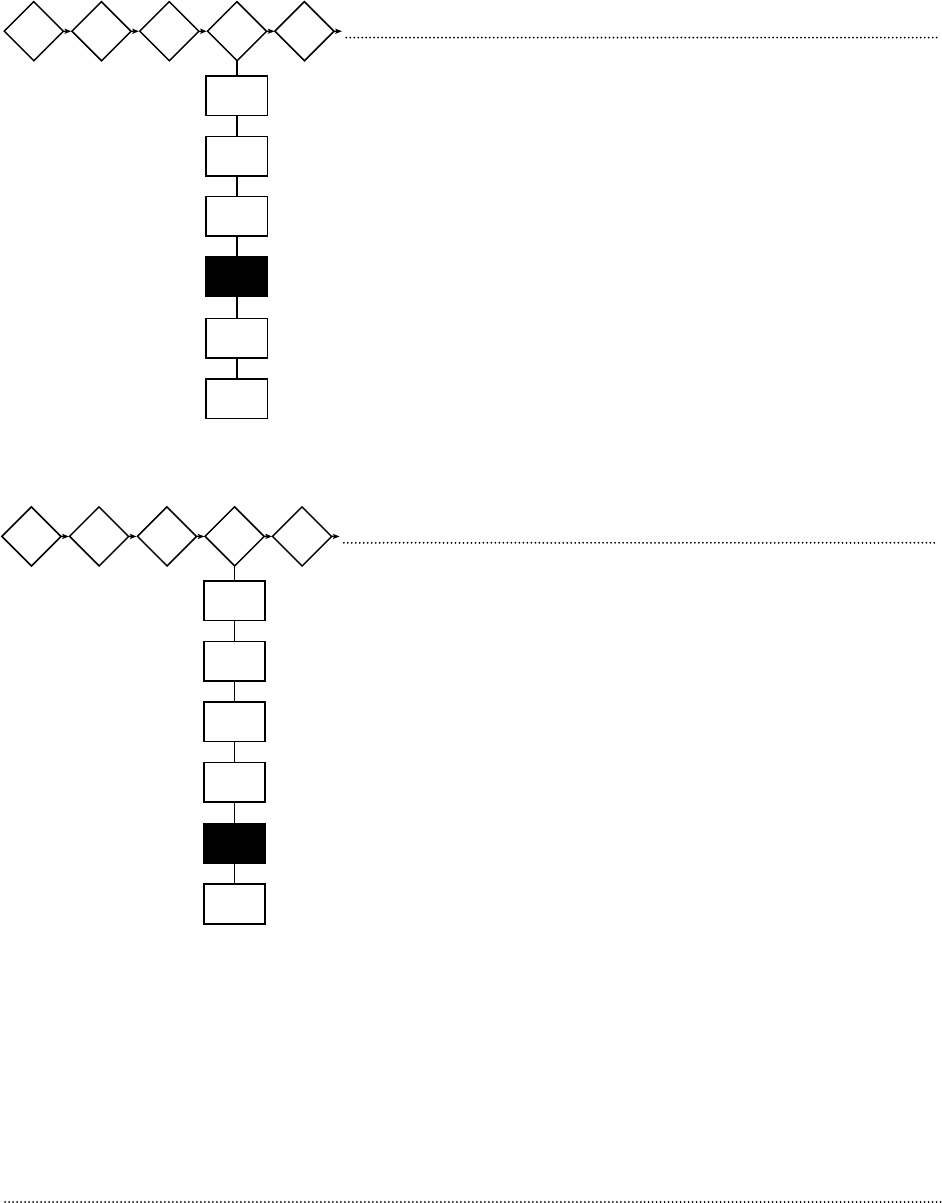
4-8
tells people that they are important and the mission of the program is important. Without
recognition people may feel taken advantage of. The importance of their efforts may be mini-
mized in their minds and in the mind of the community.
Initiate Activities
Once the final program is developed and in place, it must be
fully implemented. Everything developed by the planning
team should be put to use. Follow the intervention plan and
the implementation strategy. Often plans are put into place
and then not followed. This creates confusion and problems
within the planning team. Follow through with responsi-
bilities and schedules.
Monitor Progress
Remember to monitor the progress of the risk interven-
tion by following the evaluation plan. Everything needed
to monitor the program effectively should be developed.
Follow through is all that is needed.

4-9
Report Progress Periodically
When the program is underway it is essential to prepare
reports periodically that detail whether or not the goal and
objectives of the intervention plan are being met. These re-
ports provide an opportunity to report successes and ana-
lyze problem areas. It may be necessary to make revisions to
the plan based on the results of the progress reports.
Summary
Implementing the strategy involves pilot testing the interventions and then putting the plan
into action in the community. Modifications are sometimes made to the program. Marketing
the program is an important part of implementation that should not be overlooked. Monitor-
ing the progress of the program implementation and preparing regular progress reports also
are important.
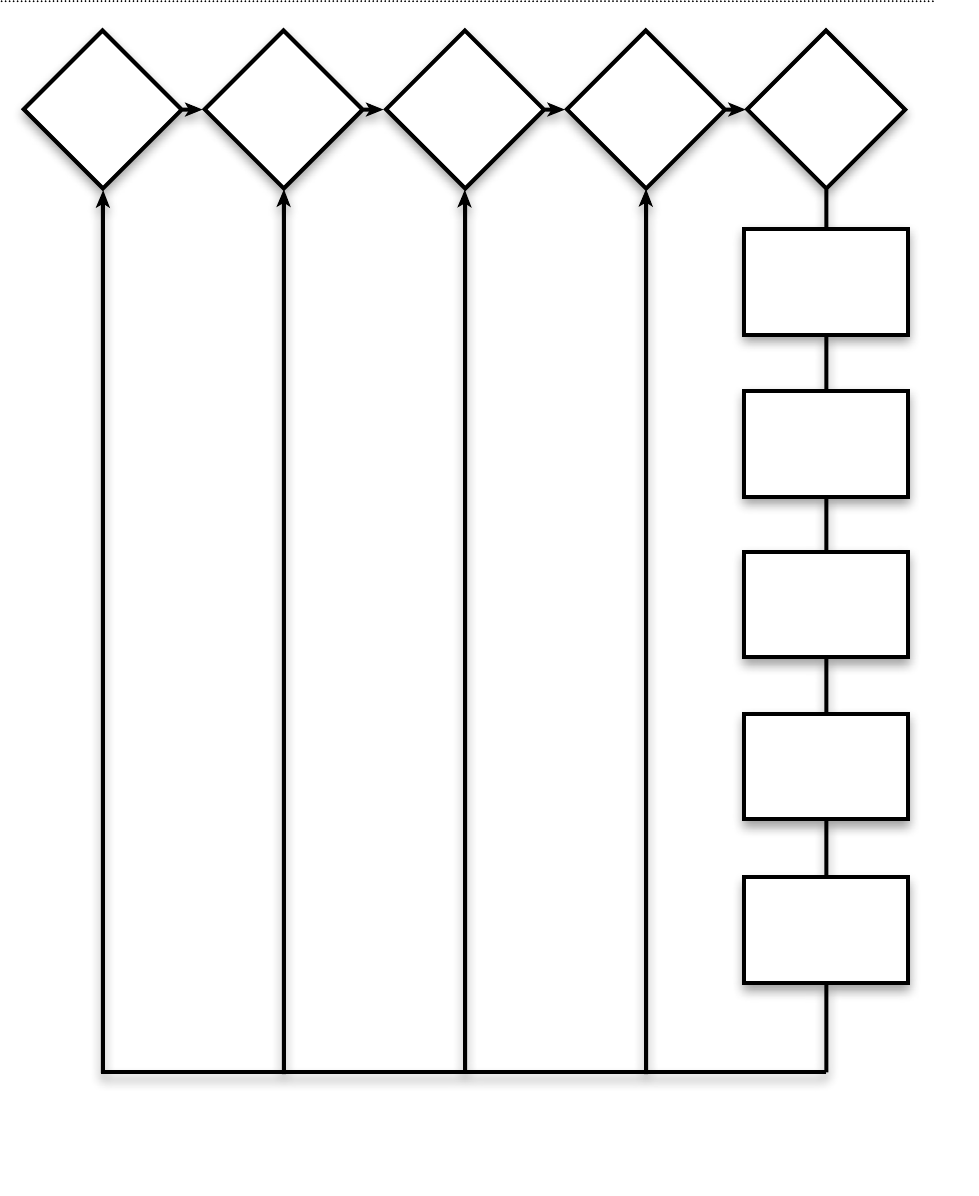
Conduct a
Community
Risk
Analysis
Develop
Community
Partnerships
Create an
Intervention
Strategy
Implement
the
Strategy
Evaluate
the
Results
Collect
Data
Compare Data
to
Baseline
Note
Interventions
as Necessary
Modify
Interventions as
Necessary
Report Results
to Sponsoring
Organization and
Community
Step 5: Evaluate the Results

5-1
Introduction
Why evaluate the risk reduction process?
The primary goal of the evaluation process is to demonstrate that risk reduction efforts are
reaching target populations, have the planned impact, and are demonstrably reducing loss.
With so much at stake, why guess if risk reduction efforts are being successful? Prove it!
Some organizations skip evaluations
While there are many reasons why an organization may not evaluate a risk reduction effort,
here are the three big ones:
1. Fear of working with statistics.
Many people believe that evaluation involves complex mathematical formulas. Not so. It’s
all about identifying existing conditions, determining future desired performance levels,
making comparisons, and reaching conclusions. The use of simple math (addition, sub-
traction, multiplication, and division) will get the job done.
2. Fear that a good evaluation may identify shortcomings in program efforts.
3. Lack of knowledge about evaluation.
Many organizations are simply not sure how to perform evaluation. This situation can be
handled rather easily by seeking help. Consider these sources:
• USFA;
• NFPA;
• otheremergencyserviceorganizationsthathaveexperiencewithevaluation;
• teachersandschoolofcials;
• publichealthofcials;
• counselorsandmentalhealthofcials;
• planninganddevelopmentofcials;
• CensusBureau;and
• communitycollegesanduniversities.
Chapter 5
Step 5: Evaluate the Results
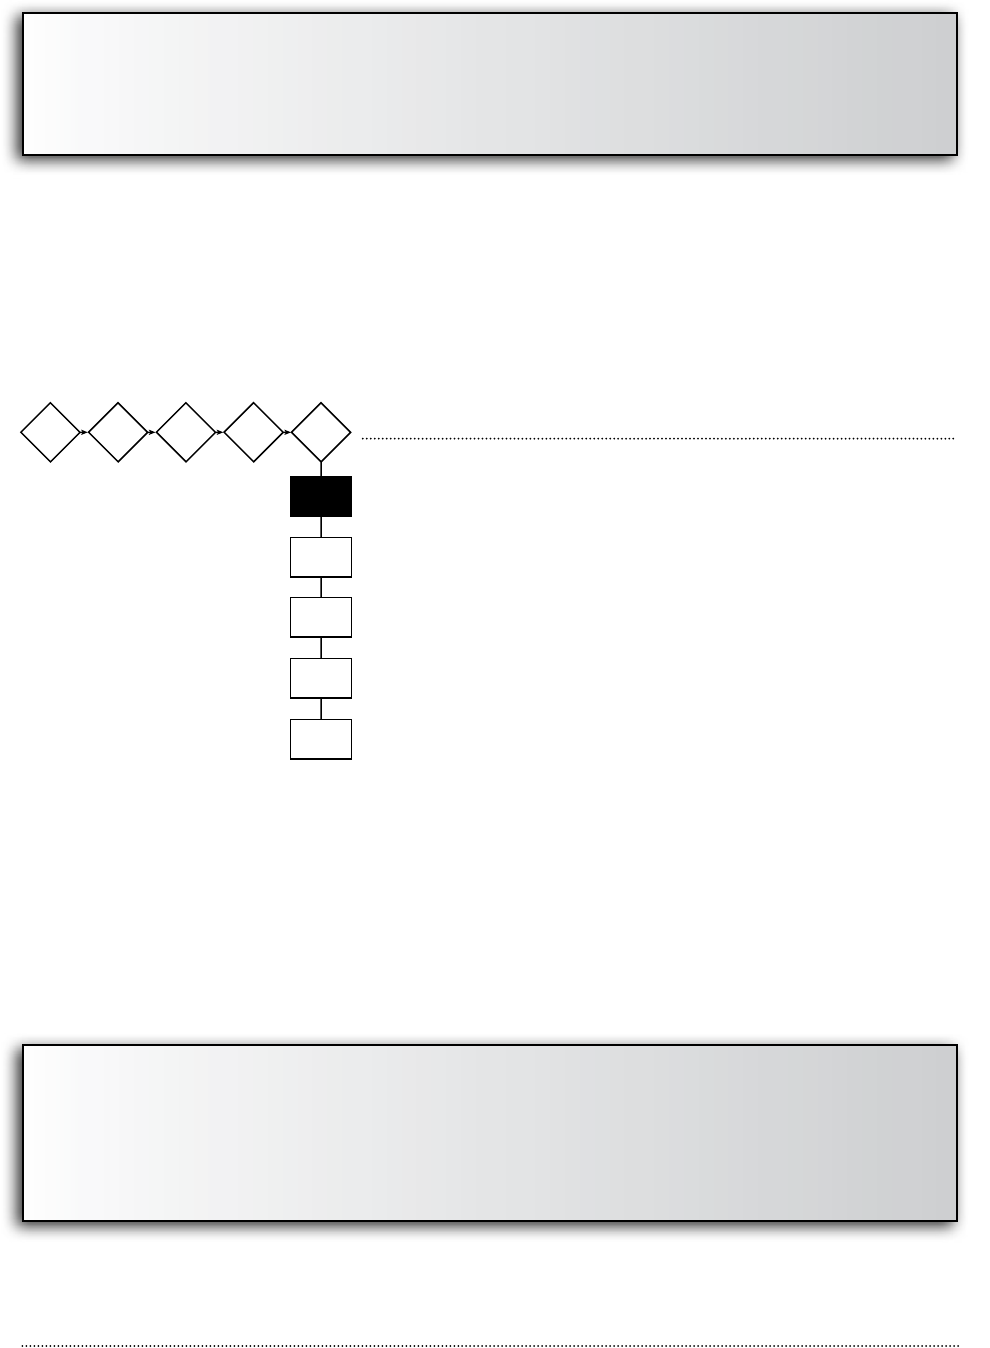
5-2
Don’t be intimidated by evaluation. Seek help from others who do it on a regular basis.
Failure to evaluate may result in a failed risk reduction process.
How can evaluation prove that the risk reduction process is on track?
A good evaluation process can prove that an intervention program is effective by validating
that the goal of the intervention is being met by citing objective data. Evaluation is all about
measuring performance.
Collect Data
When tracking risk experience, make sure those who do
the data entry follow a standard process. Strive to obtain a
broad base of data. Here are some examples:
• Rootfactorsleadingtoincident,(Howdoesatypical
incident happen?)
• Howoftentheincidentsoccur.
• Locationofthetypesofincidents(res,falls,etc.).
• Incidents(geographicdistribution).
• Whenincidentsoccur(time,day,month).
• Costoftheincidents(expense,injuries,lossoflife).
• Whatarethefastestgrowingincidents?
Put extra effort into objectively identifying the root factors that lead to the occur-
rence of an incident.
When building a database, limit the number of people who perform the actual
data entry. This helps reduce the chance of bias.
When using a survey instrument or a questionnaire, make sure it is designed to seek infor-
mation in an objective manner.
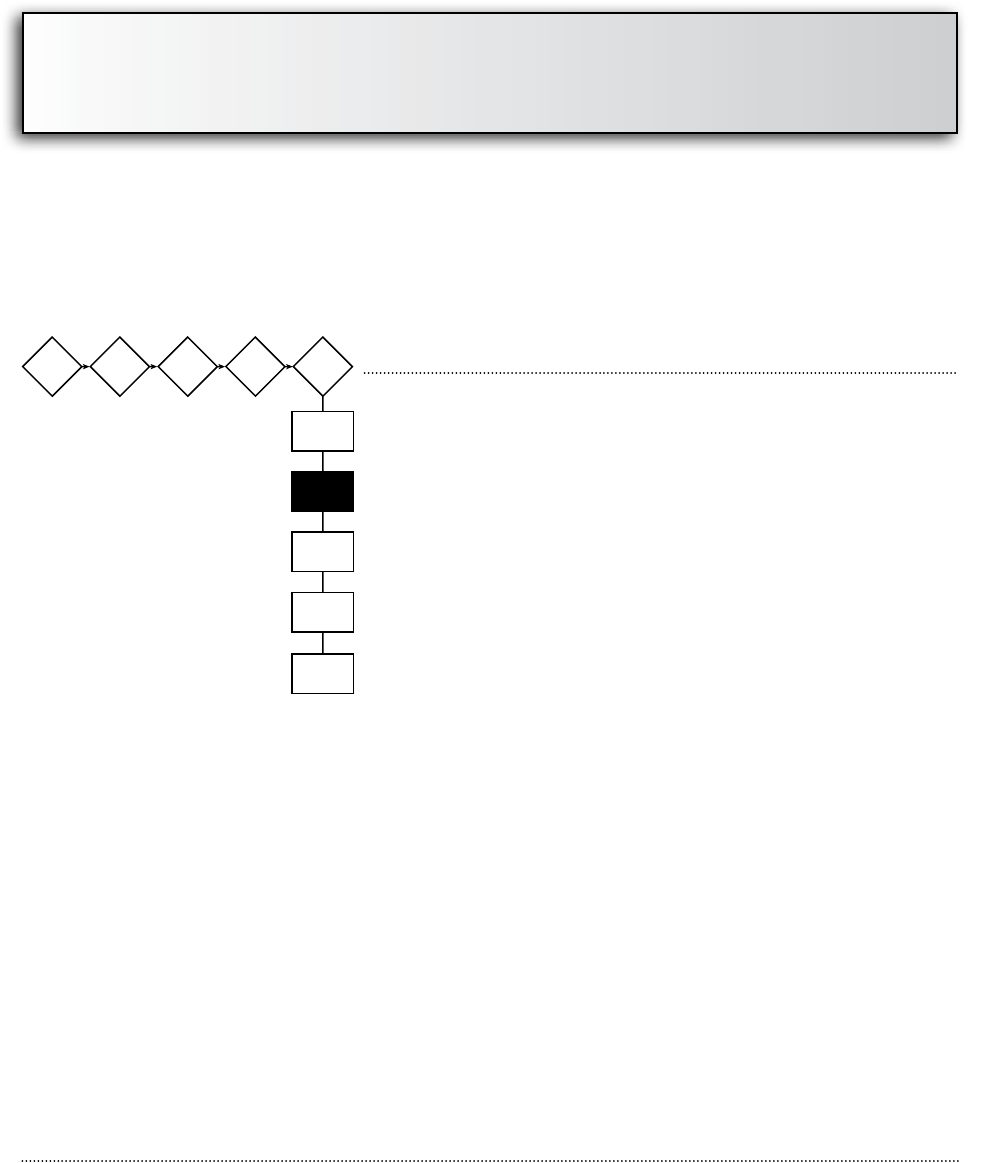
5-3
Asking a question that leads a person to a specic response is likely to produce a
biased answer.
Evaluation drives the risk reduction process. The most effective risk reduction efforts are
those led by people willing to modify program strategies based on the results of ongoing
evaluation.
Compare Data to Baseline
If evaluation is done well and begun early, it can help pro-
vide the framework that sets up a successful risk reduc-
tion effort. A starting point (baseline) is established and a
destination (benchmark) is identified.
Baseline data can include
• Anannualaverageofthedatayouwant.
• Measurementssuchasnumberofincidents,damage,
injuries, or deaths.
• The knowledge a population has about a specic
topic. Example—the current number of people who
know that unattended cooking is the leading cause of
fire.
• Existingbehaviorsthatoccur.Example—theaverage
number of people who cause a fire because they left
food unattended.
• Existingenvironmentalconditions.Example—theav-
erage number of homes lacking smoke alarm protec-
tion.
Example—You want to find out if people know the leading cause of fire in the community.
Ask—What do you believe is the leading cause of fire in the community?
Instead of—Do you think unattended cooking is the leading cause of fire in the commu-
nity?

5-4
The benchmark is the desired level of change. Let’s look at an example from Safe City that
identifies baseline and future data needed to make conclusions regarding the success of the
risk reduction effort. There is also an examination one of their objectives for each level of
performance—outcome, impact, and process.
Safe City Example
Cooking Fire Problem in Safe City, USA
Outcome Objective: By the end of year one there will be a 50 percent reduction in
the number of cooking fires that occur in homes of older adults residing in city-owned
housing units.
What’s the baseline? 20 cooking fires per year.
What is the benchmark? Cut annual cooking fire occurrence in the homes of older adults
living in housing to 10 per year.
How was the benchmark decided? The fire department is targeting the older adult hous-
ing unit because they believe it represents a realistic area where risk reduction will be
successful. The fire department wants to decrease cooking fires by 50 percent over a
2-year period (20/2=10).
How is progress being monitored? Review of annual response statistics.
Impact Objective: By the end of year one, 70 percent of older adults living in city-
owned housing will identify cooking as the leading fire cause and state appropriate pre-
vention/reaction strategies.
What’s the baseline? Baseline measurement is 10 percent.
How was the baseline determined? Before the impact objective was developed, the hous-
ing authority surveyed older adults and sought opinions on the leading cause of fire. One
hundred responses were obtained. Only 10 residents said cooking.
What is the benchmark? The benchmark is 70 percent.
How was the benchmark decided? During the initial survey, only 10 percent of the older
citizens knew the correct answer.
How can progress be monitored? During the next survey (to be done after the educa-

5-5
tional interventions) 70 out of 100 older adults must identify cooking as the leading
fire cause.
Process Objective: By the end of 6 months, the fire department (supported by mem-
bers of the planning team) will have made direct in-home contact with 50 percent of
older adults living in city-owned housing to discuss cooking fire awareness.
What’s the baseline? In this case, the baseline is zero because the fire department has
not performed any previous door-to-door visitation at the older adult housing unit.
What is the benchmark? The benchmark is 50 percent.
How was the benchmark obtained? The fire department will visit 100 homes within
the housing unit. They project that a successful contact (person at home) will take
place on 50 visits.
How can progress be monitored? A record of visitations.
Important facts to remember about evaluation
Evaluation must span the risk reduction process. It begins with analyzing and planning to ad-
dress risk. It continues through implementation. Modifications to program activity are made
according to evaluation results.
By creating and following a well-written evaluation plan, the specific progress of the risk
reduction effort can be monitored and adapted according to need.
Note Interventions as
Necessary
Evaluation offers tangible proof that populations are
responding to risk reduction efforts or interventions.
Both short and long-term progress can be monitored.
While program activity begins almost immediately, sta-
tistical, behavioral, and environmental changes usually
take time.
It is important that members of your organization,

5-6
planning team, and community be able to see steady progress being made toward reaching
the set goal.
Often, the myth that prevention cannot be measured has prevented organizations from at-
tempting to conduct quality evaluation efforts. Prevention efforts can be measured quite well
so long as the organization makes a commitment to do so in the three levels outlined in this
text.
Outcome and impact evaluation depend upon measuring before and after the intervention.
Compare the baseline data to data collected during and after risk reduction efforts have been
done. The data then are compared to the benchmark set in the evaluation plan.
Safe City Example
Safe City Performance Measurements
Knowledge: The percent of a population who know the leading cause of fire in the
community.
Behavior Change: The percent of a population that stay in the kitchen when cooking
food.
Environmental Change: The percent of homes that have a working smoke alarm.
Legislative Change: A law is enacted that requires smoke alarms in all homes.
Modify Interventions as
Necessary
Monitoring progress is important. That is why an evalu-
ation plan measures performance at several levels: out-
come, impact, and process objectives. Following through
with each level can provide tangible proof that the risk
reduction effort is moving toward the goal of reducing
the identified risk. However, in some cases interventions
will need to be modified in order to meet the risk reduc-
tion goal.

5-7
Evaluation takes time
Outcome evaluation is long term. While annual statistics are used to monitor changes in risk,
it may take 3 to 5 years (or longer) to realize major progress.
The results of impact evaluation may be seen a bit more quickly, but not overnight! While
changes in knowledge can be realized over a relatively short term, behavior and environmen-
tal change generally take more time.
Evaluation must be valid and objective. If it is valid, it measures exactly what you want it to
measure. If it is objective, it will not be affected by bias. Bias occurs when the attitude or ex-
pectation of the evaluator (or person being evaluated) influences the data being collected.
Report Results to
Sponsoring Organization
and Community
Share results of evaluation with the planning team, your
fire service organization, the target population, commu-
nity political leaders and decisionmakers, and the com-
munity at large. Once the initial conclusions from the
evaluation have been developed, provide the information
to the planning team. In fact, it is best to hold a team
meeting to review results.
If a revision of the program is desired, it is important that everyone involved in conducting
the program understands the reasons for changes.
Once the program is over, it is time to report the results of the program to the target audi-
ence, the organization, and the community. The conclusions from the evaluation process are
the basis for this report.
Summary
Some essential steps must be taken to create a successful evaluation. First, make a commit-
ment to do the evaluation well. Realize that the process will take time and effort to produce
tangible results. Then, seek help. Ask someone who performs evaluation on a regular basis to
help you get started.
Work hard to ensure all evaluation is done in a valid and objective manner. Keep an open
mind and be prepared to make adjustments according to the findings of your monitoring
and evaluation efforts.
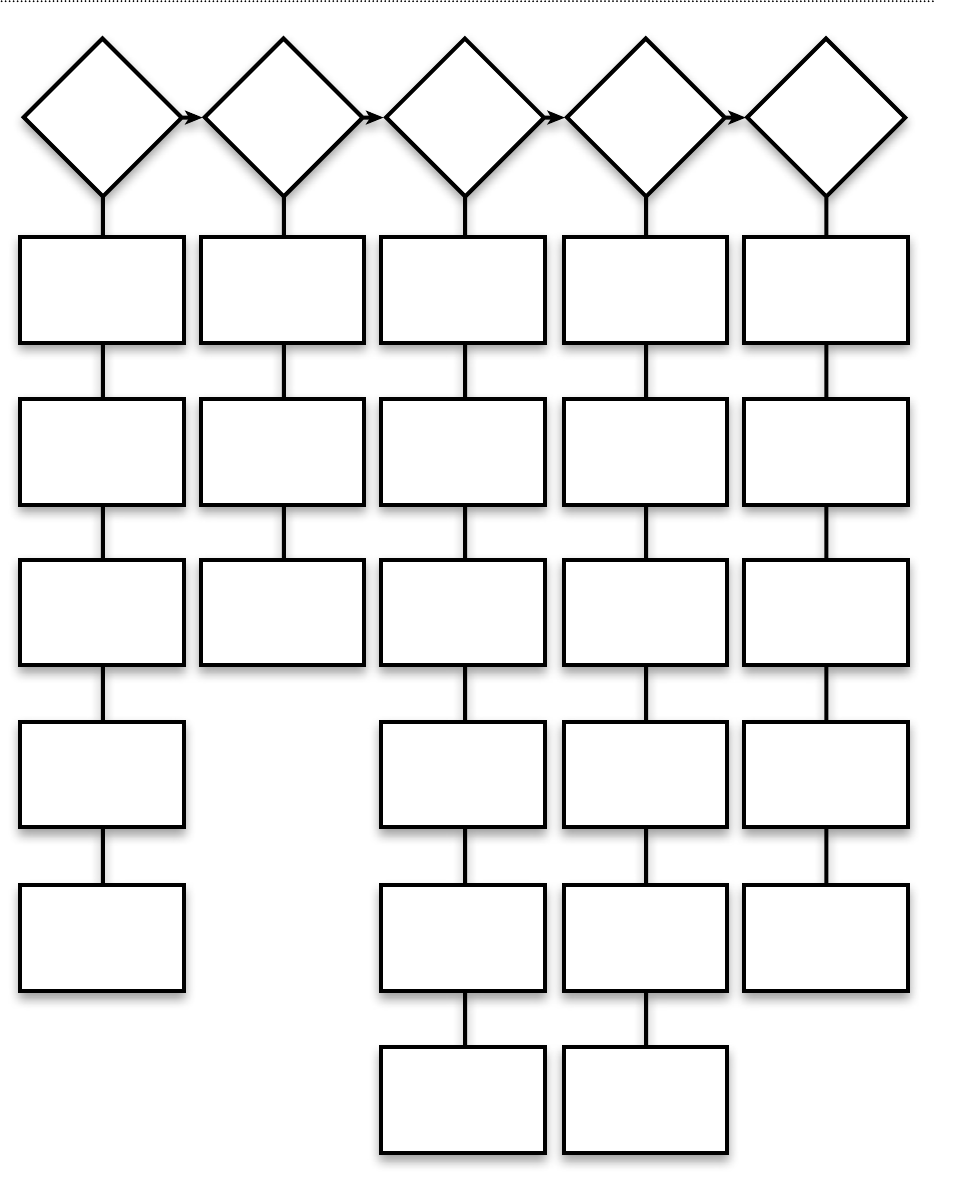
Conduct a
Community
Risk
Analysis
Develop
Community
Partnerships
Create an
Intervention
Strategy
Implement
the
Strategy
Evaluate
the
Results
Identify Data
to be
Analyzed
Identify
Possible
Partners
Review Data
about Risks and
Ta rget Populations
Conduct Pilot of
Intervention; Revise
as Necessary
Collect
Data
Develop a
Community Risk
Profile
Interpret
Community Risks
and Problems
Identify Places
for
Intervention
Establish
Responsibilities
and Timetable of
Activities
Compare Data
to
Baseline
Write a
Problem
Statement
Form a
Community
Planning Team
Identify Ta rget
Populations
and Locations
Market
Intervention
Programs
Note
Interventions
as Necessary
Prioritize
Issues
Identify
Interventions
Initiate
Activities
Modify
Interventions as
Necessary
Identify Ta rget
Areas and
Populations
Identify
Resources
Required
Monitor
Progress
Report Results
to Sponsoring
Organization and
Community
Develop the
Evaluation
Strategy
Report
Progress
Periodically
Conclusion

Conclusion - 1
Community educators commonly have the misconception that once a program is imple-
mented the work is over. Nothing could be further from the truth. The linear five-step plan-
ning process illustrated here represents the beginning and the end.
The education process never ends
The community education process is a never-ending cycle of analysis and revision. It is a se-
ries of five-step planning processes that overlap and continue through time.
Why is this a continual process? Communities and cultures change over time. The fire and
injury problems facing communities today are different from those of 30 or 20 or even 10
years ago, in some cases. This community change process always will continue. Our educa-
tional programs also must reflect these changes.
To keep up with—and be ahead of—changing community problems, the educator must
“close the loop” on the five-step planning process by connecting the evaluation step with the
analysis step.
The information gathered through evaluation—the good and the bad about the program
results—is the information that is used to begin another community analysis. This is a con-
tinual cycle that is designed to ensure that you and your community team are always aware
of the fire and injury problems in the community. From this information current programs
can be revised to meet the changes. In some cases new programs can be designed. In addi-
tion, the information can be used to help plan budgets and forecast future educational and
operational needs.
Restarting the planning cycle
How often should the planning process be repeated? That question can be answered only by
each individual community. Smaller communities that have fewer residents, neighborhoods,
and socioeconomic/sociocultural groups will see a slower change in fire and injury problems
and may require a community analysis only every 5 to 8 years. Larger communities composed
of numerous cultures and groups will change at a faster pace and may require a community
analysis every 2 or 3 years. In any event, it is up to the community team to determine how
often a planning process is needed and then to see that the process is implemented.
However, this doesn’t mean that a constant eye shouldn’t be on fire and injury statistics.
Regularly analyze available data on causes of fires, location of fires in the community, chang-
ing demographics and economic conditions, and types of injuries. Reviewing these data leads
community educators to be proactive instead of reactive to community problems. In other
words, watching for trends and patterns can help you identify problems early and put a pro-
gram in place prior to the problem escalating. This should be the objective.
Conclusion

Conclusion - 2
It all begins with you
Sound impossible to achieve? It may be at first. But after the first planning process is complete
it will be easier to believe. The results of the process can be amazing. Hundreds of communi-
ties all over the country have completed successful planning processes and have thereby re-
duced the number of fires and injuries in the community. Any community can be successful
in reducing fires and injuries through the use of the five-step planning process. It all begins
with you.

Bibliography
U.S. Fire Administration. America Burning: Recommissioned. Washington: Author, 2000.
National Commission on Fire Prevention and Control. America Burning. Washington: U.S. Fire
Administration, 1973.
National Safe Kids Campaign. Childhood Injury. Washington: Author, 2000.
_____. Motor Vehicle Occupant Injury. Washington: Author, 2000.
_____. Residential Fire Injury. Washington: Author, 2000.
_____. Rural Injury. Washington: Author, 2000.
National Center for Chronic Disease Prevention and Health Promotion. Youth Risk Behavior
Trends: 1991—1999. Atlanta: Centers for Disease Control and Prevention, 2000.
_____. Fire in the United States: 1987-1996. 11th ed. Washington: Author.
Kirtley, Ed. Risk Watch: A Leaders Guide to Preventing Childhood Injury in the Community. Quincy:
National Fire Protection Association, 1998.
International Fire Service Training Association. Fire and Life Safety Educator. 2nd ed. Stillwater:
Author.
Turnock, Bernard J. Public Health: What It Is and How It Works. Gaithersburg: Aspen Publishers,
1997.

A-1
Appendix
Sources of Additional Training and Information
Noted below are several sources that you may find helpful as you develop a comprehensive
community education program for your fire service organization. Federal Emergency Man-
agement Agency (FEMA) publications are available through the FEMA Web site at www.fema.
gov
Readings
1. Self-Study Course for Community Educators (National Fire Academy).
2. Short Guide to Evaluating Local Public Education Programs (U. S. Fire Administration).
3. Solutions 2000: Advocating Shared Responsibilities for Improved Fire Protection.
4. Fire Risk Series (U.S. Fire Administration).
5. Reaching High Risk Groups: The Community-Based Fire Safety Program (Rossomando & Associates).
6. Reaching the Hard to Reach (TriData).
7. Proving Public Fire Education Works (TriData and U. S. Fire Administration).
8. Community Tool Box: An Internet Resource (University of Kansas).
Training
The following National Fire Academy courses support the information provided in this
guide:
1. Community Education Leadership.
2. Discovering the Road to High Risk Audiences.
3. Presenting Effective Public Education Programs.
4. Developing Fire and Life Safety Strategies.
5. Strategic Analysis of Community Risk Reduction.
6. Leading Community Fire Prevention.
