
SAP Crystal Reports for Enterprise Users Guide
■ SAP Crystal Reports for Enterprise 4.0 Support Package 2
2011-05-06
© 2011 SAP AG. All rights reserved.SAP, R/3, SAP NetWeaver, Duet, PartnerEdge, ByDesign, SAP
Business ByDesign, and other SAP products and services mentioned herein as well as their respective
Copyright
logos are trademarks or registered trademarks of SAP AG in Germany and other countries. Business
Objects and the Business Objects logo, BusinessObjects, Crystal Reports, Crystal Decisions, Web
Intelligence, Xcelsius, and other Business Objects products and services mentioned herein as well
as their respective logos are trademarks or registered trademarks of Business Objects S.A. in the
United States and in other countries. Business Objects is an SAP company.All other product and
service names mentioned are the trademarks of their respective companies. Data contained in this
document serves informational purposes only. National product specifications may vary.These materials
are subject to change without notice. These materials are provided by SAP AG and its affiliated
companies ("SAP Group") for informational purposes only, without representation or warranty of any
kind, and SAP Group shall not be liable for errors or omissions with respect to the materials. The
only warranties for SAP Group products and services are those that are set forth in the express
warranty statements accompanying such products and services, if any. Nothing herein should be
construed as constituting an additional warranty.
2011-05-06

Contents
Introduction to SAP Crystal Reports for Enterprise..............................................................11Chapter 1
About Crystal Reports...........................................................................................................11
1.1
About the online help.............................................................................................................11
1.2
Understanding examples in the documentation.......................................................................12
1.3
Introduction to Reporting......................................................................................................13Chapter 2
About the report design environment.....................................................................................13
2.1
Report design canvas.............................................................................................................13
2.1.1
Side panels............................................................................................................................15
2.1.2
Format dialog box...................................................................................................................17
2.1.3
Show Problems......................................................................................................................17
2.1.4
Keyboard shortcuts................................................................................................................17
2.1.5
Logging on to SAP BusinessObjects Business Intelligence platform .....................................21
2.2
To log on to SAP BusinessObjects Business Intelligence platform for the first time...............21
2.2.1
To log on to SAP BusinessObjects Business Intelligence platform.........................................22
2.2.2
Creating a new report............................................................................................................22
2.3
To create a new report...........................................................................................................23
2.3.1
Selecting a data source..........................................................................................................23
2.3.2
Selecting folders and result objects........................................................................................24
2.3.3
Placing data on the report .....................................................................................................25
2.3.4
Formatting data .....................................................................................................................31
2.3.5
Grouping, sorting, and totaling data........................................................................................32
2.3.6
Adding a title page to the report ............................................................................................34
2.3.7
Adding comments to the report..............................................................................................35
2.3.8
Using the zoom feature..........................................................................................................35
2.3.9
Report Design Concepts.......................................................................................................37Chapter 3
Basic report design................................................................................................................37
3.1
Deciding on the content of the report.....................................................................................37
3.2
Stating the purpose................................................................................................................37
3.2.1
Determining the structure of the report .................................................................................38
3.2.2
Finding the data......................................................................................................................39
3.2.3
2011-05-063

Manipulating the data.............................................................................................................40
3.2.4
Determining printing area characteristics................................................................................41
3.2.5
Developing a prototype on paper...........................................................................................42
3.3
To design a paper prototype...................................................................................................42
3.3.1
Data Source Connections.....................................................................................................45Chapter 4
Connecting to a universe.......................................................................................................45
4.1
Connecting to an SAP BEx query...........................................................................................45
4.2
To connect to an SAP BEx query...........................................................................................46
4.2.1
Connecting to an Analysis View ............................................................................................46
4.3
To connect to an Analysis View..............................................................................................46
4.3.1
Designing a Query................................................................................................................47Chapter 5
Universe query design............................................................................................................47
5.1
Defining the data selection for a universe query.....................................................................47
5.1.1
Defining sorting......................................................................................................................55
5.1.2
Defining query filters and prompts..........................................................................................55
5.1.3
Query panel functions............................................................................................................62
5.1.4
Auto generate report with default layout.................................................................................66
5.1.5
SAP BEx query design...........................................................................................................67
5.2
Active hierarchies...................................................................................................................67
5.2.1
Defining the data selection for an SAP BEx query .................................................................68
5.2.2
Defining sorting......................................................................................................................73
5.2.3
Defining query filters and prompts..........................................................................................74
5.2.4
Query panel functions............................................................................................................79
5.2.5
Process to Verify Data Source on First Refresh....................................................................83Chapter 6
Report Layout and Formatting...............................................................................................85Chapter 7
Using the report design environment......................................................................................85
7.1
Understanding section characteristics....................................................................................85
7.1.1
Creating multiple-column reports............................................................................................85
7.1.2
Using smart guidelines...........................................................................................................86
7.1.3
Hiding report sections............................................................................................................88
7.1.4
Hiding report objects..............................................................................................................89
7.1.5
Creating a section underlay....................................................................................................90
7.1.6
Using pre-printed forms..........................................................................................................91
7.1.7
Preventing the truncation of text inside an element................................................................91
7.1.8
Hiding blank lines in embedded objects..................................................................................92
7.1.9
Placing multi-line, text-based elements...................................................................................92
7.1.10
2011-05-064
Contents

Indenting lines........................................................................................................................93
7.1.11
Allowing for overflow object representation............................................................................93
7.1.12
Selecting multiple elements....................................................................................................94
7.1.13
Understanding text rotation....................................................................................................94
7.1.14
Modifying line spacing............................................................................................................95
7.1.15
Setting page size and page orientation...................................................................................96
7.1.16
Setting page margins.............................................................................................................96
7.1.17
Setting custom page size.......................................................................................................97
7.1.18
Using TrueType fonts.............................................................................................................97
7.1.19
Using date formats on a Japanese system.............................................................................98
7.1.20
Formatting properties.............................................................................................................98
7.2
Working with absolute formatting ..........................................................................................98
7.2.1
Working with conditional formatting......................................................................................102
7.2.2
Using the Format Painter .....................................................................................................109
7.3
To copy and apply formatting...............................................................................................110
7.3.1
Multiple Section Reports......................................................................................................110
7.4
About sections.....................................................................................................................110
7.4.1
Working with sections..........................................................................................................111
7.4.2
Using multiple sections in reports ........................................................................................112
7.4.3
Form letters.........................................................................................................................113
7.4.4
Semantic Error Messages....................................................................................................117
7.5
{xxxx} may have multiple values in this group; only the first or last value will be displayed......117
7.5.1
{xxxx} may have multiple values in the report header; only the first value will be displayed.....117
7.5.2
{xxxx} may have multiple values in the report footer; only the last value will be displayed. .....118
7.5.3
Only the first value on the page will be shown......................................................................118
7.5.4
Only the last value on the page will be shown......................................................................119
7.5.5
The measure {xxxx} has no meaningful value in this location.................................................119
7.5.6
The measure {xxxx} may have multiple values in this location................................................119
7.5.7
The delegated measure {xxxx} may have multiple values in this group..................................119
7.5.8
The value for the delegated measure {xxxx} cannot be calculated in this group.....................120
7.5.9
The value for the delegated measure {xxxx} cannot be calculated in this crosstab................120
7.5.10
The delegated measure {xxxx} may have multiple values in this crosstab..............................120
7.5.11
Select the External Hierarchy option when grouping on a hierarchy......................................121
7.5.12
Hierarchy objects should be placed within a hierarchical group.............................................121
7.5.13
The level {xxxx} should be placed within a group based on its associated hierarchy..............121
7.5.14
The recommended operation for this Total is {xxxx}..............................................................122
7.5.15
Totalling on {xxxx} is not recommended................................................................................122
7.5.16
Sorting, Grouping, and Totaling..........................................................................................123Chapter 8
Sorting data.........................................................................................................................123
8.1
Understanding sort options .................................................................................................123
8.1.1
2011-05-065
Contents

How to sort your data..........................................................................................................125
8.1.2
Sort controls........................................................................................................................125
8.1.3
Grouping data......................................................................................................................127
8.2
To group data.......................................................................................................................128
8.2.1
Creating custom groups.......................................................................................................128
8.2.2
Sorting records within groups..............................................................................................129
8.2.3
Grouping data into intervals..................................................................................................130
8.2.4
Grouping by the first letter of a customer name...................................................................131
8.2.5
Grouping data hierarchically.................................................................................................132
8.2.6
Totaling grouped data...........................................................................................................135
8.3
To total grouped data...........................................................................................................136
8.3.1
Ordering groups by totaled values........................................................................................137
8.3.2
Selecting top or bottom N groups or percentages ...............................................................137
8.3.3
Calculating Percentages.......................................................................................................139
8.4
To calculate a percentage....................................................................................................139
8.4.1
Group headers.....................................................................................................................139
8.5
Creating group headers .......................................................................................................140
8.5.1
Suppressing group headers.................................................................................................141
8.5.2
Drilling-down on group headers............................................................................................141
8.5.3
Running Totals.....................................................................................................................142
8.6
Understanding running totals................................................................................................142
8.6.1
Creating running totals in a list ............................................................................................143
8.6.2
Creating running totals for a group.......................................................................................144
8.6.3
Creating conditional running totals.......................................................................................145
8.6.4
Creating running totals using a formula.................................................................................147
8.6.5
Charting..............................................................................................................................151Chapter 9
Charting concepts................................................................................................................151
9.1
Chart definition.....................................................................................................................151
9.1.1
Where to place a chart ........................................................................................................159
9.1.2
Drill-down on charts.............................................................................................................160
9.1.3
Creating charts....................................................................................................................160
9.2
To create a chart..................................................................................................................160
9.2.1
Charting on Cross-tab totals................................................................................................161
9.2.2
Working with charts.............................................................................................................162
9.3
Editing charts.......................................................................................................................162
9.3.1
Formatting charts.................................................................................................................163
9.3.2
Trendlines............................................................................................................................165
9.3.3
Dual Axis Charts..................................................................................................................166
9.3.4
Auto-arranging charts...........................................................................................................167
9.3.5
2011-05-066
Contents

Cross-tabs...........................................................................................................................169Chapter 10
About Cross-tabs.................................................................................................................169
10.1
Adding a Cross-tab..............................................................................................................170
10.2
To add a Cross-tab..............................................................................................................170
10.2.1
Working with Cross-tabs......................................................................................................171
10.3
To show values as percentages ..........................................................................................171
10.3.1
Printing Cross-tabs that span multiple pages .......................................................................171
10.3.2
Formatting Cross-tabs.........................................................................................................172
10.4
To change the width, height, and alignment of Cross-tab cells..............................................172
10.4.1
To format the background color of entire rows/columns......................................................172
10.4.2
To format elements individually ............................................................................................173
10.4.3
To format several elements at one time................................................................................173
10.4.4
Hiding Cross-tab data...........................................................................................................173
10.4.5
Displaying totals from left to right.........................................................................................174
10.4.6
Advanced Cross-tab features...............................................................................................174
10.5
Displaying hierarchies in Cross-tabs.....................................................................................174
10.5.1
Calculated Members............................................................................................................175
10.5.2
Embedded Totals.................................................................................................................179
10.5.3
Saving, Exporting, Printing, and Viewing Reports...............................................................181Chapter 11
Saving reports......................................................................................................................181
11.1
To save a report to your local computer...............................................................................181
11.1.1
To save a report with no data...............................................................................................181
11.1.2
Distributing reports..............................................................................................................182
11.2
Distributing reports through SAP BusinessObjects Business Intelligence platform...............182
11.2.1
Emailing reports...................................................................................................................183
11.2.2
Exporting a report.................................................................................................................184
11.2.3
Printing a report...................................................................................................................216
11.2.4
Viewing reports....................................................................................................................217
11.3
Opening reports...................................................................................................................217
11.3.1
Parameters and Prompts.....................................................................................................219Chapter 12
Parameter and prompt overview...........................................................................................219
12.1
Parameter considerations.....................................................................................................220
12.1.1
List of values types..............................................................................................................221
12.1.2
Optional parameters.............................................................................................................221
12.1.3
Prompt types.......................................................................................................................222
12.1.4
Creating a parameter...........................................................................................................222
12.2
To create a parameter..........................................................................................................222
12.2.1
2011-05-067
Contents

Working with interactive filters.............................................................................................223
12.3
To create an interactive filter................................................................................................223
12.3.1
To add additional interactive filters.......................................................................................224
12.3.2
To delete an interactive filter................................................................................................224
12.3.3
Working with lists of values..................................................................................................225
12.4
Creating a parameter with a static list of values....................................................................225
12.4.1
Creating a parameter with a dynamic list of values...............................................................226
12.4.2
Creating a cascading parameter group.................................................................................227
12.4.3
Using separate value and description objects.......................................................................228
12.4.4
To delete a parameter..........................................................................................................229
12.5
Advanced parameter features..............................................................................................229
12.6
To create a parameter that allows multiple values.................................................................229
12.6.1
To enable Select Values Only From List...............................................................................229
12.6.2
Creating a parameter that allows a discrete value or a range of values.................................230
12.6.3
To create a parameter with a hidden prompt........................................................................231
12.6.4
Creating a list of values filter................................................................................................232
12.6.5
To incorporate a parameter into a formula............................................................................233
12.6.6
Defining entry type and format using the Edit Mask..............................................................233
12.6.7
Null handling........................................................................................................................234
12.6.8
Formulas.............................................................................................................................235Chapter 13
Formulas overview...............................................................................................................235
13.1
Typical uses for formulas......................................................................................................235
13.1.1
Formula components............................................................................................................236
13.2
Specifying formulas..............................................................................................................237
13.3
Working with the Formula Workshop....................................................................................237
13.4
Accessing the Formula Workshop........................................................................................238
13.4.1
Navigation panel (Formula Workshop)..................................................................................238
13.4.2
Objects panel (Formula Workshop)......................................................................................238
13.4.3
Formula text window............................................................................................................239
13.4.4
Formula Workshop buttons..................................................................................................239
13.4.5
Creating and modifying formulas..........................................................................................241
13.5
Creating a formula................................................................................................................241
13.5.1
To edit formulas...................................................................................................................242
13.5.2
To search and replace text...................................................................................................242
13.5.3
Deleting formulas.................................................................................................................242
13.5.4
Debugging formulas tutorial..................................................................................................243
13.6
About this tutorial.................................................................................................................243
13.6.1
Error Messages and Formula Compiler Warnings.................................................................248
13.7
Creating Formulas with Crystal Syntax.................................................................................258
13.8
Crystal syntax overview.......................................................................................................258
13.8.1
2011-05-068
Contents

Crystal syntax fundamentals.................................................................................................258
13.8.2
Comments (Crystal syntax)..................................................................................................259
13.8.3
Objects (Crystal syntax).......................................................................................................260
13.8.4
Expressions (Crystal syntax)................................................................................................261
13.8.5
Assignment (Crystal syntax).................................................................................................263
13.8.6
Simple data types (Crystal syntax).......................................................................................264
13.8.7
Range data types (Crystal syntax)........................................................................................266
13.8.8
Array data types (Crystal syntax).........................................................................................268
13.8.9
Variables (Crystal syntax).....................................................................................................268
13.8.10
Functions (Crystal syntax)....................................................................................................275
13.8.11
Operators (Crystal syntax)...................................................................................................280
13.8.12
Control structures (Crystal syntax).......................................................................................282
13.8.13
Limitations (Crystal syntax)..................................................................................................292
13.8.14
Subreports...........................................................................................................................293Chapter 14
What are subreports?...........................................................................................................293
14.1
Unlinked vs. linked subreports.............................................................................................293
14.2
Unlinked...............................................................................................................................294
14.2.1
Linked..................................................................................................................................294
14.2.2
Inserting subreports.............................................................................................................295
14.3
To insert a new report as a subreport...................................................................................295
14.3.1
To insert an existing report as a subreport...........................................................................296
14.3.2
Saving a subreport as a main report.....................................................................................297
14.4
To save a subreport as a main report...................................................................................297
14.4.1
Re-importing subreports.......................................................................................................297
14.5
To re-import subreports.......................................................................................................298
14.5.1
Formatting subreports..........................................................................................................298
14.6
To format subreports...........................................................................................................298
14.6.1
Linking a subreport to the main report with subreport filters.................................................299
14.7
To link a subreport to the main report with subreport filters..................................................299
14.7.1
Linking a subreport to the main report with data passing links..............................................299
14.8
To link a subreport to a main report with data passing links..................................................300
14.8.1
Modifying the record selection formula with a data passing link............................................300
14.9
To modify the record selection formula with a data passing link............................................301
14.9.1
Combining unrelated reports by using subreports ...............................................................302
14.10
To combine two unrelated reports........................................................................................302
14.10.1
To combine three or more unrelated reports........................................................................302
14.10.2
Creating an on-demand subreport........................................................................................303
14.11
To create an on-demand subreport.......................................................................................303
14.11.1
Adding captions to on-demand subreports...........................................................................303
14.11.2
Showing different views of the same data in a report...........................................................304
14.12
2011-05-069
Contents

Multilingual Reporting.........................................................................................................307Chapter 15
Levels of multilingual reporting.............................................................................................307
15.1
Creating multilingual report templates..................................................................................308
15.2
To create a multilingual report template................................................................................308
15.2.1
Scheduling multilingual reports.............................................................................................309
15.3
To schedule a multilingual report..........................................................................................309
15.3.1
Viewing multilingual reports..................................................................................................310
15.4
To configure viewing preferences.........................................................................................310
15.4.1
Creating Accessible Reports...............................................................................................311Chapter 16
About accessibility ..............................................................................................................311
16.1
Benefits of accessible reports..............................................................................................311
16.1.1
Improving report accessibility...............................................................................................312
16.2
Placing elements in reports..................................................................................................313
16.2.1
Text......................................................................................................................................314
16.2.2
Color....................................................................................................................................317
16.2.3
Navigation............................................................................................................................319
16.2.4
Parameters..........................................................................................................................320
16.2.5
Designing for flexibility.........................................................................................................320
16.3
Accessibility and conditional formatting................................................................................321
16.3.1
Accessibility and suppressing sections.................................................................................322
16.3.2
Accessibility and subreports.................................................................................................322
16.3.3
Improving data table accessibility.........................................................................................323
16.4
Text elements and data table values.....................................................................................323
16.4.1
Other data table design considerations................................................................................326
16.4.2
Report Coexistence Between Versions of SAP Crystal Reports.........................................327Chapter 17
Versions of SAP Crystal Reports.........................................................................................327
17.1
Reports processed separately..............................................................................................327
17.2
Update existing reports........................................................................................................328
17.3
Audit reports........................................................................................................................329
17.4
More Information.................................................................................................................331Appendix A
Index 333
2011-05-0610
Contents

Introduction to SAP Crystal Reports for Enterprise
1.1 About Crystal Reports
Crystal Reports is designed to work with your database to help you analyze and interpret important
information. Crystal Reports makes it easy to create simple reports, and, it also has the comprehensive
tools you need to produce complex or specialized reports.
Create any report you can imagine
Crystal Reports is designed to produce the report you want from virtually any data source. Formulas,
cross-tabs, subreports, and conditional formatting help make sense of data and uncover important
relationships that might otherwise be hidden. Geographic maps and graphs communicate information
visually when words and numbers are simply not enough.
Extend reporting to the Web
The flexibility of Crystal Reports doesn't end with creating reports — your reports can be published in
a variety of formats including Microsoft Word and Excel, E-mail, and even over the Web. Advanced
Web reporting lets other members of your workgroup view and update shared reports inside their web
browser.
Incorporate reports into applications
Application and web developers can save time and meet their users needs by integrating the report
processing power of Crystal Reports into their database applications. Support for most popular
development languages makes it easy to add reporting to any application.
Whether it's the web master in IT, the promotion manager in marketing, the database administrator in
finance or the CEO, Crystal Reports is a powerful tool designed to help everyone analyze and interpret
the information that's important to them.
1.2 About the online help
The online help includes procedures for typical reporting tasks such as placing objects, formatting
reports, and sorting records. It also contains information on more specific areas of interest such as
2011-05-0611
Introduction to SAP Crystal Reports for Enterprise
advanced formula creation and accessing different types of data. Use the online help as a reference
for your basic reporting needs as well as an introduction to new concepts in report creation.
1.3 Understanding examples in the documentation
The Crystal Reports documentation describes how to connect to a variety of data sources and how to
add information to the report designer from those data sources. It also provides example code for the
functions. Although the terminology may refer to databases and fields, the instructions also apply to
data sources such as universes and queries that contain result objects.
For the sake of simplicity, sample folder and object names are used in the instructions and in the function
code examples. The following code sample shows how the folder and object names may be used:
Average ({orders.ORDER AMOUNT}, {customer.CUSTOMER ID})
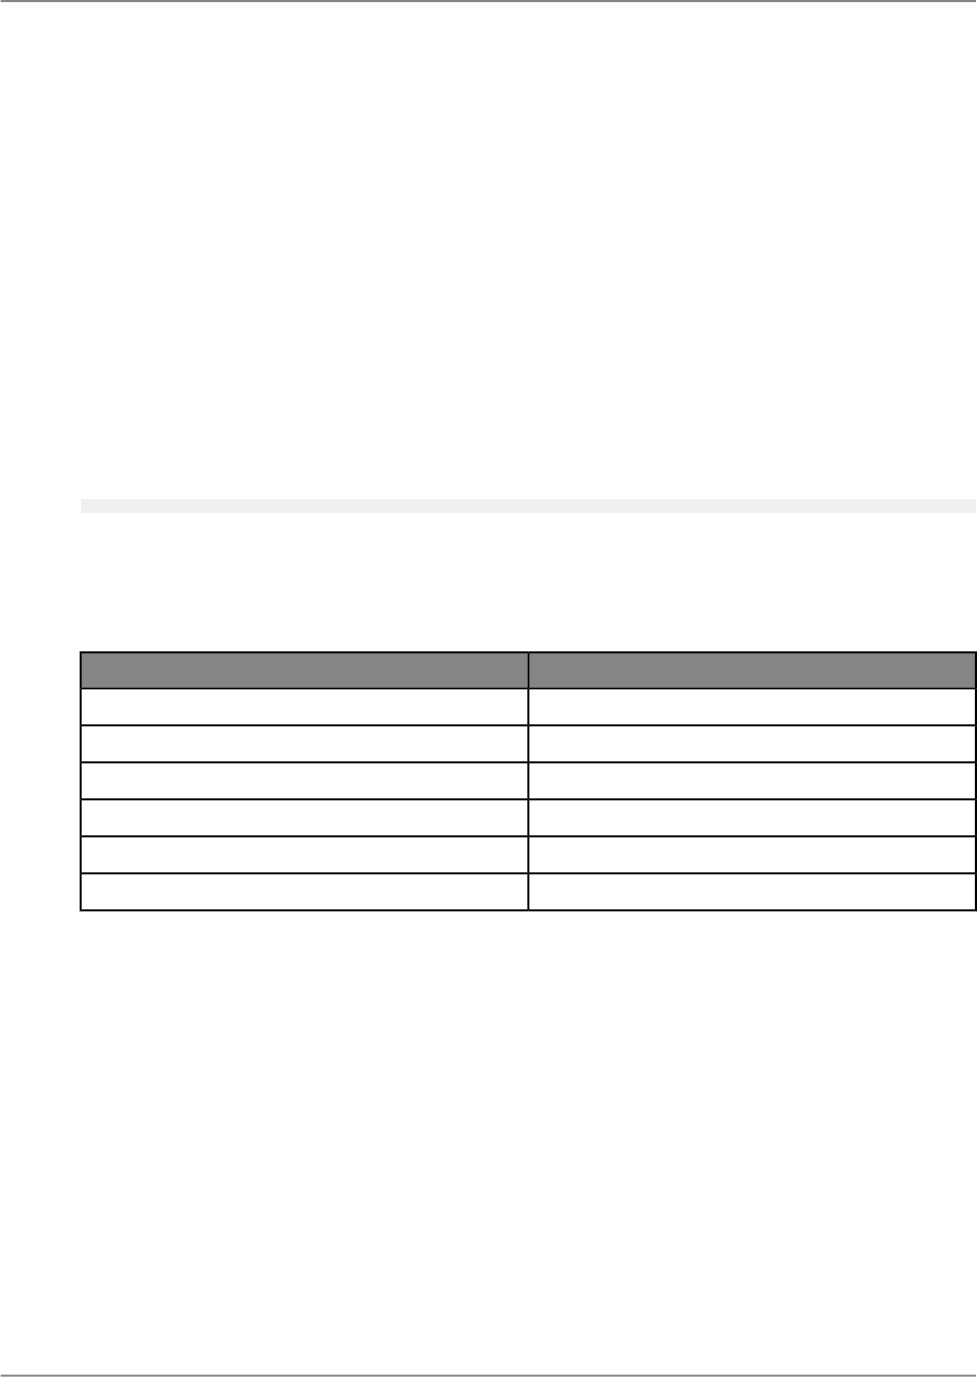
Many examples use objects from a Customer folder and numeric values from an Internet Sales folder.
There may be other objects in the documentation, but the following table shows the most commonly
used objects.
Customer
Data typeObject
stringCustomer
stringCity
stringState-Province
stringCountry
numericInternet Sales Amount
numericInternet Order Quantity
These objects will usually be displayed as follows:
• Customer
• Internet Sales Quantity
• Country
2011-05-0612
Introduction to SAP Crystal Reports for Enterprise

Introduction to Reporting
This section shows you the basics of creating a report in SAP Crystal Reports for Enterprise. First you
will learn about the report design environment, and then about how to select result folders, place
elements on a report, and how to sort, group, and total your report data.
2.1 About the report design environment
This section introduces you to some of the important areas of Crystal Reports that you will use most
when creating reports.
2.1.1 Report design canvas
The report design canvas is the area where you design the structure of your report. You can place
various elements on the canvas including data objects, charts, and text elements.
Two views are available for laying out the information and previewing it. One view shows the structure
only ("Structure" mode) and the other view is a page that includes data ("Page" mode).
2.1.1.1 Structure mode
"Structure" mode is where you do most of the initial work when creating a report. It is where you do the
initial formatting and place objects in the sections where you want them to appear.
"Structure" mode provides an efficient environment for designing a report because you work with data
representations, not with data itself. When an object is placed on the report, the program identifies the
object but does not retrieve the data. The object is represented by a frame.You can add and delete
objects and other elements, move them around, set up complex formulas, and more, without using the
computer or network resources needed to gather the data.
The report created in "Structure" mode contains only the structure and instructions for creating the final
report. To see how the report looks as a report with data, view it in "Page" mode.
2011-05-0613
Introduction to Reporting

2.1.1.1.1 Structure mode areas
When you create a new report, Crystal Reports automatically creates five essential report areas in
"Structure" mode:
• "Report Header"
This area is generally used for the report title and other information you want to appear at the
beginning of the report. It can also be used for charts and cross-tabs that include data for the entire
report.
• "Page Header"
This area is generally used for information that you want to appear at the top of each page, such as
chapter names, the name of the document, and other similar information. This area can also be
used to display object titles above the objects on a report.
• "Body"
This area is used for the body of the report, and is printed once per record. The bulk of the report
data generally appears in this section.
• "Report Footer"
This area is used for information you want to appear only once at the end of the report (such as
grand totals) and for charts and cross-tabs that include data for the entire report.
• "Page Footer"
This area usually contains the page number and any other information you want to appear on the
bottom of each page.
If a group is added to the report, the program creates two additional areas:
• "Group Header"
This area typically holds the group name object, and can be used to display charts or cross-tabs
that include data specific to the group. It is printed once at the beginning of a group.
• "Group Footer"
This area generally holds the summary value, if any, and can be used to display charts or cross-tabs.
It is printed once at the end of a group.
When a group is added, the "Group Header" area appears directly above the "Body" area and the
"Group Footer" area appears directly below the "Body" area.
If you set up additional groups, the program creates new group areas between the "Body" area and the
existing "Group Header" and "Group Footer" areas.
2011-05-0614
Introduction to Reporting
2.1.1.2 Page mode
"Page" mode shows the report structure and its data. In this mode you can see how your report will
look when it is printed or published.
"Page" mode allows you to edit the formatting of your report using the actual data. You can see the
direct results of your changes on the report, allowing you to fine-tune the formatting until the report
looks exactly as you want it to.
2.1.2 Side panels
Use the side panels to add connections, manage objects, insert folders, and so on.
The side panel area is located to the left of the report canvas. You can navigate between the side panels
by clicking the vertical row of icons on the side panel sidebar.
2.1.2.1 Data Explorer
Use the "Data Explorer" side panel to insert, modify, or delete objects in your report. When you
create a new report or open an existing report, the "Data Explorer" side panel opens adjacent to the
report canvas. Objects that you add in the Query Panel are stored in the "Data Explorer" where they
can be added to the report.
The "Data Explorer" side panel is separated into five areas. Expand the area by clicking the area name.
Result Objects
This area shows the universe elements that have been selected for use in the report. Drag elements
to the report canvas to add them to the report.
Click Edit Query to add a new universe element to the report.
Formulas
This area shows the formulas that have been created for the report. Drag formulas to the report canvas
to add them to the report. Right-click the side panel, and then click New Formula to add a new formula.
2011-05-0615
Introduction to Reporting
Parameters
This area shows the parameters that have been created for the report. Right-click the side panel and
click New to add a new parameter or a new cascading parameter group.
Running Totals
This area shows the running totals that have been created for the report. Right-click the side panel and
click New Running Total to add a new running total.
Predefined Objects
This area shows the predefined objects you can add to your report. Drag objects to the report canvas
to add them to the report.
2.1.2.2 Outline
The "Outline" panel shows the content of the report in a tree view. The root node is the report
itself, while the first-level nodes represent the sections of the report. Within each section, the report's
objects and elements are listed.
You can modify report objects and elements by right-clicking them in the "Outline" panel and clicking
Format <Object>. The Format dialog box shows the actions you can take on the object.
2.1.2.3 Group Tree
The "Group Tree" panel shows a tree view of groups and subgroups in the report. Any item you
select in the "Group Tree" is selected on the report canvas.
2.1.2.4 Search
2011-05-0616
Introduction to Reporting
Use the "Search" side panel to search the report for any specific value. Type a word or phrase
into the text box and press Enter. The search results appear in the side panel.
2.1.3 Format dialog box
The "Format" dialog box displays the formatting options for the selected element. The "Format" dialog
box appears when you right-click an element and click "Format"<Object>.
Use the "Format" dialog box to make formatting changes to the different areas of your report. For
example, when you right-click the "Report Header" section on the report canvas and click
"Format"<Section>, the "Format" dialog box displays the changes you can apply to that section.
2.1.4 Show Problems
The "Problems" panel displays a list of errors found in your report. It includes a description, the context,
and the category of the error.
When you click the Show Problems icon at the bottom of the report canvas, the "Problems" panel
appears.
2.1.5 Keyboard shortcuts
You can navigate the report structure using the keyboard instead of the mouse.
2.1.5.1 Structure, page, and side panel access
Side Panels
The following shortcut keys allow access to the side panels:
• Data Explorer: CTRL + 1.
• Outline: CTRL + 2.
• Group Tree: CTRL + 3.
2011-05-0617
Introduction to Reporting

• Search Panel: CTRL + 6.
Report Modes
The following shortcut keys allow access to the Structure and Page modes:
• Structure mode: CTRL + ALT + L.
• Page mode: CTRL + ALT + P.
2.1.5.2 Navigating the report canvas
Use the following options to navigate the main window.
• Press F6 to move the keyboard focus around to the main areas of the screen.
• Press Shift + F6 to cycle back in the reverse direction.
• Pressing F6 and Shift + F6 jumps between blocks: Side Panel, Report Editor Area, Tab Toolbar,
and Top Left Toolbar.
Top Left Toolbar
• Access the Top Left Toolbar by cycling through F6.
• To access the second row of buttons, use Tab.
• To switch between buttons, use the arrow keys.
• To select buttons, use Space.
Tab Toolbar
• Access the Tab Toolbar by cycling through F6. The initial focus is set on selected tab.
• To switch between tabs use the right and left arrow keys.
• To go to the buttons, use Tab.
• To switch between buttons use the right and left arrow keys.
• To select buttons, use Space.
Editing Keys
• To close a current document: CTRL + W.
• Copy: CTRL + C.
• Paste: CTRL + V.
• Cut: CTRL + X.
2011-05-0618
Introduction to Reporting

2.1.5.3 Navigating objects
Common navigation
Use the following keys to navigate objects:
• To move forward and back: Alt + Left and Alt + Right.
• To go to the Previous and Next page: Page Up and Page Down.
• To go to the First and Last page: Home and End.
• To go to Page selection box: CTRL + Shift + N.
• To refresh report: F5.
Activating hyperlinks in report content
With the report canvas focused, select a report element with a hyperlink so that the element is the
primary selection and press the Space bar.
Copying and Pasting elements
Items can be copied and pasted onto the canvas using the keyboard.
Copy a result object from the "Data Explorer" using Ctrl + C and set the keyboard focus back to the
report canvas using F6. Select a section or a result object on the report where you want to paste the
object. Once selected, paste the object by using Ctrl + V and using Enter.
2.1.5.3.1 To insert an element using keyboard commands
1.
Press Tab to move the focus to the "Insert" tab.
2.
Use the arrows to navigate to the required element.
3.
Press Ctrl + C to copy the element.
4.
Press Tab to return to the "Structure" mode.
Use the arrows to move to the section where you want to place the element.
5.
Press Ctrl + V to paste the element.
2.1.5.3.2 To insert an object from a list
1.
Press Tab to move the focus to the "Insert" tab.
2.
Use the arrows to navigate to an object list.
3.
Press Space to activate the drop list.
4.
Use Tab to navigate between controls.
5.
Press Enter to select the controls and buttons.
2011-05-0619
Introduction to Reporting

2.1.5.4 Navigating charts
You can use keyboard shortcuts to modify a chart:
• To select elements within a chart, use Alt + Down.
• To select other regions within the chart, use the arrow keys.
• To modify chart data, activate the context menu and choose "Edit Chart Data". Press the arrow keys
to select the drop zones. You may have to press Down, Up, Right, or Left to move to all the drop
zones. Once a drop zone is selected, press Alt + Down to select an element within the drop zone.
Note:
Though it is not currently possible to access the check boxes in the data mode page using only the
keyboard, there is an equivalent function inside the Format chart dialog box.
• Press Tab to move the focus to the data mode overlay.
• To switch back to the "Show" chart mode, with a chart element selected, activate the context menu
and select Show Chart.
2.1.5.5 Navigating the Groups and Sorts dialog box
The "Groups and Sorts" dialog box can be activated from the "Data" toolbar or directly from the context
menus of various elements on the report canvas such as group areas, sections, result objects, total
elements within groups, etc.
In the "Groups and Sorts" dialog box, use the standard keys (Tab, Enter, Space, Alt + Down, and the
arrow keys) to navigate through the dialog box.
To select a group or sort, press Space when the group or sort area is focused.
2.1.5.6 Navigating miscellaneous objects
Combo drop list
When a combo drop list is selected anywhere in Crystal Reports, use Alt + Down to cause the list to
drop.
Using Esc will cancel the dropdown or using Enter will select the current drop list selection and close
the drop list.
2011-05-0620
Introduction to Reporting

2.1.5.7 Navigating statement editors
The following options allow you to edit statement editors, interactive filters, and conditional formatting:
• To select the previous or next statement in a group, use the Up and Down arrow keys.
• To cycle through all keyboard-navigable parts in the editor, use Tab and Shift + Tab.
• To apply the relevant delete action for the selected part, use Delete.
• To go into edit mode for the selected part, use F2.
• To toggle a join part between "OR" and "AND" operators, use F2.
• To cancel an option in the editor dialog box, use Esc.
• To activate an option in the editor dialog box, use Enter.
2.2 Logging on to SAP BusinessObjects Business Intelligence platform
Before you can create a report with SAP Crystal Reports for Enterprise, you must be connected to an
SAP BusinessObjects Business Intelligence platform server.
Check with your system administrator for the proper server name to use for the connection.
2.2.1 To log on to SAP BusinessObjects Business Intelligence platform for the first
time
Get the correct Web Services server name from your SAP BusinessObjects Business Intelligence
platform administrator.
If you have not connected to SAP BusinessObjects Business Intelligence platform before, you will need
to add the server connection before you can log on.
1.
Click File > Log on to SAP BusinessObjects Business Intelligence platform.
The "Log on to SAP BusinessObjects Business Intelligence platform" dialog box appears.
2.
Type your User Name and Password.
3.
Click Options.
4.
Click Specify new server below and save.
5.
In Connection Name, type a descriptive name for the connection.
For example, type “Test server” or “Human Resources server”.
6.
Select the correct Authentication Type.
2011-05-0621
Introduction to Reporting

Note:
Your system administrator can tell you which authentication type to use.
7.
Type the server name.
Note:
You do not need to type the complete URL here, only the server name. If you need to change the
web port number or server context information, click Advanced to display the "Advanced Server
Settings" dialog box. Ask your system administrator for the values to use for the web port number
or server context information.
8.
Click OK.
You are now logged on to the SAP BusinessObjects Business Intelligence platform server. You can
create new reports or edit existing ones.
Note:
If you cannot connect to the SAP BuisnessObjects Business Intelligence platform server, refer to your
Web Services administrator to ensure the connection to the Web Services server is configured properly.
2.2.2 To log on to SAP BusinessObjects Business Intelligence platform
Follow these steps if you have already set up server connections to SAP BusinessObjects Business
Intelligence platform.
1.
Click File > Log on to SAP BusinessObjects Business Intelligence platform.
The "Log on to SAP BusinessObjects Business Intelligence platform" dialog box appears.
2.
From the "Server Connections" list, click the server name for the server that you want to connect
to.
3.
Type in your User Name and Password and then click OK.
You are now logged on to the SAP BusinessObjects Business Intelligence platform server. You can
create new reports or edit existing ones.
Note:
If you cannot connect to the SAP BuisnessObjects Business Intelligence platform server, refer to your
Web Services administrator to ensure the connection to the Web Services server is configured properly.
2.3 Creating a new report
This section provides you with information on the report creation process, including the following options:
• Logging on to the BI platform.
• Selecting the data source.
2011-05-0622
Introduction to Reporting

• Adding elements.
• Formatting data.
• Selecting records.
• Grouping, sorting, and totaling data.
2.3.1 To create a new report
If the Start Page is not already visible, click Help > Show Start Page.
The following section describes how to create a new report. You can insert text elements or predefined
objects on a blank report, or you can connect to a data source and select result objects to display data
on your report.
1.
Click File > New Report.
• If you are not already logged on to SAP BusinessObjects Business Intelligence platform, you will
be prompted to do so.
• If you are logged on to SAP BusinessObjects Business Intelligence platform, the "New Data
Source Connection" dialog box appears.
Note:
It is not necessary to log on to the BI platform or connect to a data source to create a blank report.
2.
Close the "New Data Source Connection" dialog box.
You have created a new report.
Related Topics
• Logging on to SAP BusinessObjects Business Intelligence platform
• Selecting a data source
• Selecting folders and result objects
• Placing data on the report
2.3.2 Selecting a data source
Crystal Reports supports connecting to the following data sources:
• Universe
• SAP BEx Query
• Analysis view
2011-05-0623
Introduction to Reporting

Note:
Before you can connect to a data source you must first be connected to an SAP BusinessObjects
Business Intelligence platform server.
Related Topics
• Logging on to SAP BusinessObjects Business Intelligence platform
2.3.2.1 To select a data source
Connect to the BI platform server.
1.
You can select a data source when creating a new report, or add a data source later.
• To add a data source to a new report, click Blank Report.
• To add a data source to an existing report, click Data > Choose Data Source.
The "New Data Source Connection" dialog box appears.
2.
Select a data source type and click Next.
The following are valid data source types:
• Universe
• SAP BEx Query
• Analysis View
3.
If you are not already logged on, log on to your BI platform server and click Next.
Note:
If you are already logged on, the login screen is not displayed.
4.
Select the data source that you want to connect to, and then click Next.
The "Edit Query" panel appears. You can now select elements to include in your query.
Note:
If you connect to an Analysis View, the query panel will not appear because Analysis Views contain
pre-designed queries. The report canvas will appear.
2.3.3 Selecting folders and result objects
After selecting a data source, you can select one or more folders or result objects within the folders to
include in your report.
2011-05-0624
Introduction to Reporting

2.3.3.1 To select folders and result objects
1.
You can select folders when creating a new connection to a data source, or when a connection is
already set up.
• When creating a new connection in a blank report, select the data source in the "New Data Source
Connection" dialog box and click Next.
• If a connection is already set up, click Edit Query in the "Result Objects" area of the "Data
Explorer" side panel.
The "Query Panel" dialog box appears.
2.
Select a folder or an object from the "Universe" pane and double-click it or drag it to the "Result
Objects for Query #1" pane.
3.
Repeat the previous step for each object that you want to include in the query.
Note:
It is recommended to avoid including both a hierarchy object and associated level objects in the
same report. A hierarchy object contains all the hierarchy nodes in a hierarchy form, whereas a level
object contains only the hierarchy nodes that match the level index in a flattened form. If both kinds
of objects are included in a report, the hierarchical data and flattened data will both be included in
the query.
4.
Click OK.
The folders and objects appear in the "Result Objects" area of the "Data Explorer" side panel.
Related Topics
• Quick reference to objects
2.3.4 Placing data on the report
Placing data on a report is a very important task. To produce reports that are clear and effective, you
need to know what type of data to place on the report and where on the report to place it.
Note:
A report (.rpt) file might contain sensitive business data. You are advised to protect access to the file
by using one of these methods:
• Manage the file with the BI platform server.
• Apply file security.
• Apply operating system-level encryption.
2011-05-0625
Introduction to Reporting

2.3.4.1 Result objects
Result objects are objects that display data from the data source. Much of the data displayed on a report
is from result objects. Normally, result objects will be placed in the "Body" area, but under certain
circumstances, they will be placed in other sections of the report.
Note:
If you are using a relational universe, OLAP universe, or SAP BEx query, delegated measures may be
available. If you place a delegated measure in the "Body" area, it will appear as a result object. However,
if you place a delegated measure in the "Report Header", "Report Footer", "Group Header", "Group
Footer", a Cross-tab, or a chart, it will be displayed as a total.
2.3.4.1.1 To insert result objects
1.
In the "Result Objects" area of the "Data Explorer" side panel, click the folders to expand the objects.
2.
Drag objects to the desired location on the report canvas.
Note:
You can also insert an object by right-clicking the object in the "Data Explorer" and clicking Insert.
2.3.4.2 Formulas
To display data that is a calculated value, you need to create a formula and place that formula on the
report. For example, if the data source stores only the order dates and ship dates for orders, but you
need to display the number of days it takes to ship the order, you must create a formula that will calculate
the number of days between ordering and shipping.
Related Topics
• Formulas
2.3.4.3 Parameters
Parameters allow you to filter report data for specific users. For example, in a report used by salespeople,
you might create a parameter that prompts the user to choose a region. When the user chooses a
region, the report returns the results for the specific region instead of returning the results for all regions.
2011-05-0626
Introduction to Reporting

Related Topics
• Parameters and Prompts
2.3.4.4 Running total elements
To display a total that evaluates each record and provides a running sum of all the values in an object
(or all the values in a certain set of values), a running total element needs to be created and placed in
the report. If the first three values in an object were 2, 4, and 6, a running total would print 2, and then
6 (the sum of 2 + 4), and then 12 (the sum of 2 + 4 + 6).
Related Topics
• Running Totals
2.3.4.5 Predefined objects
Predefined objects include "Page Number", "Record Number", "Group Number", "Print Date", and "Total
Page Count" objects. Use the commands in the "Predefined Objects" area of the "Data Explorer" side
panel to add predefined objects to your report.
2.3.4.5.1 To insert a predefined object
1.
In the "Data Explorer" side panel, expand Predefined Objects.
2.
Drag a predefined object to the desired location on the report canvas.
Each predefined object is inserted into the report as an element. An element frame appears. You can
now move it on the report.
Tip:
You can also right-click a predefined object, and then click Insert.
2.3.4.6 Text elements
Text elements are mostly used to hold text, but they can also hold result objects to create custom form
letters and more. You can use text elements to combine result objects, insert titles, label totals, and
other data on your report.
2011-05-0627
Introduction to Reporting

2.3.4.6.1 To insert a text element
1.
Click Insert > Text, and then click on the report canvas to place the text box.
An empty text box appears.
2.
Type your text into the text box.
A text element is added to the report.
Tip:
Click once on the border of the text element to select it for resizing and moving.
2.3.4.6.2 To insert a result object in a text element
1.
Insert a text element into the report.
2.
Type the text that you want to appear before the first result object, if any.
3.
In the "Data Explorer" side panel, click the result object you want to insert, and drag it towards the
text element.
As you move the cursor over the text element, you will see a movable insertion point.
4.
Drag the object so the insertion point is where you want the result object to appear, and place the
object.
Tip:
The result object can also be moved by selecting and moving it in the text element.
2.3.4.7 Picture elements
When designing reports, there will be times when you want to include a picture. For example, you may
want to insert a company logo in the "Report Header".
2.3.4.7.1 To insert a picture
1.
Click Insert > Picture.
The "Open" dialog box appears.
2.
Select the desired picture file from the file list and click Open.
An element frame appears with the picture inside, ready to be positioned.
3.
Position the picture element where you want it to appear on the report and click to place it.
2011-05-0628
Introduction to Reporting
2.3.4.8 Hyperlink elements
You can add a hyperlink to any report element on the report canvas.
The hyperlink is saved with your report and is available to other users as a way of viewing additional
information.
Note:
Crystal Reports also lets you create hyperlinks with Relative URLs, so your web reports retain
independence from their location on any particular server.
2.3.4.8.1 To create a hyperlink element
1.
Right-click the report element on the report canvas, and click Format <Element>.
The Format dialog box opens.
2.
Click the Advanced option.
Note:
Not all hyperlink types are available at all times. The element you select and its location on the report
determine which types are available.
3.
From the "Type" list, select one of the following:
DescriptionOption
This is the default option. There is no hyperlink associated with the selected
report element.
No Hyperlink
Select this option if you want your report element to be linked to a static
web address.
A Website on the In-
ternet
Select this option if you want to create a "mailto" address from the object
you selected. Use the Conditional Formula button to create an address
based on a object value.
An E-mail Address
Select this option if you want to create a hyperlink to a file on a specific
computer or networked computer.
A File
Select this option if you want to create a hyperlink to another element on
the report.
Another Report Ele-
ment
A text box will appear below the "Type" menu.
4.
Enter the website address, email address, or the file name of the hyperlink, depending on the type
you selected.
5.
Close the "Format" dialog box.
A hyperlink is inserted on the report.
2011-05-0629
Introduction to Reporting

2.3.4.9 Alerts
Alerts are custom messages created in Crystal Reports that appear when certain conditions are met
by the data in a report. Alerts indicate action to be taken by the user, or information about report data.
Alerts are created from formulas that evaluate conditions that you specify. If the condition is true, the
alert is run and its message is displayed. Messages can be text strings or formulas that combine text
and report objects. Once an alert is run, it's not evaluated again until you refresh your report's data.
Because alerts are specific to each report, you decide when to use them and when not to. They can
be useful to point out important information such as sales that are above or below a limit. The message
is created by you, so it can be specific to your data.
2.3.4.9.1 To add a new alert
1.
On the standard toolbar, click Data > Alerts.
The "Alerts" dialog box opens.
2.
Click New.
3.
Enter a name for your alert in the "Name" text box.
4.
Click the Condition Formula icon next to "Condition".
The "Formula Workshop" appears.
5.
Enter your alert condition formula.
If an alert formula is based on a total element, any recurring elements used must be constant over
the total element. For example, if you are grouping on Country and Region, you might create the
following alert:
Sum ({Customer.Last Year's Sales}, {Customer.Region}) > 10000
In this case, your formula can refer to either Country or Region, but not City or Customer Name
since these are not constant.
Note:
Alert formulas can be based on recurring records or on total elements, but cannot be based on
print-time elements, such as running totals or print time formulas. Alert formulas cannot have shared
variables.
6.
Click Save and Close to exit the "Formula Workshop".
7.
You can add a message to appear with your alert.
There are two options for adding an alert message.
• If you want the same message to appear every time your alert is run, type the message in the
"Message" box.
• If you want the message to appear customized with data elements, create a message formula.
a.
2011-05-0630
Introduction to Reporting

Click the Conditional Formula icon next to "Message".
The "Formula Workshop" appears.
b.
Enter your alert message formula.
For example, if you want to see the message "<Country> is a star performer" (where
<Country> is the name of a specific country), you might create the following formula:
({Customer.Country}) + "is a star performer".
c.
Click Save and Close to exit the "Formula Workshop".
Note:
The result of an alert message formula must be a string.
The DefaultAtribute function can be used to refer to a message added in the "Message"
box. For example, if the message in your message box is "is a star performer", your alert message
formula might be:
({Customer.Country}) + DefaultAttribute
This formula relies on the text you type in the "Message" box; that text becomes the default
attribute.
8.
Click OK.
A new alert is added to the report.
2.3.5 Formatting data
At this point in creating a report, you may want to do some basic formatting. Perhaps you would like to
change the font size and style of a text element used as a title. Or, if you have a number element, such
as a sales figure, you might want to place a dollar sign before the number or change the number of
decimal places displayed.
2.3.5.1 To format elements using the Format dialog box
The Format dialog box shows the options for editing report elements. You will use the Format dialog
box to make detailed formatting changes to almost all the elements in your report.
Tip:
You can also format elements through the "Format" tab in the tab bar, or by clicking Format on the
standard toolbar.
2011-05-0631
Introduction to Reporting

1.
Right-click the element you want to reformat, and click Format <Element>.
The Format dialog box appears.
2.
The Format dialog box displays a quick view of commonly used formatting options for the element.
Click Advanced to view more options.
3.
Click the options on the panel to view the different sections of the dialog box.
4.
Make the desired changes.
Related Topics
• Report Layout and Formatting
2.3.5.2 Inserting page headers and footers
You can use page headers and footers by placing the information in the "Page Header" or "Page Footer"
sections of the "Structure" mode.
• Information to appear only on the first page of the report goes in the "Report Header".
• Information to appear only on the last page of the report goes in the "Report Footer".
• Information to appear at the top of every page goes in the "Page Header".
• Information to appear at the bottom of every page goes in the "Page Footer".
Text, objects, or formulas can be used in these sections just as in the "Body" section.
2.3.6 Grouping, sorting, and totaling data
Once a basic report is created, you will want to organize the data by grouping related information,
sorting individual records, totaling, subtotaling, and grand totaling.
2.3.6.1 Grouping records
To organize the data, you may want to group related data together. For example, after grouping a
customer list by region, you might divide the list into regional groups. That way, a sales manager for
one region could quickly locate the appropriate region group and focus exclusively on the customers
within that region.
2011-05-0632
Introduction to Reporting

Related Topics
• Grouping data
2.3.6.2 Sorting records
Crystal Reports allows you to specify the order in which you want the records on your report displayed.
For example, after grouping by region, you might sort the records within each region in alphabetic order
by Customer Name. Many of your reports will use some type of sorting. Depending on the report, you
will sort the records in a list or sort in conjunction with grouping.
Note:
Crystal Reports will automatically sort the first column in a report alphabetically.
Related Topics
• Sorting records within groups
• Totaling grouped data
2.3.6.3 Totals, subtotals, and grand totals
Many reports use some sort of totaling. For example, in a North American sales report grouped by
state, you might want to calculate the total dollar amount sold in each state. You do this by creating a
subtotal on the sales object. Totals are also used at the group level, allowing you to calculate averages,
counts, and other group (aggregate) values. For example, in a sales report you may want to calculate
an average of sales per state (average total on the sales object) and calculate the number of products
sold in the state (distinct count of the product name object).
2.3.6.4 Using the isolate feature on grouped data
Crystal Reports allows you to isolate grouped or totaled information. While in the "Page" mode, right-click
on the group title or total element in the "Group Header" area that you want to isolate, and click Isolate
Information.
The report now shows only the group or total you isolated. To return to your main report, click the title
above the report canvas.
2011-05-0633
Introduction to Reporting

Tip:
You can also isolate information on the "Group Tree" side panel, right-click the desired group and click
Isolate Information.
Related Topics
• Sorting, Grouping, and Totaling
2.3.7 Adding a title page to the report
You can add a title page to a report by inserting "Report Title" from the "Predefined Objects" area of
the "Data Explorer" side panel.
In order to use this object, you must have a title entered in the Title text box for the report. You can add
a report title using the "Summary Info" dialog box.
2.3.7.1 To add a title page to the report
1.
Click File > Summary Info.
2.
In the "Summary Info" dialog box, enter a report title in the Title text box, if you have not done so
already.
3.
Close the "Summary Info" dialog box.
4.
In the "Predefined Objects" area of the "Data Explorer" side panel, drag the Report Title object to
the "Report Header" section of the report canvas.
5.
Click the "Report Title" element to select it.
6.
Format the font of the "Report Title" element from the "Format" tab.
7.
Set the "Report Title" values, such as font size, font type, and position.
8.
In the "Outline" side panel, right-click "Report Header" and click Format Report Header.
The Format dialog box shows the formatting options for the "Report Header" section.
9.
Select the Page Break After check box.
10.
Click Close.
The title appears on the first page and the report begins on the second page.
2011-05-0634
Introduction to Reporting

2.3.8 Adding comments to the report
There may be times when you want to include non-printing comments with a report (a personal note to
the report recipient, a note to explain more thoroughly the data on which the report is based, a report
title, a comment about some particular data on the report, and so on).
You can use the "Comments" text box in the "Summary Info" dialog box to add comments. The comments
do not print with the report; however, you can add comments to the report output if you want to.
2.3.8.1 To add comments to the report
1.
Click File > Summary Options.
2.
In the "Summary Info" dialog box, enter your comments in the "Comments" box.
Note:
The "Comments" box does not allow for paragraph breaks.
3.
Close the "Summary Info" dialog box.
Your comments are added to the report.
2.3.8.2 To add comments to the report output
1.
In the "Predefined Objects" area of the "Data Explorer" side panel, click "Report Comments" and
drag it onto the "Report Header" section of the report canvas.
2.
Right-click the "Report Comments" object on the report canvas and click Format object.
3.
In the Format dialog box, set the report comment values, such as font size, font type, and position.
4.
Close the Format dialog box.
The report comments now appear in the "Report Header" section of the report output.
2.3.9 Using the zoom feature
You can easily zoom in on a report. You can choose any magnification from 20% to 400%.
2011-05-0635
Introduction to Reporting

The zoom feature is located on the bottom right corner of the screen. Slide the bar to the left to zoom
out, and to the right to zoom in. You can also edit the zoom percentage manually by entering a
percentage into the text box. For example: 65%.
It is helpful to view reports at low magnifications in order to get an overall picture of the structure of your
report. Views at higher magnifications focus attention on the details of the report.
2011-05-0636
Introduction to Reporting

Report Design Concepts
This section describes the basic concepts of report design and helps you decide what information you
want to include in your report.
3.1 Basic report design
The purpose of this section is to suggest a structured approach to preparing a Crystal Reports report.
This approach includes the following:
• Deciding on the content of the report.
• Developing a prototype on paper.
This section has been designed to provide a conceptual understanding of the reporting process.
3.2 Deciding on the content of the report
Before you do anything else, you should outline the information you want the report to provide. The
following sections provide a guide to making that outline.
Note:
A report (.rpt) file might contain sensitive business data. You are advised to protect access to the file
by using one of these methods:
• Manage the file with the BI platform server.
• Apply file security.
• Apply operating system-level encryption.
3.2.1 Stating the purpose
2011-05-0637
Report Design Concepts

What is the overall purpose of the report?
Reports are management tools. Their purpose is to help you quickly grasp the essential elements and
relationships found in raw data, to help you make effective decisions. For a report to be effective, it has
to present the correct data in a logical way. If it presents the wrong data, or if it presents the right data
in a haphazard manner, the report may slow the decision-making process or may even encourage
incorrect decisions.
A good starting place in the development of a report is to write out the purpose of the report in a sentence
or two. The purpose statement helps you focus on your primary needs, and it gives the report both a
starting point and a goal.
Here are some examples of purpose statements:
• The purpose of this report is to show monthly and year-to-date sales by sales representatives,
compare this year's numbers to last year's, and flag representatives whose sales figures do not
meet company standards.
• The purpose of this report is to show sales activity for each item in inventory, and to suggest reorder
quantities based on that activity.
• The purpose of this report is to calculate bowling averages and handicaps for each member of the
bowling league.
Defining the purpose of the report before you start is a critical step in the overall process.
Who is going to read the report?
A single report is often used by many individuals. A detailed, company-wide sales report, for example,
may be used by sales representatives, the regional sales manager, the national sales manager, and
the Chief Operating Officer (COO).
These individuals will be interested in different aspects of the report:
• A sales representative will use the report to evaluate individual sales performance and compare this
performance to that of other representatives in the region.
• The regional sales manager will use the report to evaluate regional representatives and compare
the region's performance to that of other regions.
• The national sales manager will use the report to evaluate the performance of regional managers
and compare overall sales to the current sales forecasts.
• The COO will use the report to evaluate the performance of the Vice-President of Marketing and
the sales department as a whole, and to project such things as manufacturing needs and warehouse
locations.
Since each user of the report has different interests, it is important to plan the report so it includes the
information each user is looking for.
3.2.2 Determining the structure of the report
2011-05-0638
Report Design Concepts

What is the report title going to be?
Write out a working title for the report. You may decide to change it later, but at least you will have a
title to use when creating the prototype report.
What identifying information is needed in the header and footer?
You may wish to include the print date, information on who prepared the report, a block of text to describe
the purpose of the report, the range of data covered, or something similar. If you are going to include
such information, write it down so you can use it in preparing your prototype.
The information can come from a variety of sources, depending on the kind of information you plan to
use.
• Information on who prepared the report might be drawn from individual result objects in the result
folder(s) used. If it is to be drawn from a result folder, what folder? Or, what combination of folders?
• A block of text can be created as a text element and placed anywhere on the report.
• Crystal Reports can generate information such as the print date or page numbers.
3.2.3 Finding the data
What data do you want to use in the report?
Do you know the type of data source you are reporting from? If you do not know, ask the data source
administrator in your organization for help in setting up the data source type and location of the data.
Are you familiar enough with the data to find the necessary information? When looking for a Customer
Contact name, can the object be found in a result folder?
If not, your MIS professional, data source administrator, or co-workers will have to help you become
familiar with the data.
What specific data should appear in the body of the report?
The body should contain all the data needed to fulfill the statement of purpose you wrote for the report.
It should also contain all of the data needed by the various users that you have identified.
This step requires you to look at the available result folder(s). Crystal Reports allows you to combine
data from different data sources when you create reports, so you have a great deal of flexibility in your
work.
• Much of the data in a typical report is taken directly from result objects. Which result objects will be
used, and where are they located?
• Other data will be calculated based on result objects. Which result objects will be used in the
calculations?
• Still other data will be placed directly into the report using text elements (headings, notes, labels,
and so on).
2011-05-0639
Report Design Concepts

Does the data exist or does it need to be calculated?
Some report information can be drawn directly from result objects (sales information, for example);
other information will have to be calculated based on result object values (for example, sales commission,
based on the relationship of sales to quota). In your planning, it can be helpful to segregate or flag data
that needs to be calculated from that which can be used directly.
What types of objects contain data?
You should take the time to get to know the data type for result objects that will be used in your
calculations. Since formula functions and operators work with specific kinds of data, it is important to
recognize the data type you are working with, before you start any calculations. For example, some
functions require numeric data, while others work with only string objects.
3.2.4 Manipulating the data
Do you want the data organized into groups?
How? By customer? By date? By hierarchy? Or by other criteria? Crystal Reports provides several
options for grouping data in a report.
Do you want the data sorted based on record or group values?
Crystal Reports gives you both alternatives.
Do you want the report to contain only specific records or groups?
Crystal Reports gives you the opportunity to base a report on all of the records in a given data source,
or on a limited set of records from the data source. Crystal Reports can be used to filter records based
on simple date ranges or comparisons, or to create complex formulas to identify the records to be
included. Filtering data can be done in the Query Panel, or on your report with parameters and interactive
filters. Take a few minutes to determine the records needed for the report and list the criteria to be used
for filtering those records.
Do you want to total the data?
Do you want to total, average, count, or determine the maximum or minimum value included in all the
values in any column on the report?
Crystal Reports allows you to do this, and it also allows the grand total (or the grand total average,
grand total count, and so on) to be placed at the bottom of the selected column.
What information should be flagged on the report?
You may want to call attention to some data by flagging it on the report. For example, non-moving
inventory items are often flagged on inventory reports so they can be given special attention. You might
want to flag each item that has shown no activity during the last month, during the last three months,
or during some other defined period. To flag information, identify it and any conditions that will trigger
the flagging.
2011-05-0640
Report Design Concepts

How do you want information flagged?
You may want to flag items with an asterisk or some other symbol, or you may want a word to appear
as a flag. In any case, you should write out flagging instructions so they are handy.
Crystal Reports gives you the opportunity to underline report elements, and change the font type, size,
or color used for specific report elements. It allows you to put borders around elements and to draw
lines and boxes (to break the report into sections), set off headings, and so on. All of these formatting
tools can be used to highlight key data on a report.
3.2.5 Determining printing area characteristics
Each report area has its own printing characteristics. It is important to understand these characteristics
because they affect when and how often different report elements get printed.
In what order will the areas print on the report?
Areas print in the order they appear in "Structure" mode (top to bottom). If there is more than one section
in an area, the sections print in the order they appear. For example, if you have three "Report Header"
sections, all three of those sections will print, in order, before the section(s) in the "Page Header" area
begin to print.
How often do report elements print?
The way elements print will determine how you design your report. This will help you decide where to
place charts, Cross-Tabs, and formulas to get specific results.
Report Header
Elements placed in the "Report Header" area print once, at the beginning of the report.
• Charts and Cross-Tabs placed in this area contain data for the entire report.
Note:
Both charts and Cross-Tabs can filter report data by using a Group Sort; in such cases, the data
shown in the chart or Cross-Tab is a subset of the data for the entire report.
• Formulas placed in this area are evaluated once, at the beginning of the report.
Page Header
Elements placed in the "Page Header" area print at the beginning of each new page.
• Charts or Cross-Tabs cannot be placed in this section.
• Formulas placed in this area are evaluated once per page, at the beginning of each new page.
Group Header
Elements placed in the "Group Header" area print at the beginning of each new group.
• Charts and Cross-Tabs placed in this area contain data just for the group.
2011-05-0641
Report Design Concepts

• Formulas placed in this area are evaluated once for each group, at the beginning of the group.
Body
Elements placed in the "Body" area print with each new record.
• Charts or Cross-Tabs cannot be placed in this area.
• Formulas placed in this area are evaluated once for each record.
Group Footer
Elements placed in the "Group Footer" area print at the end of each group.
• Charts and Cross-Tabs placed in this area contain data just for the group.
• Formulas placed in this area are evaluated once for each group, at the end of the group.
Report Footer
Elements placed in the "Report Footer" area print once at the end of the report.
• Charts and Cross-Tabs placed in this area contain data for the entire report.
Note:
Both charts and Cross-Tabs can filter report data by using a Group Sort; in such cases, the data
shown in the chart or Cross-Tab is a subset of the data for the entire report.
• Formulas placed in this area are evaluated once, at the end of the report.
Page Footer
Elements placed in the "Page Footer" area print at the bottom of each page.
• Charts and Cross-Tabs cannot be placed in this area.
• Formulas placed in this area are evaluated once per page, at the end of each new page.
3.3 Developing a prototype on paper
While a paper prototype is useful regardless of your level of expertise with Crystal Reports, it is particularly
valuable when you are first learning the program. With the paper prototype in hand, you can put your
full effort into learning and using the commands, rather than into trying to design and learn at the same
time.
3.3.1 To design a paper prototype
1.
Use the same size paper you will be using for the finished report.
2011-05-0642
Report Design Concepts

2.
Position the title and other descriptive header information, using boxes or lines to represent report
elements.
3.
Position the footer information.
4.
Review the page structure for balance.
5.
Look at the information you intend to include in the body of the report:
• Count the number of objects being used and estimate the appropriate spacing between objects.
• Use rectangles to pencil in the objects within the estimated spacing.
• Change the spacing if you need to.
• Decide on a logical sequence for presenting the data in the body of the report.
• Label the objects to indicate that sequence.
6.
Use small boxes to indicate group values and totals.
7.
Place random flags in the column where you want flags to appear.
8.
Darken any elements you want highlighted to make them stand out from the rest of the prototype.
9.
Review the finished product for structure and balance, and make changes as needed.
2011-05-0643
Report Design Concepts

2011-05-0644
Report Design Concepts

Data Source Connections
4.1 Connecting to a universe
Universes include data from one or more relational data sources or OLAP cubes.
You can base new documents and queries only on universes for which you have been granted the
right.
4.1.1 To connect to a universe
Before you connect to a universe, log on to the BI platform server.
1.
Click File > New Report.
The "New Data Source Connection" dialog box appears.
2.
From the "Data Source Type" list, click Universe.
3.
On the "Name" panel, select a universe and select Next.
The "Query Panel" appears. You can now select objects from the universe to include in your query.
4.2 Connecting to an SAP BEx query
Each SAP BEx query contains a group of pre-designed result objects that you can run reports on.
Though the queries are pre-designed, you can use the "Query Panel" to sort and filter the query before
you run the report.
SAP BEx queries are hierarchy-based and can have multiple hierarchies. For example, a query on
expenses by region will create a different report than a query on expenses by employee. After you
insert the result objects in your query, if your SAP BEx query includes a variable hierarchy, you must
specify a hierarchy in order to run the report.
2011-05-0645
Data Source Connections

4.2.1 To connect to an SAP BEx query
Before you connect to an SAP BEx query, log on to the BI platform server.
1.
Click File > New Report.
The "New Data Source Connection" dialog box appears.
2.
From the "Data Source Type" list, click SAP BEx Query Data Access.
3.
On the "Name" panel, select an OLAP Connection and select Next.
The "Query Panel" appears. You can now select objects from the data source to include in your
query.
4.
Click Finish.
5.
(Optional) If the SAP BEx query you connected to is designed to include an SAP server-side variable,
a dialog box appears prompting you to enter the variable option for your query.
4.3 Connecting to an Analysis View
Each Analysis View contains a pre-designed query containing pre-designed result objects. Unlike
universes or BEx queries, queries in an Analysis View cannot be edited in Crystal Reports. You can
manipulate the data from an Analysis View by using the various Crystal Reports filtering and grouping
features. To change the query itself, you need to open the Analysis View in SAP BusinessObjects
Advanced Analysis.
4.3.1 To connect to an Analysis View
Before you connect to an Analysis View, log on to the BI platform server.
1.
Click File > New Report.
The "New Data Source Connection" dialog box appears.
2.
From the "Data Source Type" list, click Analysis View.
3.
On the "Name" panel, select a pre-defined analysis view and select Next.
The report canvas appears. You can now add result objects from the "Data Explorer" side panel to
your report.
2011-05-0646
Data Source Connections

Designing a Query
Universe and SAP BEx data source connections allow you to design the query to run reports on in
Crystal Reports.
5.1 Universe query design
Universe query designs include data from both relational and OLAP data sources.
To design a query using a universe, you need to first define the data selection using the Query Panel.
You then use the Member Selector to choose which members and hierarchies to include in the query.
Finally, you can refine your query further by adding sorts, filters and prompts to your query.
The following notes include CSL best practices when designing your universe query:
• It is recommended to avoid including both a hierarchy object and associated level objects in the
same report. A hierarchy object contains all the hierarchy nodes in a hierarchy form, whereas a level
object contains only the hierarchy nodes that match the level index in a flattened form. If both kinds
of objects are included in a report, the hierarchical data and flattened data will both be included in
the query.
• It is recommented to use delegated measure as much as possible (in group headers, charting,
cross-tab, etc) because delegated measures push down data from within the data souce. This will
improve performance and data correctness.
• It is recommended to define your filters and sorts in the Query Panel to achieve better performance.
Filtering and sorting defined in the Query Panel will push down data from within the data source.
Filtering and sorting defined in the Crystal Reports designer will be calculated locally.
• It is recommened for report designers to set the filter in the Query Panel before previewing the report
for optimized performance. When migrating a report from C++ stack to Java stack through a set
data source location, all filter information is kept in selection formula, which is calculated locally.
CSL will bring back all the data to be filtered on the designer side.
5.1.1 Defining the data selection for a universe query
2011-05-0647
Designing a Query
You build queries in the "Query Panel" by using objects in a universe. The objects in the universe are
a graphical representation of the information available in a data source.
The "Query Panel" is divided into several panes:
• The "Universe" pane shows a tree view of the objects that your universe contains. You cannot add
new objects or edit existing objects in the universe from the "Query Panel".
Note:
You can see all available objects in this pane by clicking Expand all. If you want to see how objects
relate to each other, click Collapse all. This option provides you with a visual representation of the
hierarchical structure of objects if such a structure is present in the universe.
• The "Result Objects" pane is where you place the objects that you want as part of your query.
• The "Query Filters" pane is where you place the objects that you want to use to filter the data that
is returned from your universe. You can add predefined filters from your Universe, or create custom
filters by adding objects and using the list boxes to define your filter.
5.1.1.1 Quick reference to objects
An object is a named component that maps to data or a derivation of data in the data source. For
example, an object may represent a column in a result folder, or it may be the summary of the values
in a column.
You use objects in a query to retrieve data for your reports. For example, some of the objects in a
human resources universe might be Names, Addresses, and Salaries.
Objects can represent different types of information.
Note:
• Object properties are defined in the SAP BusinessObjects Designer, but are not taken into account
by the "Query Panel" in Crystal Reports.
• Objects cannot be defined directly in the "Query Panel". Use the SAP BusinessObjects Designer to
define objects in a universe.
DescriptionExamplesObject
This object is a logical grouping
of columns from one or more
dimension tables that describes
a similar set of characteristics.
Analysis Dimension
2011-05-0648
Designing a Query
DescriptionExamplesObject
This object retrieves the data
that provides the time basis for
analysis in a report. Time Dimen-
sion objects typically retrieve
date-type data.
Time Dimension
This object provides descriptive
data about a dimension. A detail
is always attached to the dimen-
sion for which it provides addi-
tional information. For example,
Address, Birth Date and Com-
mute Distance are detail objects
that are associated with the
Customer dimension.
Attribute
This object retrieves numeric
data that is the result of calcula-
tions on data in the data source.
Measure objects are often locat-
ed in a Measures class.
Measure
This object provides a specific
default sorting order of the di-
mension data.
Default Hierarchy
This object provides a sorting
order of the dimension data
based upon a specific level.
Level based Hierarchy
This object provides a sorting
order of the dimension data
based upon a value.
Self-referenced and Value
based Hierarchy
This object is a group of mem-
bers that you select and save as
a personalized set of members.
They would not normally appear
together in a hierarchy, but cor-
respond to queries or parts of
queries that you frequently use.
Named Set
2011-05-0649
Designing a Query
DescriptionExamplesObject
An object that allows you to se-
lect a subset of objects based
on query criteria provided.
Filters
This object represents an axis
of analysis in a query. It can
map to one or more columns or
calculations that are used as a
key element for analysis in a
query. Dimensions based on a
data foundation or an OLAP
cube differ as follows:
• A dimension based on an
OLAP cube contains hierar-
chies organized by levels.
Each level can contain an
attribute.
• A dimension based on a data
foundation contains at-
tributes. Hierarchies are
constructed across related
tables as flat hierarchies.
Dimension
This object retrieves a subset of
the data from the parent hierar-
chy object where all of the re-
turned values come from the
same depth in the hierarchy.
Level
This object is a container that
holds a group of related objects.
This is equivalent to the Class
in Universe Designer.
Folder
5.1.1.2 Universe member selection
2011-05-0650
Designing a Query
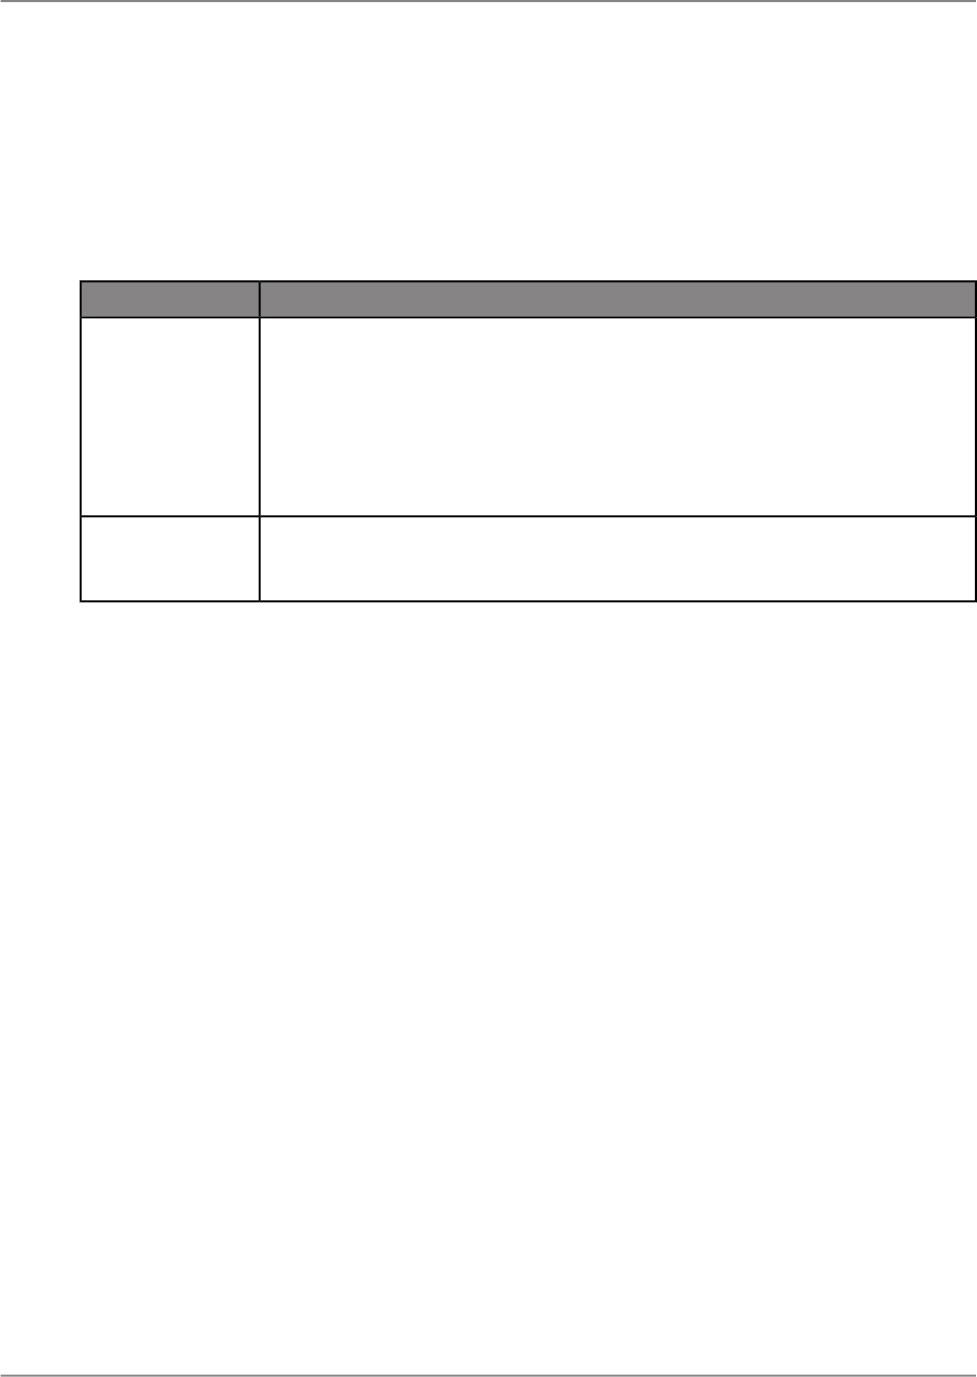
Use the "Member Selector" to select members of OLAP universe hierarchies to:
• Create named sets of members when creating a universe.
• Create queries based on hierarchies or members of hierarchies.
• Define members that will be excluded from queries.
The "Member Selector" consists of the following panes:
DescriptionPane
This is the top pane of the "Member Selector", there are three tabs:
• "Members" tab: Select or exclude members according to specific relationships
in the hierarchy.
• "Metadata" tab: Select or exclude by metadata criteria. This tab displays objects
by hierarchy levels, named sets, and calculated members.
• "Prompt" tab: Create prompts so that the user selects members or metadata
at run-time.
"Member Selector"
pane
This shows the selected members, prompts, and excluded members of the query
that you are building. The information you see in the "Summary" pane appears
in the "Result Objects" pane of the "Query Panel".
"Summary "pane
5.1.1.2.1 About hierarchies
A hierarchy is an ordered series of related objects (dimensions). An example of a hierarchy is Geography,
which may group dimensions such as Country, Region, and City. Users can observe data related to
the hierarchy from various viewpoints (All cities for a selected region, all cities for a selected country,
the country and region for a selected city, and so on).
To select a member by a hierarchal relationship
Use the member relations functions of the "Member Selector" to choose members by their relationship
or position within a hierarchy. The different relationships you can select are available when you select
a member in the "Member Selector" pane.
Note:
Children/Descendants and Parents/Ancestors are mutually exclusive pairs. You cannot choose both
the children and descendants of a member, and you cannot choose the parents and ascendants of a
member.
1.
In the "Members" tab of the "Member Selector", click in the selection box on the left of the member
name.
2.
In the "Member Selector", click the name of the selected member.
The list of available options appears.
3.
Choose the appropriate relation function from those described below:
2011-05-0651
Designing a Query
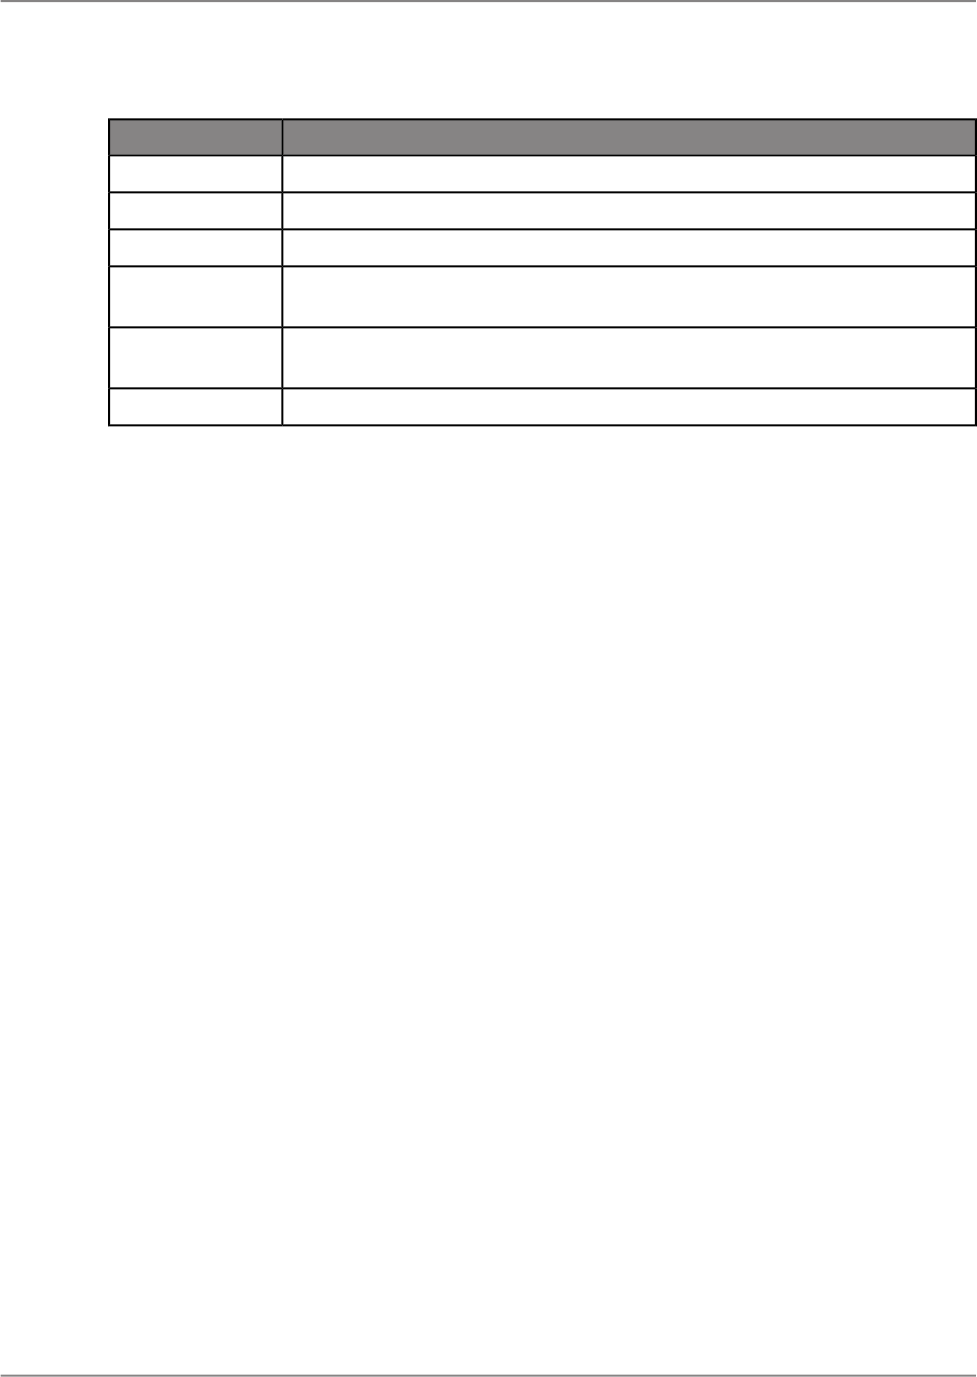
DescriptionOption
Use only the selected member. This is the default setting.
Self
Selects members of the same level in a branch of a hierarchy.
Children
Selects the members below the active member in a hierarchy.
Descendants
Selects all the members of the same level in different branches of the hierarchy
set.
Siblings
To select the members above a specific member in a hierarchy, click the
member below the members you want to select, and select this function.
Ancestors
Selects the member directly above a member.
Parent
The selection is displayed in the "Summary" pane, preceded by fx.
To select members by level
You can select all of the members of the same level in different branches of a hierarchy. For example,
select all of the quarters in a time dimension, or cities in a geography dimension.
1.
Drag a hierarchy into the "Result Objects" pane.
2.
Launch the "Member Selector."
The "Member Selector" displays the hierarchy members in a tree view.
3.
In the "Member Selector," click the Metadata tab.
The "Member Selector" displays the available Levels, Calculated Members, and Named Sets.
4.
Select a level.
5.
Click OK.
When you run the query, the members from the selected level are computed dynamically when the
report is created.
5.1.1.2.2 About named sets
A named set is a group of members that you select and save as a personalized set of members. They
would not normally appear together in a hierarchy, but correspond to queries or parts of queries that
you frequently use. The named set is available in the "Query Panel" for creating queries for the end-user.
To select named sets
The hierarchy object you have placed in the "Result Objects" pane of the "Query Panel" contains one
or more named sets.
1.
Drag a hierarchy into the "Result Objects" pane.
2.
Launch the "Member Selector."
3.
In the "Member Selector", click the Metadata tab.
2011-05-0652
Designing a Query

The "Member Selector" displays the available levels, calculated members, and named sets.
4.
Select a named set.
5.
Click OK.
5.1.1.2.3 About calculated members
A calculated member is a complex calculation that you create in the data source. The calculated member
is available on the "Metadata" tab of the "Member Selector".
To select a calculated member
Before you begin, drag and drop a hierarchy or hierarchy member of an OLAP universe into the "Result
Objects" pane of the "Query Panel". The hierarchy you have selected contains one or more Calculated
members.
1.
Drag a hierarchy into the "Result Objects" pane.
2.
Launch the "Member Selector."
3.
In the "Member Selector", click the Metadata tab.
The "Member Selector" displays the available Levels, Calculated Members, and Named Sets.
4.
Select a member.
5.
Click OK.
5.1.1.2.4 About selecting universe members
Use the "Member Selector" to select a part of a hierarchy, or members of a hierarchy of an OLAP
universe. You can:
• Select members according to their level or relationship within a hierarchy.
• Select named sets.
• Select calculated members.
• Specify members that you want to exclude from the query.
• Create a prompt for the end user to select criteria or members for a query.
When you have defined the members that are used in the query, you can use the query panel to add
filters and to preview the query.
Note:
When a member is selected along with a child node, all of the children of the member are included in
the query.
To sort members
By default the selected members are not sorted, they appear in the order they are stored in the data
source. You can sort lists in ascending or descending alphabetical order. This is the order that appears
in the query.
1.
Click a list of members.
2011-05-0653
Designing a Query

2.
Click the Sort order button and select the sort order from the list.
The sort is performed locally, and is displayed in the "Member Selector".
Note:
The sorted list does not correspond to the order in the data source, the sort is performed locally.
To exclude a member or member set from a selection
Before you begin, drag and drop a hierarchy or hierarchy member of an OLAP universe into the "Result
Objects" pane of the "Query Panel". You want to exclude one or more members from the query.
You can exclude members from a query in order to restrict results. Use the Exclude function in the
"Summary" pane of the "Member Selector", you can accurately define a member or member set that
you do not want to appear in the query. For example, you could exclude one town from a query that
returns sales figures for all states in a region. You can exclude:
• Explicit members.
• Implicit members resulting from member functions.
• Implicit members resulting from hierarchy levels.
• The hierarchy default member.
You cannot preview the expected results. You must create a report in order to observe the results. To
select a member that you want to exclude from the query results, do the following:
1.
Click a hierarchy in the "Result Objects" pane to launch the "Member Selector".
2.
Use the appropriate functions in the "Member Selector" to define the members that you want to
exclude.
The defined member appears in the "Summary" pane.
3.
Select the member to exclude.
4.
Click the Exclude checkbox.
The excluded member name displays in the "Summary" pane (and in the "Result Objects" pane)
with a line through the name to indicate that it is excluded from the query.
To insert a prompt in a selection
The prompt will appear when the selected member is used as a result object or filter object in a query.
You can prompt the user to select a member for the query.
1.
In the query panel, double-click a member of a hierarchy.
The "Member Selector" appears.
2.
Click Prompt.
3.
Edit the prompt.
4.
Click OK.
2011-05-0654
Designing a Query

5.1.2 Defining sorting
The sort button in the "Query Panel" will define how the data is retrieved from the data source. When
the query is run, a sort defined in the "Query Panel" will affect the order and amount of data that is
retrieved from the data source.
You can sort locally, using Crystal Reports features which sorts all the data retrieved from the query.
Using the sorting option in the "Query Panel" is recommended to define your sort more efficiently since
it sorts the data from the data source.
5.1.3 Defining query filters and prompts
You can add filters and prompts to your query to limit the data shown in the report.
Note:
Filters and member selection allow you to sort your data in different ways. Member selection does not
have an effect on the measure value of your data. For example, if you select a single city or all the cities
for a country, the value for the measure for that country will not be affected by the member selection.
Filtering data does have an effect on the measure value. For example, if you filter your data for a
particular city, the value for the related country will be reduced to the value of that country.
5.1.3.1 Creating query filters
You can use the following types of filters in a query:
• Predefined filters
These filters are created by your administrator.
• Custom filters
You define these filters while you are creating the query.
• Prompts
Prompts are dynamic filters that you define to display a question or a list of values; users can select
different filter values each time they refresh the report.
2011-05-0655
Designing a Query
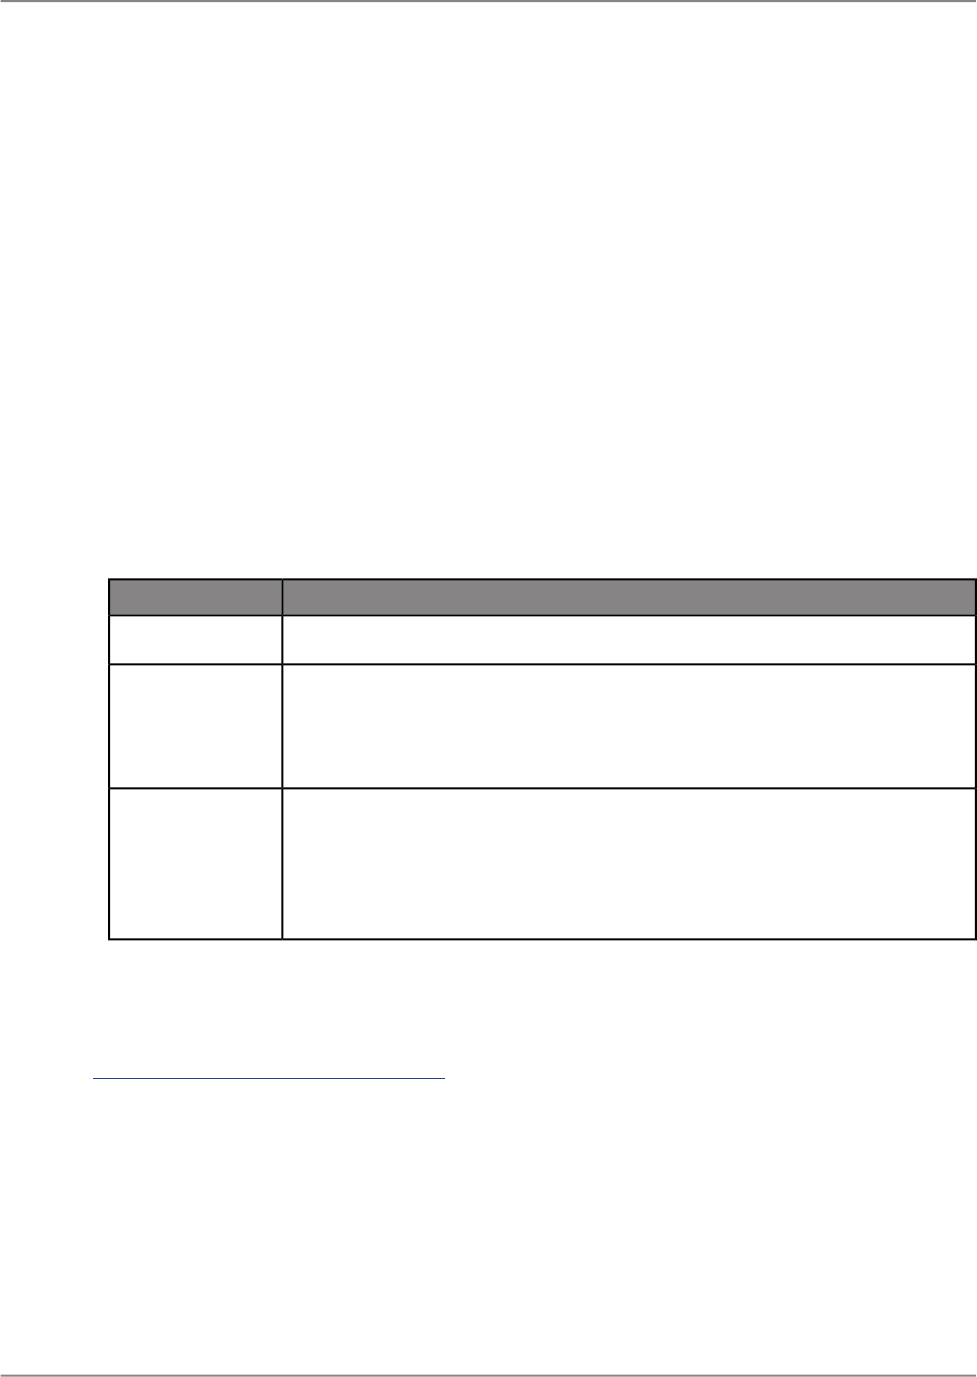
5.1.3.1.1 To add a predefined filter to a query
1.
Double-click the objects you want to use in your report, or drag them to the "Result Objects" pane.
2.
Drag a predefined filter to the "Filters" pane.
Note:
Predefined filters are created and edited by your administrator. As a user of the "Query Panel", you
cannot view the component parts of predefined filters, neither can you edit them.
When you run the query, the data corresponding to the query filters you selected is returned to the
report.
5.1.3.1.2 To create a custom filter
1.
Select the object you want to filter and drag it to the "Filters" pane.
2.
Select an operator from the list.
3.
Select Constant, LOV (list of values), or Prompt.
4.
The value you enter depends on the option you selected in step 3:
DescriptionOption
• Type a value into the text box.
Constant
a.
In the "Prompt(s)" dialog box, add members to your list by double-clicking
them, or by selecting them in the "Members" pane and clicking the arrow
in the center.
b.
Click OK.
LOV
a.
In the "Edit Prompt" dialog box, select "New Prompt" to add a new prompt,
or "Use Universe Parameters" to select a parameter from your universe.
b.
If you selected a "New Prompt", enter prompt options, or if you selected
"Use Universe Parameters", select a parameter.
c.
Click OK.
Prompt
The filter is added to the report. You can edit or remove the filter in the "Query Panel".
Related Topics
• Quick reference to query filter operators
5.1.3.2 Building prompts
2011-05-0656
Designing a Query

A prompt is a dynamic filter that displays a question every time you refresh the data in a report. You
respond to prompts by typing or selecting the values you want to view before you refresh the data.
Crystal Reports retrieves only the values you specified from the data source and returns those values
to the report.
Tip:
Prompts allow multiple users to view a single report but specify a different sub-set of the data source
information. Prompts also reduce the time it takes for the data to be retrieved from the data source.
5.1.3.2.1 To create a prompt
1.
Select the object you want to apply a prompt to and drag it to the "Filters" pane.
For example, if you want to allow users to specify the geographical region for the report, drag the
Region object to the "Filters" pane.
2.
Select an operator from the list.
Note:
You cannot use the following operators for prompts: Is null or Is not null.
3.
Select Prompt.
4.
In the "Edit Prompt" dialog box, select New Prompt.
5.
Enter a prompt message in the "Prompt Text" box.
For example, you might ask "Which region do you want to see data for?"
6.
Select "Select only from list" if you want your prompt to display a list of values from which users can
select values.
7.
Click OK to confirm the prompt.
The prompt appears at each report refresh.
Related Topics
• Quick reference to query filter operators
5.1.3.2.2 Combining query filters and prompts
You can apply multiple filters and prompts on a single query.
Quick reference to query filter operators
The following table will help you select the operator you need to define a query filter.
Filter createdSelectExampleValues to retrieve
<Country> Equal to USEqual to
Retrieve data for the
US only.
Values equal to a value
you specify.
2011-05-0657
Designing a Query
Filter createdSelectExampleValues to retrieve
<Quarter> Different
from Q4
Not Equal to
Retrieve data for all
quarters except Q4.
Values different from a
value you specify.
<Customer Age>
Greater than 60
Greater than
Retrieve data for cus-
tomers aged over 60.
Values greater than a
value you specify.
<Revenue> Greater
than or equal to
1500000
Greater than or equal
to
Retrieve data for rev-
enue starting from
$1.5M upward.
Values greater than or
equal to a value you
specify.
<Exam Grade> Less
than 40
Less than
Retrieve data for exam
grades below 40.
Values lower than a
value you specify.
<Age> Less than or
equal to 30
Less than or equal to
Retrieve customers
whose age is 30 or
less.
Values lower than or
equal to a value you
specify.
<Weeks> Between 25
and 36
Between
Retrieve the weeks
starting at week 25 and
finishing at 36 (includ-
ing week 25 and week
36).
Values between two
values you specify that
includes those two val-
ues.
<Weeks> Not Between
25 and 36
Not between
Retrieve all the weeks
of the year, except for
weeks 25 through 36
(week 25 and week 36
are not included).
Values outside the
range of two values
you specify.
<Country> In list 'US;
Japan; UK'
In list
Retrieve data for only
the following countries:
the US, Japan, and the
UK.
Values that are the
same as several values
you specify.
<Country> Not in list
'US; Japan; UK'
Not in list
Don't retrieve data for
the following countries:
the US, Japan, and the
UK.
Values that are differ-
ent from the multiple
values you specify.
2011-05-0658
Designing a Query
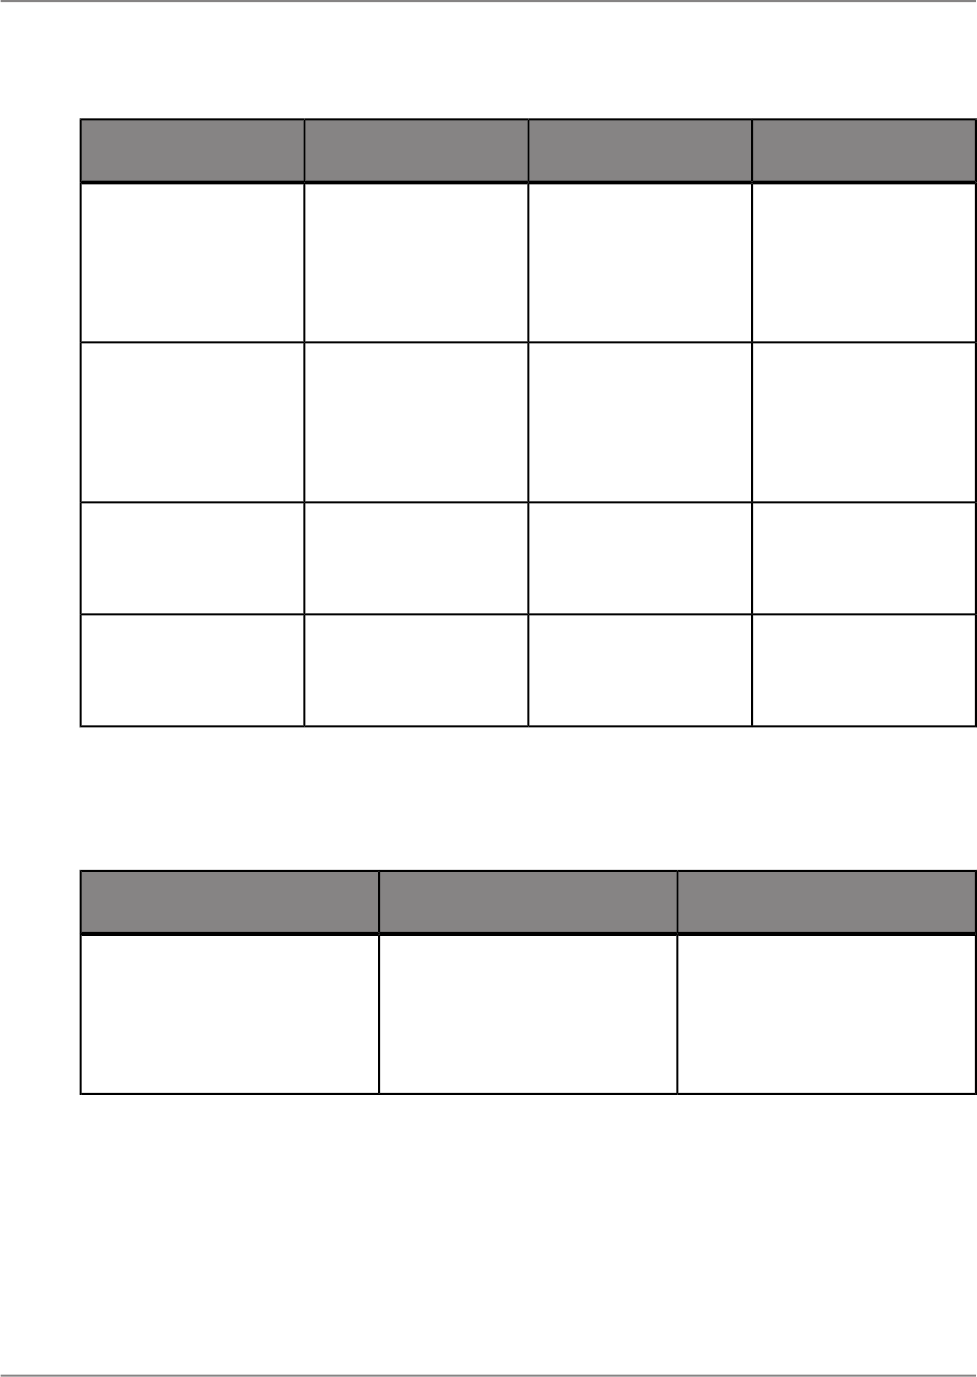
Filter createdSelectExampleValues to retrieve
<Children> Is nullIs null
Retrieve customers
without children (the
children column in the
data source has no da-
ta entry).
Values for which there
is no value entered in
the data source.
<Children> Is not NullIs not Null
Retrieve customers
with children (the chil-
dren column in the data
source has a data en-
try).
Values for which a val-
ue was entered in the
data source.
<DOB> Matches pat-
tern, '72'
Matches pattern
Retrieve customers
whose date of birth is
1972.
Values that includes a
specific string.
<DOB> Different from
pattern, '72'
Different from pattern
Retrieve customers
whose date of birth is
not 1972.
Values that don't in-
clude a specific string.
Using And or Or to combine query filters
This table explains the difference between the And and the Or operators.
SelectExampleRetrieve this data
And
Customers who ordered sup-
plies in Q1 and in Q2 (the data
you retrieve will include: cus-
tomers who placed orders in
both Q1 and Q2).
Data true for both filters.
2011-05-0659
Designing a Query
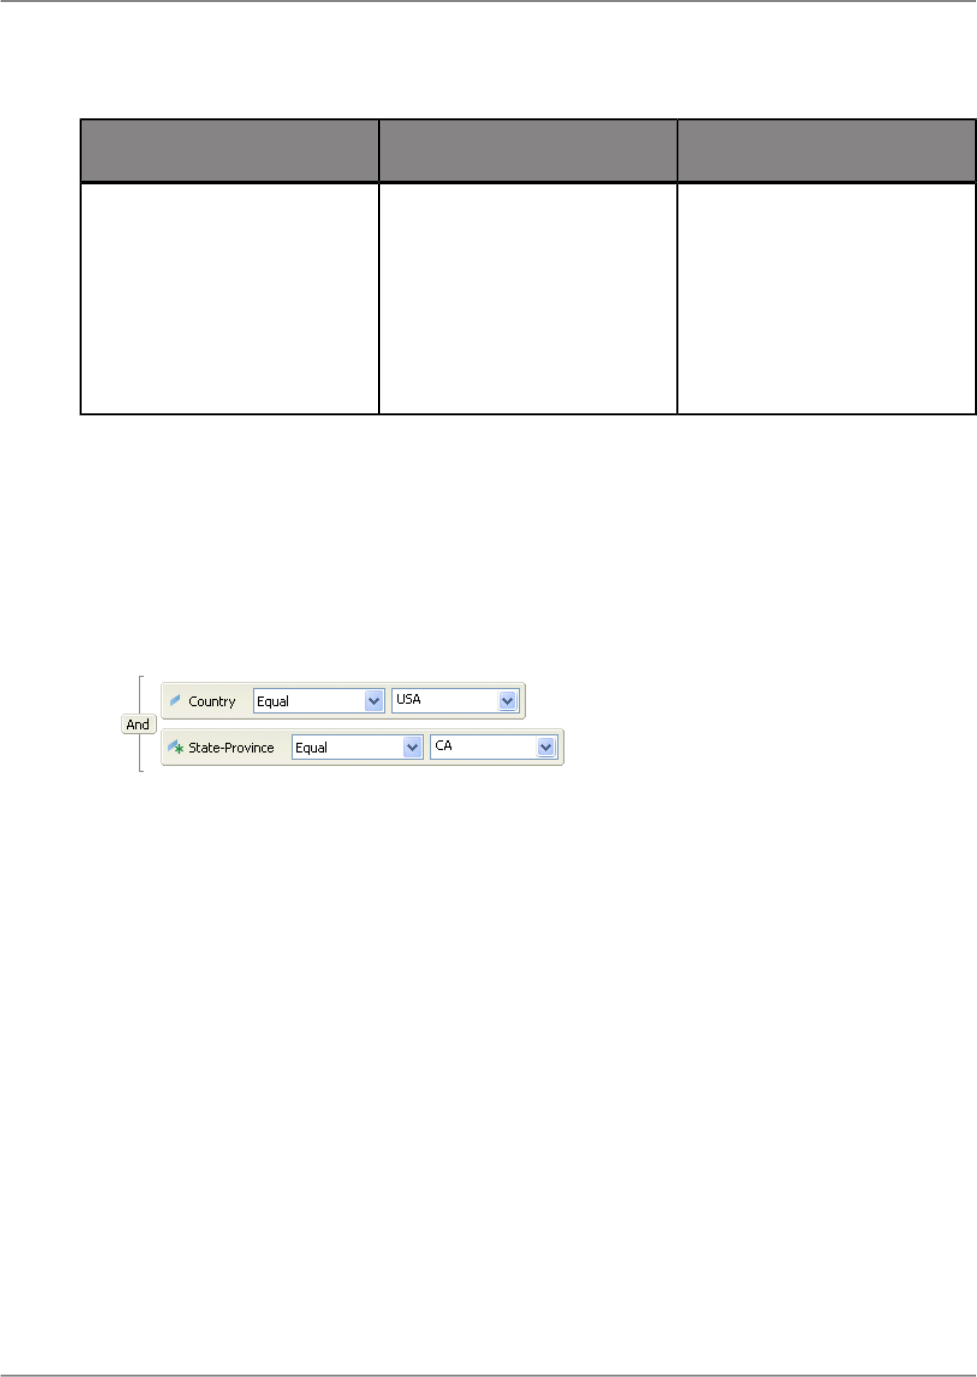
SelectExampleRetrieve this data
Or
Customers who ordered sup-
plies in: Q1 or Q2 (the data you
retrieve will include: customers
who placed orders in Q1only;
customers who placed orders
only in Q2, and; customers who
placed orders in both Q1 and
Q2).
Data true for any one of the fil-
ters.
Note:
Some OLAP data sources do not support the Or operator.
To combine filters and/or prompts
1.
Create each query filter and/or prompt.
By default, the "Query Panel" combines the filters and prompts with the And operator. You can leave
the And operator or change the operator to Or.
2.
If necessary, change the operator to Or by double-clicking the And operator.
Note:
Some OLAP data sources do not support the Or operator.
The prompts appear when you click OK, or when you refresh the report data.
5.1.3.3 Incompatible queries
Incompatible queries contain objects from two different contexts that are combined in a query. Crystal
Reports for Enterprise does not support incompatible queries. If your query is an incompatible query,
in the "Query Panel", re-design the query to avoid incompatibilities before you run the report.
2011-05-0660
Designing a Query

5.1.3.4 Selecting query context
Relational data sources can include data that is displayed in different ways depending on which context
is selected. The data retrieved from the data source is based upon the selected context.
Crystal Reports requires you to determine a specific context for your query to run the report if the query
contains multi-context options.
You can change the query context in the "Query Properties" dialog box.
5.1.3.5 To build a simple query
1.
Select an object in the "Universe" pane and double-click it or drag it to the "Result Objects" pane.
Objects that are placed in the "Result Objects" pane become the objects that your report will be
based on.
2.
Repeat the previous step for each object that you want to include in the query.
3.
(Optional) If you want to filter your query, select an object in the "Universe" or "Result Objects"
panes, and drag it to the "Filters" pane.
Add filters to the objects in the "Filters" pane to restrict the data your query returns. Filtering limits
the data that a user can see and reduces the runtime of queries.
4.
Click Finish.
The report is generated. The data from the objects in the "Result Objects" and "Filters" panes are
automatically formatted onto the report. The formatting time will vary depending on the size of your
report.
5.1.3.6 To create a combined query
In order to create a combine query, you must be connected to a relational universe with allow combined
operators enabled.
1.
After you create a simple query, click the (Show/Hide) the combined query pane button.
The combined queries pane appears below the "Universe" pane.
2.
Click Add a Combined Query.
2011-05-0661
Designing a Query
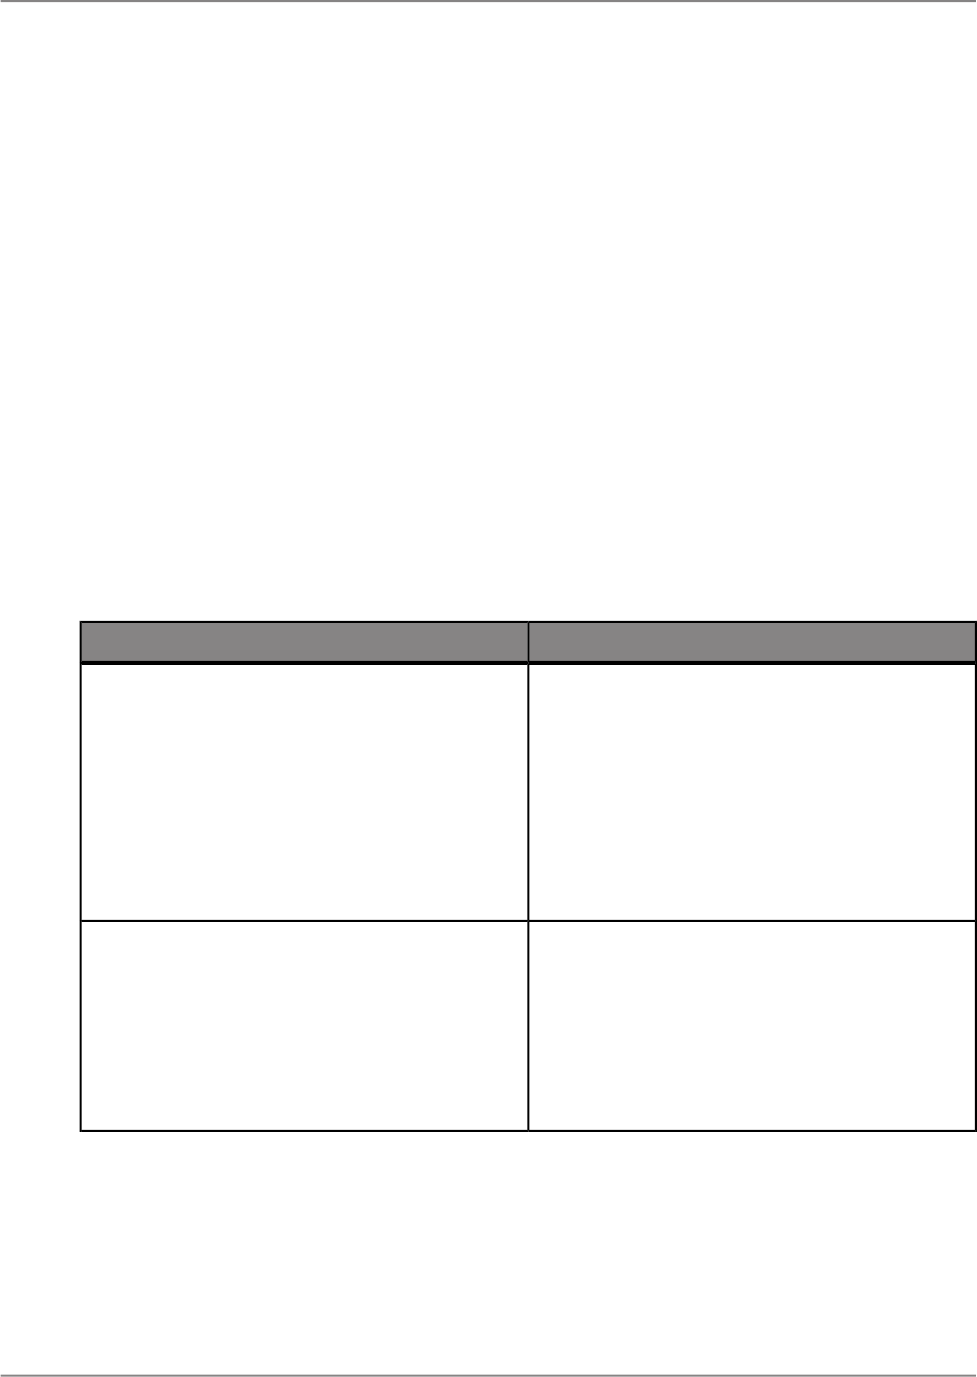
A new query is added to the pane and the two queries are combined with a Union join. To change
the type of join, double-click the join button to choose between the following options:
• Union
• Minus
• Intersect
• Union All
3.
Repeat Step 2 for any additional queries you want to add.
You can switch between your query definitions by clicking the buttons in the "Combined Queries"
pane.
5.1.4 Query panel functions
The Query Panel consists of the following elements:
Table 5-4: The Query Panel elements
DescriptionQuery Panel element
This pane shows the available classes and ob-
jects, organized in a tree structure. Click a node
(+) to open a branch or hierarchy, click again on
the node to close or collapse the hierarchy. Select
the display mode (caption, technical name, or
both caption and technical name for each object).
You can search for objects in this panel by flicking
the Filter button and entering the search string.
To build a query, drag objects from this panel to
the "Result Objects" or "Query Filters" panel.
"Universe" panel
This panel only displays when you are combining
queries. When you click (Show/Hide) Combine
Queries Panel, the panel shows the structure of
the queries you are combining. You can move
the query icons to reorganize the way that the
queries are combined. Click a query icon to dis-
play the query properties in the "Objects" and
"Filters" panels.
"Combine Queries" panel
2011-05-0662
Designing a Query

DescriptionQuery Panel element
Select the objects you want to include in the query
from the "Universe" panel and drag them into this
panel. These objects are returned as column
headers in the resulting report. When you place
hierarchical objects here, use the "Member Selec-
tor" tool to displays and select the members of
the hierarchy that you want to include in the query.
You can also select members that you want to
exclude from the query.
"Result Objects" panel
When you click (Show/Hide) Filter Panel, you
can drag objects into this panel to restrict the re-
sult data by limiting the query. For example, you
can limit the results returned to specific values or
value ranges.
"Query Filters" panel
When you click (Show/Hide) Data Preview
Panel, this panel allows you to test the results of
the query. You can preview the results that the
user will see, and modify the query and preview
the effects of the modification.
"Data Preview" panel
Use the query panel to create the following types of queries:
• Hierarchical queries for OLAP universes.
• Non-hierarchical queries for relational universes.
• Non-hierarchical queries for SAP BusinessObjects Enterprise XI 3.X universes.
The "Query Panel" also has the following buttons:
• Combine Queries shortcut button to combine queries for a relational universe.
• Query Properties to view and edit the query properties.
• View Script to view the structure of the query.
5.1.4.1 About query properties
You can set the following properties for a query:
2011-05-0663
Designing a Query
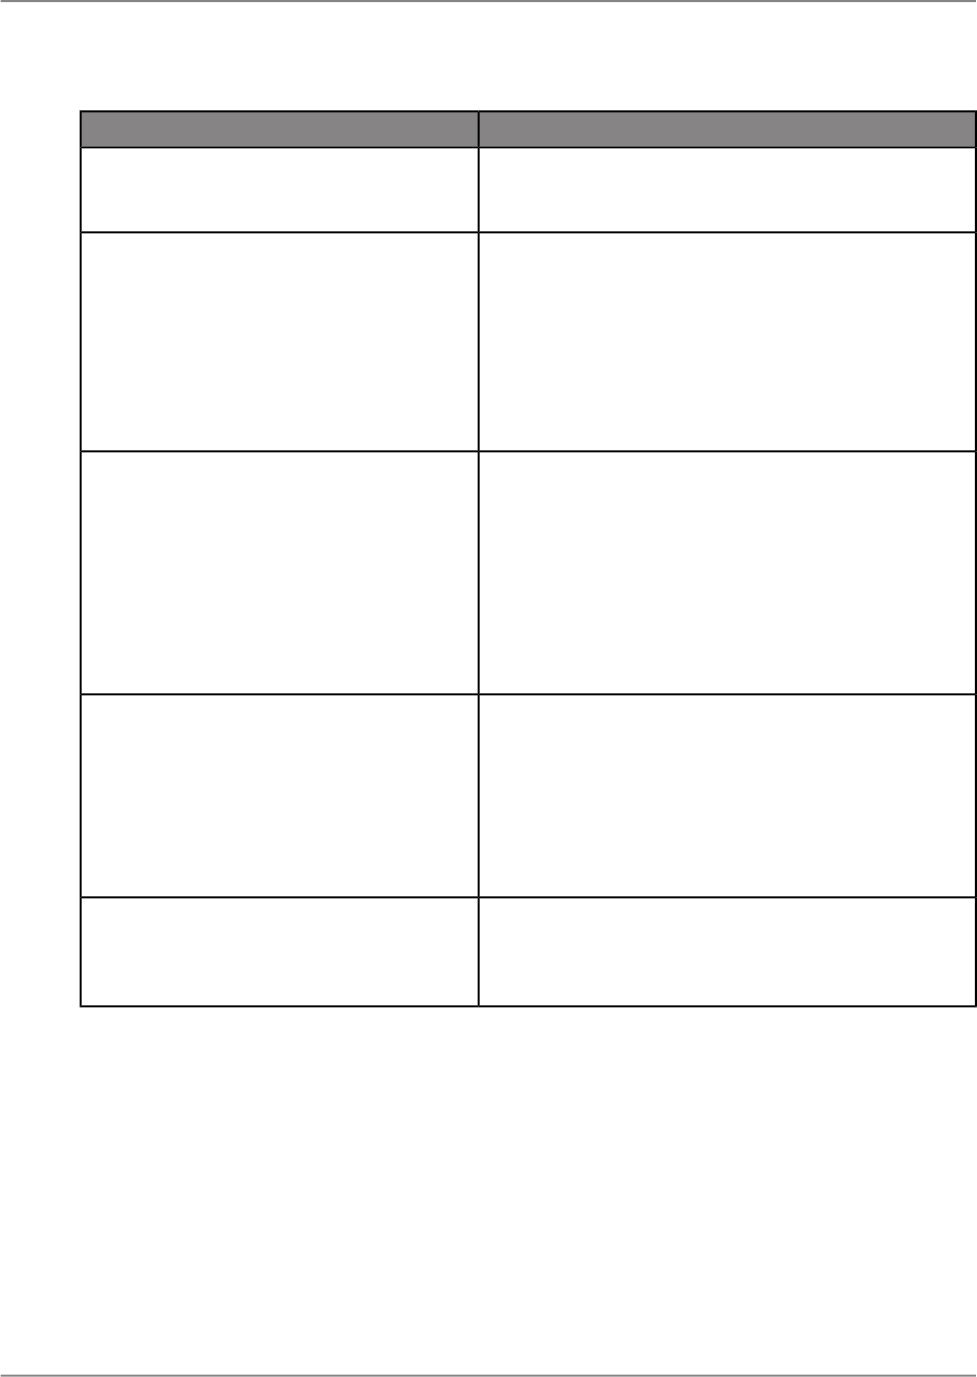
DescriptionProperty
When this option is selected, the query returns all related
rows, even if there are duplicate rows. If you do not want
duplicate rows in the result set, deselect this option.
Retrieve duplicate rows
An empty row occurs typically in multidimensional
queries when the data for the intersection of two or more
dimensions does not exist.
When this option is selected, the result set will contain
only rows that contain data.
When this option is deselected, the result set includes
rows that do not contain data.
Retrieve non empty rows
(only supported in OLAP universes
Defines the maximum time (in milliseconds) that a query
can run before the query is stopped. By default, this
value is the same as the Limit Execution Time parameter
in the universe parameters.
When you set this value to 0, this option is disabled.
When the Limit Execution Time parameter is lower than
this setting, the Limit Execution Time value is used for
limiting the query execution time.
Max retrieval time
Defines the maximum number of rows of data that are
displayed when the query runs. The query retrieves all
the possible rows, but only displays the first n rows,
where n is the maximum number of rows set for this
parameter.
The administrator can override this setting in the user
security profile settings.
Max rows retrieved
This parameter (when supported by the data source)
samples n data source rows, where n is the value set
for the sample result set. This method is faster than using
the Max rows retrieved parameter.
Sample result set
2011-05-0664
Designing a Query
DescriptionProperty
When this option is selected, when a user refreshes a
query that contains contexts, the user must choose the
context(s). The user can clear the previously selected
contexts by clicking Clear Contexts.
When this option is not selected, the query is refreshed
using the original contexts. If the contexts have been
edited since the last run for the query, the user must
choose the contexts again since the query is considered
as a new query.
Reset contexts on refresh
When selected, other users can access Query View and
modify queries in the document. When cleared, only the
report creator can modify the document. This option
applies to all queries in the document.
Allow other users to edit all queries
(interactive analysis only)
When there are several prompts in a query, use this
feature to set the order in which prompts are executed
in a query. Click a prompt and use the up or down arrow
to change the position of the prompt.
Prompt order
5.1.4.2 View script
Use the "View Script" button to view the query specifications. The query specification is viewable in an
xml format that shows the query design.
5.1.4.3 About copying query specifications
Use the "Copy query specifications in clipboard" button to copy your current query specifications in the
"Result Objects" panel to a clipboard. The clipboard is viewable in xml format in the "QuerySpec XML"
dialog box.
5.1.4.4 About pasting query specifications
2011-05-0665
Designing a Query

Use the "Paste query specifications from clipboard" button to paste your copied query specifications
from the clipboard to the "Result Objects" panel. Query specifications can be executed without defining
any object in the Query Panel.
5.1.4.5 Editing an existing query
You can return to the "Query Panel" to edit an existing query. Queries can be edited by adding or
removing an object, or you can add, edit, or remove a filter.
5.1.4.5.1 To edit an existing query
Before the query can be edited, you must first log on to the BI platform server.
1.
To edit your report query, click Data > Edit Query.
The "Query Panel" appears.
2.
In the "Query Panel", edit your query as necessary.
3.
When you have finished editing your query, click Finish.
Changes that you made in your query are reflected in your report.
Note:
If you remove objects from your query that you have used in your report, the objects will automatically
be removed from the report.
5.1.5 Auto generate report with default layout
The "Generate Report" check box in the "Query Panel", when selected, will automatically generate the
report using the result objects placed in the "Result Objects" panel.
Note:
The "Generate Report" feature will work differently if you are connected to a relational data source or
an OLAP data source.
5.1.5.1 Relational data sources
When connected to a relational data source, the selected "Generate Report" check box will automatically
generate a report containing all report objects positioned in the "Result Objects" panel.
2011-05-0666
Designing a Query

The objects will appear on the report canvas in the "Body" section in the same order they positioned
in the "Result Objects" panel.
5.1.5.2 OLAP data sources
When connected to an OLAP data source, the selected "Generate Report" check box will only
automatically generate a report containing all report objects positioned in the "Result Objects" panel if
a hierarchy is not selected.
If a hierarchy is selected, the hierarchy and the members the hierarchy contains will not automatically
be added to the "Body" section of the report canvas.
5.2 SAP BEx query design
SAP BEx queries contain pre-designed result objects to run reports on.
5.2.1 Active hierarchies
SAP BEx queries are often hierarchical and can have more than one hierarchy to choose from. As a
report designer, you need to choose a hierarchy to report on. This is referred to as the active hierarchy.
An active hierarchy is a hierarchy that is currently being used. The hierarchy represents a different
hierarchy from the data source, but with the same name. If the hierarchy variable is changed when the
report is refreshed, the report will change the underlying hierarchy represented by the active hierarchy.
For example if you have two hierarchies from an SAP BEx query: country_hierarchy_01 and
country_hierachy_02 the "Query Panel" will display a single hierarchy named country. The "country"
hierarchy represents the active hierarchy. When this hierarchy is used in a report, the name will remain
unchanged. If this hierarchy is mandatory to the BEx query to run the report, when the report is refreshed,
Crystal Reports will prompt you to select the hierarchy variable. Your selection of country_hierarchy_01
or country_hierachy_02 will change the underlying hierarchy represented by the country hierarchy, but
the name of the country hierarchy will not change.
It is recommended to use an active hierarchy (such as country) instead of a specific hierarchy (such
as country_hierarchy_01 or country_hierachy_02)
2011-05-0667
Designing a Query

5.2.2 Defining the data selection for an SAP BEx query
You build queries in the "Query Panel" by using objects in an SAP BEx query. The objects in the SAP
BEx query are a graphical representation of the information available in a data source.
The "Query Panel" is divided into several panes:
• The "Universe" pane shows a tree view of the objects that your universe contains. You cannot add
new objects or edit existing objects in the universe from the "Query Panel".
Note:
You can see all available objects in this pane by clicking Expand all. If you want to see how objects
relate to each other, click Collapse all. This option provides you with a visual representation of the
hierarchical structure of objects if such a structure is present in the universe.
• The "Result Objects" pane is where you place the objects that you want as part of your query.
• The "Query Filters" pane is where you place the objects that you want to use to filter the data that
is returned from your universe. You can add predefined filters from your Universe, or create custom
filters by adding objects and using the list boxes to define your filter.
5.2.2.1 SAP BEx query member selection
Use the "Member Selector" to select members of OLAP SAP BEx query hierarchies to:
• Create named sets of members when creating an SAP BEx query
• Create queries based on hierarchies or members of hierarchies
• Define members that will be excluded from queries
The "Member Selector" consists of the following panes:
DescriptionPane
"Members" tab: Select or exclude members according to specific relationships in
the hierarchy.
"Member Selector"
pane
This shows the selected members, prompts, and excluded members of the query
that you are building. The information you see in the "Summary" pane appears
in the "Result objects" pane of the "Query Panel".
"Summary "pane
Note:
Universe and SAP BEx Query member selection differ in their behavior when restricting members. In
a universe member selection, there is no restriction of member selection. However, for an SAP BEx
2011-05-0668
Designing a Query
Query, if you select a parent node and one of its child nodes, all children nodes will be selected in the
query.
5.2.2.1.1 About hierarchies
A hierarchy is an ordered series of related objects (dimensions). An example of a hierarchy is Geography,
which may group dimensions such as Country, Region, and City. Users can observe data related to
the hierarchy from various viewpoints (All cities for a selected region, all cities for a selected country,
the country and region for a selected city, and so on).
To select a members by hierarchal relationships
Use the member relations functions of the "Member Selector" to choose members by their relationship
or position within a hierarchy. The different relationships you can select are available when you select
a member in the "Member Selector" pane.
1.
In the "Members" tab of the "Member Selector", click in the selection box on the left of the member
name.
2.
In the "Member Selector", click the name of the selected member.
The list of available options appears.
3.
Choose the appropriate relation function from those described below:
DescriptionOption
Use only the selected member. This is the default setting.
Self
Selects members of the same level in a branch of a hierarchy.
Children
Selects the members below the active member in a hierarchy.
Descendants
The selection is displayed in the "Summary" pane, preceded by fx.
5.2.2.1.2 About named sets
A named set is a group of members that you select and save as a personalized set of members. They
would not normally appear together in a hierarchy, but correspond to queries or parts of queries that
you frequently use. The named set is available in the "Query Panel" for creating queries for the end-user.
To select named sets
The hierarchy object you have placed in the "Result Objects" pane of the "Query Panel" contains one
or more named sets.
1.
Drag a hierarchy into the "Result Objects" pane.
2.
Launch the "Member Selector."
3.
In the "Member Selector", click the Metadata tab.
The "Member Selector" displays the available levels, calculated members, and named sets.
4.
Select a named set.
2011-05-0669
Designing a Query

5.
Click OK.
5.2.2.1.3 About selecting universe members
Use the "Member Selector" to select a part of a hierarchy, or members of a hierarchy of an OLAP
universe. You can:
• Select members according to their level or relationship within a hierarchy.
• Select named sets.
• Select calculated members.
• Specify members that you want to exclude from the query.
• Create a prompt for the end user to select criteria or members for a query.
When you have defined the members that are used in the query, you can use the query panel to add
filters and to preview the query.
Note:
When a member is selected along with a child node, all of the children of the member are included in
the query.
To sort members
By default the selected members are not sorted, they appear in the order they are stored in the data
source. You can sort lists in ascending or descending alphabetical order. This is the order that appears
in the query.
1.
Click a list of members.
2.
Click the Sort order button and select the sort order from the list.
The sort is performed locally, and is displayed in the "Member Selector".
Note:
The sorted list does not correspond to the order in the data source, the sort is performed locally.
To exclude a member or member set from a selection
Before you begin, drag and drop a hierarchy or hierarchy member of an OLAP universe into the "Result
Objects" pane of the "Query Panel". You want to exclude one or more members from the query.
You can exclude members from a query in order to restrict results. Use the Exclude function in the
"Summary" pane of the "Member Selector", you can accurately define a member or member set that
you do not want to appear in the query. For example, you could exclude one town from a query that
returns sales figures for all states in a region. You can exclude:
• Explicit members.
• Implicit members resulting from member functions.
• Implicit members resulting from hierarchy levels.
• The hierarchy default member.
You cannot preview the expected results. You must create a report in order to observe the results. To
select a member that you want to exclude from the query results, do the following:
2011-05-0670
Designing a Query
1.
Click a hierarchy in the "Result Objects" pane to launch the "Member Selector".
2.
Use the appropriate functions in the "Member Selector" to define the members that you want to
exclude.
The defined member appears in the "Summary" pane.
3.
Select the member to exclude.
4.
Click the Exclude checkbox.
The excluded member name displays in the "Summary" pane (and in the "Result Objects" pane)
with a line through the name to indicate that it is excluded from the query.
5.2.2.2 Quick reference to objects
An object is a named component that maps to data or a derivation of data in the data source. For
example, an object may represent a column in a result folder, or it may be the summary of the values
in a column.
You use objects in a query to retrieve data for your reports. For example, some of the objects in a
human resources universe might be Names, Addresses, and Salaries.
Objects can represent different types of information.
Note:
• Object properties are defined in the SAP BusinessObjects Designer, but are not taken into account
by the "Query Panel" in Crystal Reports.
• Objects cannot be defined directly in the "Query Panel". Use the SAP BusinessObjects Designer to
define objects in a universe.
DescriptionExamplesObject
This object is a logical grouping
of columns from one or more
dimension tables that describes
a similar set of characteristics.
Analysis Dimension
This object retrieves the data
that provides the time basis for
analysis in a report. Time Dimen-
sion objects typically retrieve
date-type data.
Time Dimension
2011-05-0671
Designing a Query
DescriptionExamplesObject
This object provides descriptive
data about a dimension. A detail
is always attached to the dimen-
sion for which it provides addi-
tional information. For example,
Address, Birth Date and Com-
mute Distance are detail objects
that are associated with the
Customer dimension.
Attribute
This object retrieves numeric
data that is the result of calcula-
tions on data in the data source.
Measure objects are often locat-
ed in a Measures class.
Measure
This object provides a specific
default sorting order of the di-
mension data.
Default Hierarchy
This object provides a sorting
order of the dimension data
based upon a specific level.
Level based Hierarchy
This object provides a sorting
order of the dimension data
based upon a value.
Self-referenced and Value
based Hierarchy
This object is a group of mem-
bers that you select and save as
a personalized set of members.
They would not normally appear
together in a hierarchy, but cor-
respond to queries or parts of
queries that you frequently use.
Named Set
An object that allows you to se-
lect a subset of objects based
on query criteria provided.
Filters
2011-05-0672
Designing a Query
DescriptionExamplesObject
This object represents an axis
of analysis in a query. It can
map to one or more columns or
calculations that are used as a
key element for analysis in a
query. Dimensions based on a
data foundation or an OLAP
cube differ as follows:
• A dimension based on an
OLAP cube contains hierar-
chies organized by levels.
Each level can contain an
attribute.
• A dimension based on a data
foundation contains at-
tributes. Hierarchies are
constructed across related
tables as flat hierarchies.
Dimension
This object retrieves a subset of
the data from the parent hierar-
chy object where all of the re-
turned values come from the
same depth in the hierarchy.
Level
This object is a container that
holds a group of related objects.
This is equivalent to the Class
in Universe Designer.
Folder
5.2.3 Defining sorting
The sort button in the "Query Panel" will define how the data is retrieved from the data source. When
the query is run, a sort defined in the "Query Panel" will affect the order and amount of data that is
retrieved from the data source.
2011-05-0673
Designing a Query

You can sort locally, using Crystal Reports features which sorts all the data retrieved from the query.
Using the sorting option in the "Query Panel" is recommended to define your sort more efficiently since
it sorts the data from the data source.
5.2.4 Defining query filters and prompts
You can add filters and prompts to your query to limit the data shown in the report.
Note:
Filters and member selection allow you to sort your data in different ways. Member selection does not
have an effect on the measure value of your data. For example, if you select a single city or all the cities
for a country, the value for the measure for that country will not be affected by the member selection.
Filtering data does have an effect on the measure value. For example, if you filter your data for a
particular city, the value for the related country will be reduced to the value of that country.
5.2.4.1 Creating query filters
You can use the following types of filters in a query:
• Predefined filters
These filters are created by your administrator.
• Custom filters
You define these filters while you are creating the query.
• Prompts
Prompts are dynamic filters that you define to display a question or a list of values; users can select
different filter values each time they refresh the report.
5.2.4.1.1 To add a predefined filter to a query
1.
Double-click the objects you want to use in your report, or drag them to the "Result Objects" pane.
2.
Drag a predefined filter to the "Filters" pane.
Note:
Predefined filters are created and edited by your administrator. As a user of the "Query Panel", you
cannot view the component parts of predefined filters, neither can you edit them.
When you run the query, the data corresponding to the query filters you selected is returned to the
report.
2011-05-0674
Designing a Query
5.2.4.1.2 To create a custom filter
1.
Select the object you want to filter and drag it to the "Filters" pane.
2.
Select an operator from the list.
3.
Select Constant, LOV (list of values), or Prompt.
4.
The value you enter depends on the option you selected in step 3:
DescriptionOption
• Type a value into the text box.
Constant
a.
In the "Prompt(s)" dialog box, add members to your list by double-clicking
them, or by selecting them in the "Members" pane and clicking the arrow
in the center.
b.
Click OK.
LOV
a.
In the "Edit Prompt" dialog box, select "New Prompt" to add a new prompt,
or "Use Universe Parameters" to select a parameter from your universe.
b.
If you selected a "New Prompt", enter prompt options, or if you selected
"Use Universe Parameters", select a parameter.
c.
Click OK.
Prompt
The filter is added to the report. You can edit or remove the filter in the "Query Panel".
Related Topics
• Quick reference to query filter operators
5.2.4.2 Building prompts
A prompt is a dynamic filter that displays a question every time you refresh the data in a report. You
respond to prompts by typing or selecting the values you want to view before you refresh the data.
Crystal Reports retrieves only the values you specified from the data source and returns those values
to the report.
Tip:
Prompts allow multiple users to view a single report but specify a different sub-set of the data source
information. Prompts also reduce the time it takes for the data to be retrieved from the data source.
5.2.4.2.1 To create a prompt
1.
Select the object you want to apply a prompt to and drag it to the "Filters" pane.
2011-05-0675
Designing a Query

For example, if you want to allow users to specify the geographical region for the report, drag the
Region object to the "Filters" pane.
2.
Select an operator from the list.
Note:
You cannot use the following operators for prompts: Is null or Is not null.
3.
Select Prompt.
4.
In the "Edit Prompt" dialog box, select New Prompt.
5.
Enter a prompt message in the "Prompt Text" box.
For example, you might ask "Which region do you want to see data for?"
6.
Select "Select only from list" if you want your prompt to display a list of values from which users can
select values.
7.
Click OK to confirm the prompt.
The prompt appears at each report refresh.
Related Topics
• Quick reference to query filter operators
5.2.4.2.2 Combining query filters and prompts
You can apply multiple filters and prompts on a single query.
Quick reference to query filter operators
The following table will help you select the operator you need to define a query filter.
Filter createdSelectExampleValues to retrieve
<Country> Equal to USEqual to
Retrieve data for the
US only.
Values equal to a value
you specify.
<Quarter> Different
from Q4
Not Equal to
Retrieve data for all
quarters except Q4.
Values different from a
value you specify.
<Customer Age>
Greater than 60
Greater than
Retrieve data for cus-
tomers aged over 60.
Values greater than a
value you specify.
<Revenue> Greater
than or equal to
1500000
Greater than or equal
to
Retrieve data for rev-
enue starting from
$1.5M upward.
Values greater than or
equal to a value you
specify.
2011-05-0676
Designing a Query

Filter createdSelectExampleValues to retrieve
<Exam Grade> Less
than 40
Less than
Retrieve data for exam
grades below 40.
Values lower than a
value you specify.
<Age> Less than or
equal to 30
Less than or equal to
Retrieve customers
whose age is 30 or
less.
Values lower than or
equal to a value you
specify.
<Weeks> Between 25
and 36
Between
Retrieve the weeks
starting at week 25 and
finishing at 36 (includ-
ing week 25 and week
36).
Values between two
values you specify that
includes those two val-
ues.
<Weeks> Not Between
25 and 36
Not between
Retrieve all the weeks
of the year, except for
weeks 25 through 36
(week 25 and week 36
are not included).
Values outside the
range of two values
you specify.
<Country> In list 'US;
Japan; UK'
In list
Retrieve data for only
the following countries:
the US, Japan, and the
UK.
Values that are the
same as several values
you specify.
<Country> Not in list
'US; Japan; UK'
Not in list
Don't retrieve data for
the following countries:
the US, Japan, and the
UK.
Values that are differ-
ent from the multiple
values you specify.
<Children> Is nullIs null
Retrieve customers
without children (the
children column in the
data source has no da-
ta entry).
Values for which there
is no value entered in
the data source.
2011-05-0677
Designing a Query
Filter createdSelectExampleValues to retrieve
<Children> Is not NullIs not Null
Retrieve customers
with children (the chil-
dren column in the data
source has a data en-
try).
Values for which a val-
ue was entered in the
data source.
<DOB> Matches pat-
tern, '72'
Matches pattern
Retrieve customers
whose date of birth is
1972.
Values that includes a
specific string.
<DOB> Different from
pattern, '72'
Different from pattern
Retrieve customers
whose date of birth is
not 1972.
Values that don't in-
clude a specific string.
Using And or Or to combine query filters
This table explains the difference between the And and the Or operators.
SelectExampleRetrieve this data
And
Customers who ordered sup-
plies in Q1 and in Q2 (the data
you retrieve will include: cus-
tomers who placed orders in
both Q1 and Q2).
Data true for both filters.
Or
Customers who ordered sup-
plies in: Q1 or Q2 (the data you
retrieve will include: customers
who placed orders in Q1only;
customers who placed orders
only in Q2, and; customers who
placed orders in both Q1 and
Q2).
Data true for any one of the fil-
ters.
Note:
Some OLAP data sources do not support the Or operator.
2011-05-0678
Designing a Query
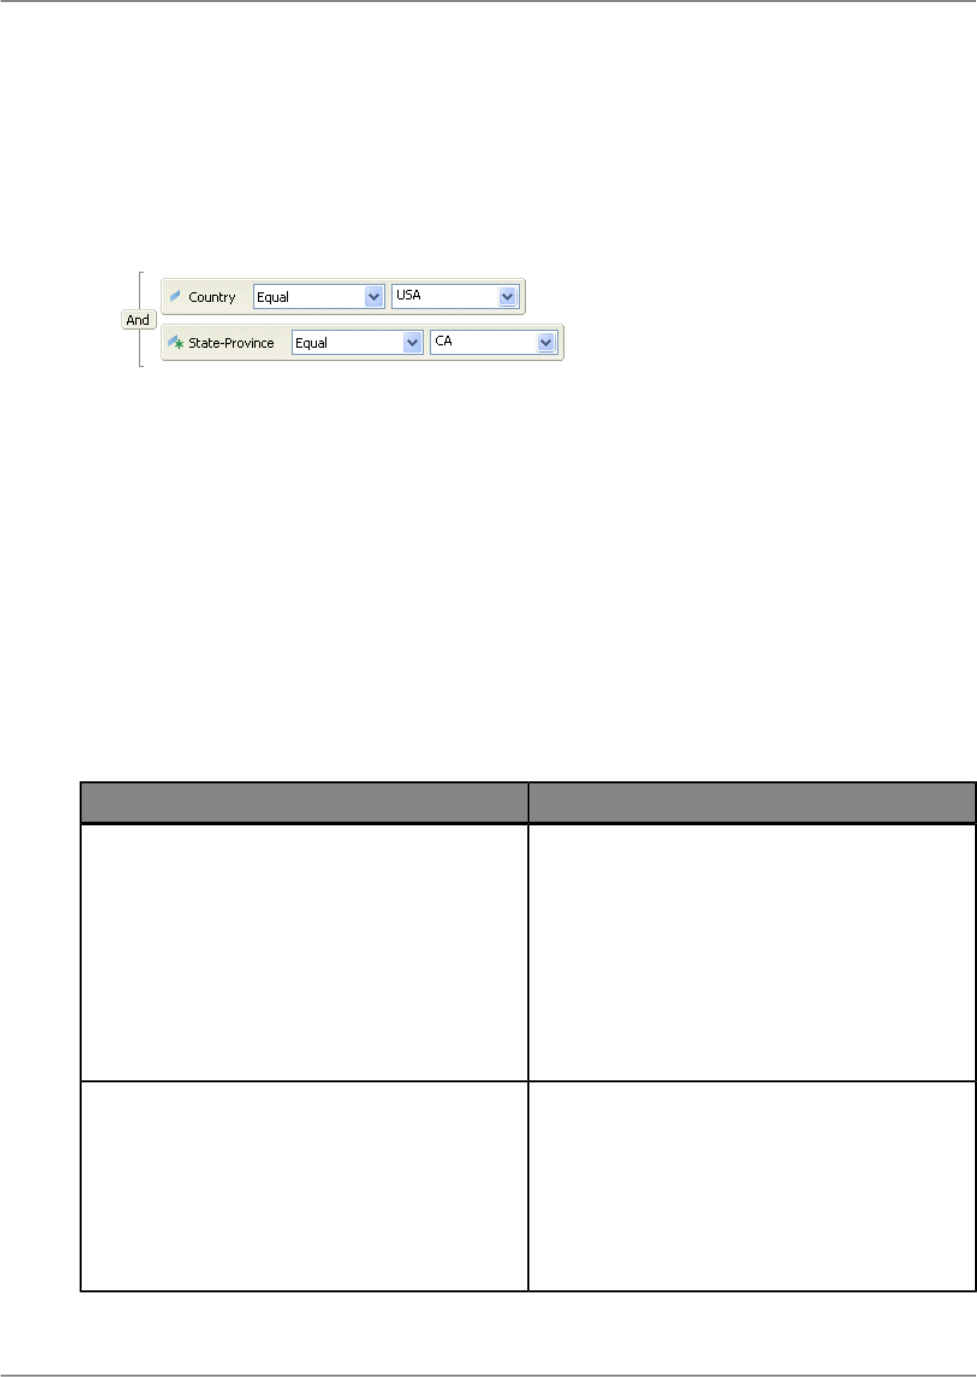
To combine filters and/or prompts
1.
Create each query filter and/or prompt.
By default, the "Query Panel" combines the filters and prompts with the And operator. You can leave
the And operator or change the operator to Or.
2.
If necessary, change the operator to Or by double-clicking the And operator.
Note:
Some OLAP data sources do not support the Or operator.
The prompts appear when you click OK, or when you refresh the report data.
5.2.5 Query panel functions
The Query Panel consists of the following elements:
Table 5-8: The Query Panel elements
DescriptionQuery Panel element
This pane shows the available classes and ob-
jects, organized in a tree structure. Click a node
(+) to open a branch or hierarchy, click again on
the node to close or collapse the hierarchy. Select
the display mode (caption, technical name, or
both caption and technical name for each object).
You can search for objects in this panel by flicking
the Filter button and entering the search string.
To build a query, drag objects from this panel to
the "Result Objects" or "Query Filters" panel.
"Universe" panel
This panel only displays when you are combining
queries. When you click (Show/Hide) Combine
Queries Panel, the panel shows the structure of
the queries you are combining. You can move
the query icons to reorganize the way that the
queries are combined. Click a query icon to dis-
play the query properties in the "Objects" and
"Filters" panels.
"Combine Queries" panel
2011-05-0679
Designing a Query
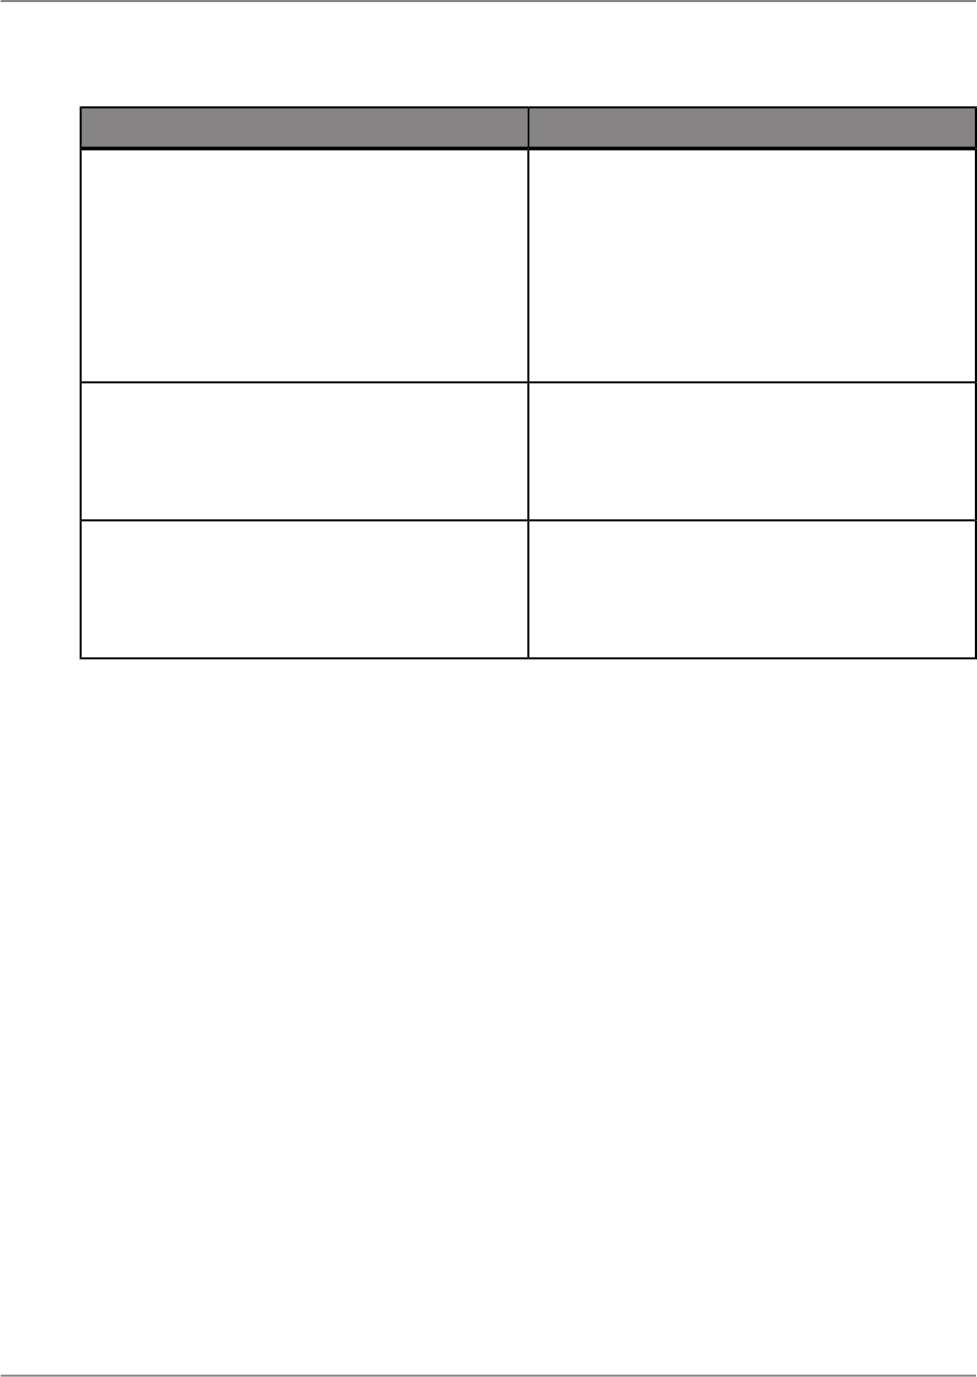
DescriptionQuery Panel element
Select the objects you want to include in the query
from the "Universe" panel and drag them into this
panel. These objects are returned as column
headers in the resulting report. When you place
hierarchical objects here, use the "Member Selec-
tor" tool to displays and select the members of
the hierarchy that you want to include in the query.
You can also select members that you want to
exclude from the query.
"Result Objects" panel
When you click (Show/Hide) Filter Panel, you
can drag objects into this panel to restrict the re-
sult data by limiting the query. For example, you
can limit the results returned to specific values or
value ranges.
"Query Filters" panel
When you click (Show/Hide) Data Preview
Panel, this panel allows you to test the results of
the query. You can preview the results that the
user will see, and modify the query and preview
the effects of the modification.
"Data Preview" panel
Use the query panel to create the following types of queries:
• Hierarchical queries for OLAP universes.
• Non-hierarchical queries for relational universes.
• Non-hierarchical queries for SAP BusinessObjects Enterprise XI 3.X universes.
The "Query Panel" also has the following buttons:
• Combine Queries shortcut button to combine queries for a relational universe.
• Query Properties to view and edit the query properties.
• View Script to view the structure of the query.
5.2.5.1 View script
Use the "View Script" button to view the query specifications. The query specification is viewable in an
xml format that shows the query design.
2011-05-0680
Designing a Query

5.2.5.2 About copying query specifications
Use the "Copy query specifications in clipboard" button to copy your current query specifications in the
"Result Objects" panel to a clipboard. The clipboard is viewable in xml format in the "QuerySpec XML"
dialog box.
5.2.5.3 About pasting query specifications
Use the "Paste query specifications from clipboard" button to paste your copied query specifications
from the clipboard to the "Result Objects" panel. Query specifications can be executed without defining
any object in the Query Panel.
5.2.5.4 Editing an existing query
You can return to the "Query Panel" to edit an existing query. Queries can be edited by adding or
removing an object, or you can add, edit, or remove a filter.
5.2.5.4.1 To edit an existing query
Before the query can be edited, you must first log on to the BI platform server.
1.
To edit your report query, click Data > Edit Query.
The "Query Panel" appears.
2.
In the "Query Panel", edit your query as necessary.
3.
When you have finished editing your query, click Finish.
Changes that you made in your query are reflected in your report.
Note:
If you remove objects from your query that you have used in your report, the objects will automatically
be removed from the report.
2011-05-0681
Designing a Query

2011-05-0682
Designing a Query

Process to Verify Data Source on First Refresh
When you open a report, Crystal Reports automatically checks for changes in the metadata of the active
data source the first time you refresh your report data. Active data sources include universes and SAP
BEx queries.
If any changes in the metadata are detected, a dialog box will appear indicating that a change has been
made on the data source and the report must be updated. Changes to a data source could include any
of the following:
• Changes to properties or attributes of a result object, for example, the result object name.
• Changes to data types of the result objects in the data source.
• Changes to the number of inherited parameters in the data source.
Depending on the changes made to the data source, you may have to remap result objects and reformat
your report.
Note:
When the set of result objects are updated, any saved data will be discarded.
Example: A parameter has been added or removed to filter data from a data source:
A universe designer may choose to add an inherited parameter to a result object to ensure all reports
are run on time during peak report periods. "Crystal Reports" will detect this change to the number of
parameters in the source data. The inherited parameter will restrict the amount of available data in
each report by prompting users to specify information, such as by department, region, or sales quarter.
If the universe designer removes the inherited parameter from the data source, "Crystal Reports" will
detect this change, but the parameter will remain in the report. It will appear in the "Parameters" area
of the "Data Explorer" as a local parameter which you can delete.
In this case, once you have refreshed the result objects in your report, save the report so that you do
not need to verify the metadata again the next time you open it.
2011-05-0683
Process to Verify Data Source on First Refresh

2011-05-0684
Process to Verify Data Source on First Refresh

Report Layout and Formatting
This chapter refers to changes you can make to the layout and design of a report, as well as the
appearance of text, objects, or entire report sections.
You can use formatting to do many things, including:
• Dividing a report into sections.
• Calling attention to certain data.
• Changing the presentation of dates, numbers, Boolean values, currency values, and text strings.
• Hiding unwanted sections.
• Giving the report a professional appearance.
The following topics describe the types of formatting you can do with Crystal Reports, giving step-by-step
instructions for performing a variety of formatting tasks.
7.1 Using the report design environment
7.1.1 Understanding section characteristics
A report consists of several sections, including the "Report Header", "Page Header", "Group Header",
"Body", "Group Footer", "Page Footer", and "Report Footer".
For more information about sections, see Structure mode areas.
7.1.2 Creating multiple-column reports
Instead of having the data in the "Body" section of your report print straight down the page, you can set
up multiple columns and have the data flow from column to column.
2011-05-0685
Report Layout and Formatting

7.1.2.1 To create a multiple-column report
1.
Open the report you want to format with multiple columns.
2.
Right-click in the "Body" heading area and click Format Body.
The Format dialog box appears.
3.
Select Multiple Columns.
4.
Set the Column Width for your column.
Keep in mind the width of your paper when deciding your column width. For example, if you have
three elements in your Body section, and they take up four inches of space, limit the width of the
column to under four and a half inches so that all the element information can be seen.
5.
Choose a Flow Direction for your data.
6.
If the report you're formatting contains grouping, select Multi-Column Groups.
7.
Set the Horizontal and Vertical gaps you want to maintain between each record in your column.
When you preview the report, you will see that the data appears in columns. If your report has element
headers, they appear only for the first column. To have element headers for the second column, insert
a text element in the Crystal Reports editor.
7.1.3 Using smart guidelines
Smart guidelines help you format report columns in the Crystal Reports designer canvas. The columns
and the objects within them can be moved and rearranged simultaneously as the smart guideline
calculate associated objects based upon similar alignment. The grids that appear on the report depend
on the element you have selected and the feature automatically selects related elements in the column.
The smart guidelines feature can be turned off in the "Report Options" dialog box. If you do not want
to turn smart guidelines off, but do want to deactivate the feature for a specific element, select the
element and press Alt.
Note:
Smart guidelines do not work with elements that are already formatted, such as cross-tab elements.
7.1.3.1 To insert a column using smart guidelines
2011-05-0686
Report Layout and Formatting

Smart guidelines allow you to insert new result object columns without having to manually move the
surrounding columns over. If smart guidelines are disabled, the inserted result object will overlap the
existing result object.
1.
Select a result object from the "Data Explorer" side panel and drag the object to the report canvas.
2.
Align the result object frame in the desired column until the smart guideline grids appear to indicate
the column position and place the result object.
Note:
If you insert a column between two existing columns, the blue smart guideline grid will become a
dark blue to indicate the column will be positioned between the existing columns.
7.1.3.2 Adjusting columns using smart guidelines
You can reorder, remove, and resize columns using the column side cursors and handles on the top
of the report canvas. Smart guidelines allow you to delete and adjust columns without having to manually
move the surrounding columns over.
7.1.3.2.1 To adjust column width
1.
Click the column you want to adjust.
Smart guideline grids appear.
2.
Select the right side of the column until the pointer changes to an edge cursor.
3.
Click and drag the column width to decrease or increase the size.
7.1.3.2.2 To adjust column position
You can move a single column horizontally on the report canvas or multiple columns simultaneously.
1.
Click a column you want to move.
Smart guideline grids appear.
2.
Click the column handles on top of the report canvas and drag the column:
• To move a single column, drag the column to the left or right. Smart guidelines will adjust the
existing columns to accommodate the re-positioned column.
• To move multiple columns, use a single column to push the existing columns over, or use the
left side edge to drag a row of columns.
7.1.3.2.3 To swap columns using smart guidelines
1.
Double-click the column you want to swap to select it.
Smart guideline grids appear.
2.
Select the column handles on the top of the report canvas and drag the column to overlap the column
you want to swap and click to place the column.
2011-05-0687
Report Layout and Formatting

The column positions are swapped.
7.1.3.3 To create subcolumns using smart guidelines
You can create a subcolumn by using a spanning header element such as a box or text element that
spans two or more columns.
1.
Double-click a column you want to become a subcolumn.
Smart guideline grids appear.
2.
Click Insert > Box or Insert > Text.
3.
Place the element on the report canvas in the report or group header and drag the element frame
to span the two or more columns that you want joined.
The spanning header element becomes a single column containing subcolumns.
The subcolumns can be rearranged as a single column using the handles for the spanning header
column.
7.1.4 Hiding report sections
Crystal Reports has several properties that you can set to hide or suppress report sections.
7.1.4.1 Show on Drill Only
The "Show on Drill Only" property hides a section whenever you run the report. For example, in a
summary report, the "Show on Drill Only" property can be used to display only the summaries, but not
the details behind the summaries. When the "Show on Drill Only" property is applied to a section, it
becomes visible when the Drill-down cursor is used to drill down on the section contents. This property
is absolute; it cannot be conditionally applied using a formula.
7.1.4.2 Hide
2011-05-0688
Report Layout and Formatting

The "Hide" property also hides a section when you run the report. Unlike the "Show on Drill Only"
property, however, you cannot apply the "Hide" property, then drill down to reveal the section contents.
This property can be applied absolutely, or conditionally using a formula. This is useful for writing form
letters. For example, in a form letter, you might create two Body sections: one to hide when sales are
equal to or over $X and one to hide when sales are under $X.
7.1.5 Hiding report objects
Crystal Reports has several formatting properties for hiding individual objects.
7.1.5.1 Hide If Duplicated
The "Hide If Duplicated" property prevents an object value from printing if it is a duplicate of the value
that comes immediately before it in the same section.
The value does not print, but the space in which it would have printed remains.
Note:
This property does not work for text elements that contain embedded elements.
7.1.5.2 Hide If Zero
The "Hide If Zero" property prevents a value from printing if it is a zero value. The value does not print,
but the space in which it would have printed remains. To remove the blank space, the section must
have "Hide If Blank" set.
Note:
This will only work if there are no other elements in the section.
7.1.5.3 Hide
The "Hide" property hides an object when you run the report. For example, it is common to apply this
property to formulas that are needed to do some report calculations, but that you do not want to print
when you run the report. When you select this property, the selected element does not print.
2011-05-0689
Report Layout and Formatting

7.1.6 Creating a section underlay
You may want to create a section underlay to add an image of a pre-printed form to a report, or to add
a watermark to a report.
To create the underlay, you first add a picture or watermark to your report and then you reset the
formatting so that the element underlays the report data.
7.1.6.1 To insert a picture onto the report
1.
Click Insert > Picture.
2.
Select an image file, and then place it in the "Page Header" section, to the right of the objects in the
report body.
Note:
The picture is placed to the right of the objects to avoid underlaying the text. When you are working
with a watermark (a subdued picture designed to be nearly invisible) place it directly above the text.
7.1.6.2 To make the picture underlay the following section
1.
Right-click in the "Page Header" area of the report canvas and click Format Section.
2.
Click Underlay Following Sections.
When you preview your report, you will see that the picture prints in both the first "Group Header"
and the following few "Body" sections, next to (instead of above) the text in the body of the report.
Note:
Using the technique of placing a picture to the right of the body of the report, you can set up a chart
or an employee picture to print beside the details pertaining to that chart or employee.
3.
In the Crystal Reports"Structure" mode, resize the picture vertically to make it two or three times
larger, then preview the report again.
The image file now underlays more sections.
The area in which the picture underlays depends on the following conditions:
• The size of the picture.
• The section in which the picture was originally placed.
2011-05-0690
Report Layout and Formatting

• The position of the picture in the section.
By modifying size and placement of an element, you can create a variety of visual effects, using the
underlay feature.
7.1.7 Using pre-printed forms
You can use the section underlay feature to create a Crystal Reports report that merges an image of
a pre-printed form with your report data as a single, merged unit.
7.1.7.1 To create a report that includes a pre-printed form.
1.
Scan a form.
2.
Place it in the report as a bitmap.
3.
Use the underlay feature to line up the bitmap and report data.
7.1.8 Preventing the truncation of text inside an element
Whether you accept the default widths of text-based elements or you resize them, a problem could
arise if the text inside the element prints right to the edge of the element frame. While the report may
look fine on the machine it was designed on, when the report is printed using another printer driver that
measures the font wider, the length of the text grows, but the element frame remains fixed. The resulting
text is cut-off or truncated.
7.1.8.1 To prevent the truncation of text inside an element
1.
Right-click the text element that you want to format and select Format Text.
2.
In the Format dialog box, click the "General" node.
3.
Select Can Grow.
The element is now formatted to print on multiple lines. If the text prints wider than the element, the
text wraps onto additional lines.
2011-05-0691
Report Layout and Formatting

7.1.9 Hiding blank lines in embedded objects
Because you can embed objects in text elements, you might encounter cases where an empty object
causes a blank line in a text element. You can hide blank instances of such embedded objects.
Note:
The hiding of embedded objects blank lines is designed to remove blank lines within a text element if
the text element contains an entirely blank object alone on a line followed by a carriage return.
7.1.9.1 To hide blank lines in embedded objects
1.
In the "Structure" mode, right-click the desired text element and click Format Text.
2.
In the Format dialog box, select General and then select Hide Blank Lines Caused By Empty
Objects.
Now, when the report prints, unwanted blank lines will no longer appear in place of empty embedded
objects. You can confirm your changes in the "Page" mode.
7.1.10 Placing multi-line, text-based elements
While text-based elements that are formatted to print on multiple lines follow the same design rules as
other elements, they have one additional characteristic to be considered. If the printer driver expands
or contracts the spacing of the text, word wrapping may differ, changing the number of lines necessary
to print the element in order to accommodate growth or shrinkage.
When placing multi-line text-based elements, you could encounter problems if other elements in the
same section are placed directly below them.
Unlike single-line text-based elements, expanding the element frame of a multi-line text-based element
to accommodate growth is not a viable option. When you do this, the line width increases according to
the expanded boundaries.
So, when possible, place multi-line text-based elements at the bottom of a section. If they require more
lines to print, the section expands downward to accommodate the growth, so that the expanded elements
do not overwrite other elements.
2011-05-0692
Report Layout and Formatting

7.1.11 Indenting lines
Using Crystal Reports, you can control line indentation for memo objects, string objects, and text
elements.
Note:
Only indentation values within the range of the object or text element width are accepted. An error
message appears on the bottom of the view when you enter an incorrect value.
7.1.11.1 To indent lines for a data element
1.
Right-click the element to be formatted and click Format Result Object Element.
2.
In the Format dialog box, select Paragraph.
3.
Set your preferred indent options.
7.1.11.2 To indent lines for a text element
1.
Right-click the text element to be formatted and click Format Text.
2.
In the Format dialog box, select Paragraph.
3.
Set your preferred indent options.
7.1.12 Allowing for overflow object representation
Crystal Reports lets you use overflow object representation to assist users who are working with numeric
or currency values in report cells. When the "Allow Object Clipping" option is not selected,
numeric/currency object values that exceed the object size are represented by number signs (######)
when you preview the report, letting you know immediately when the object is too small.
Otherwise, if a numeric or currency value is larger than the object containing it, that value is truncated,
or "clipped." For example, values like 100,000,000 might appear on the report as 1,000, or as 000
(depending on the properties you have set). This could potentially cause confusion when the report is
read.
2011-05-0693
Report Layout and Formatting

7.1.12.1 To allow for overflow object representation
1.
Right-click the currency object or number object that you want to format and click Format Result
Object Element.
2.
In the Format dialog box, expand "Format" and then select Number.
3.
Ensure that Allow Object Clipping is not selected.
7.1.13 Selecting multiple elements
You can select multiple elements, including text, object, chart, bitmap, and cross-tab elements, to format
them together.
Once you have selected multiple elements, you can move, align, size, and delete them as a group. You
can also change any common properties for these elements and have the changes apply to all elements.
Elements are moved, aligned, and sized based on a main element, which is the last element you select.
7.1.13.1 To select multiple elements
1.
Click an element and Shift + click or Ctrl + click the other elements you want to select.
2.
Right-click the main element and click Format Elements.
3.
In the Format dialog box, set your new formatting options.
7.1.14 Understanding text rotation
In the Format dialog box, you can use the text rotation properties to rotate text so that it reads vertically.
When you select a text rotation of 90 degrees, the text shifts 90 degrees in a counter-clockwise direction.
When you select a text rotation of 270 degrees, the text shifts 270 degrees in a counter-clockwise
direction.
2011-05-0694
Report Layout and Formatting

Note:
• If text rotation is left at 0 degrees, your text is oriented horizontally, left to right.
• Rotated text that spans over the edge of the page cannot be displayed as part of your report.
• Rotated text cannot be rendered by the DHTML viewers, so be sure to preview your report in the
desired viewer before you deploy it.
7.1.14.1 To rotate text
1.
Right-click the element that you want to rotate and click Format <element>.
<element> is the name of the element. For example, "Format Result Object Element", "Format
Text", and so on.
2.
In the Format dialog box, select Font.
3.
Change the "Rotation" to either 90 degrees or 270 degrees.
7.1.15 Modifying line spacing
With Crystal Reports, you can specify the amount of space between lines for memo objects, string
objects, and text-based elements.
7.1.15.1 To modify line spacing
1.
Right-click the object or element that you want to format and select Format <element>.
<element> is the name of the element. For example, "Format Result Object Element", "Format
Text", and so on.
2.
In the Format dialog box, select Paragraph.
3.
Enter a number for the "Spacing" value.
• If you chose "Multiple", the number you enter is multiplied by the font size of your text, and the
program inserts the result as line spacing.
• If you chose "Exact", the number you enter is the exact number of points that the program inserts
for line spacing.
2011-05-0695
Report Layout and Formatting

7.1.16 Setting page size and page orientation
Crystal Reports allows you to view and print your reports in a variety of page sizes using either portrait
or landscape orientation.
7.1.16.1 To set page size and page orientation
1.
Click File > Page Setup.
The "Page Setup" dialog box appears.
2.
Use the "Paper Size" menu to select a page size.
3.
Use the "Orientation" options to set the page orientation.
4.
Click OK.
7.1.17 Setting page margins
Crystal Reports allows you to change page margins to meet your specifications.
7.1.17.1 To set page margins
1.
Click File > Page Setup.
The "Page Setup" dialog box appears.
2.
Set the page "Margins" to fit your needs.
3.
Click OK.
Note:
• All margins are calculated from the paper edge. Thus, a left margin of .25 inches causes the printing
to start exactly one quarter inch in from the edge of the paper.
• Select Adjust Margins Automatically if you want Crystal Reports to adjust the report's margins
automatically the next time you change the page size. If you choose a new page size that is large
enough for the current printable area, Crystal Reports increases or decreases the margins by
enlarging or reducing the left/right and top/bottom margins by the same factor. If you choose a new
2011-05-0696
Report Layout and Formatting

page size that is smaller than the current printable area, Crystal Reports fills the entire page by
reducing the margins to 0. If you next choose a bigger page, this (reduced) printable area is kept
and the left/right, top/bottom margin ratios become 1:1.
• Page margins can also be controlled by use of conditional formulas.
Related Topics
• Changing margins conditionally
7.1.18 Setting custom page size
If you are designing a report for the web, you may want to set a page size that does not correspond
with standard printing paper sizes. Crystal Reports allows you to set a custom page size using the
"Page Setup" dialog box.
7.1.18.1 To set custom page size
1.
Click File > Page Setup.
The "Page Setup" dialog box appears.
2.
On the "Paper Size" menu, click Custom.
3.
Adjust the width and height of the page by entering new values in the appropriate text boxes.
4.
Click OK.
7.1.19 Using TrueType fonts
Designing your report with printer-specific fonts can lead to problems when using different printers. The
fonts may not be supported by other printers or they may not be installed on the printers.
During the printing process, if you encounter printer-specific fonts that are unrecognizable to the printer
driver, Crystal Reports substitutes the fonts, creating inconsistent results. To avoid this situation, only
common TrueType fonts should be used when designing reports.
2011-05-0697
Report Layout and Formatting

7.1.20 Using date formats on a Japanese system
There are many date formats you can choose to use on an English report, but if you send the report to
a Japanese system, there may be some formatting irregularities. Not all English date formats are
viewable on a Japanese system, and the same is true going from Japanese to English. For instance,
abbreviated English months do not appear on a Japanese system and Japanese eras in short format
do not appear on an English system.
7.2 Formatting properties
You can set formatting properties in Crystal Reports. In most cases, you can set one of two types of
properties:
• Absolute (always apply the property).
• Conditional (apply the property only if certain criteria are met).
Related Topics
• Working with absolute formatting
• Working with conditional formatting
7.2.1 Working with absolute formatting
Absolute formatting is formatting that applies under any condition. This type of formatting property
always follows a "select, then apply" procedure. For example, you select what it is that you want to
format (object or section), then you apply the formatting to the selection using property settings.
7.2.1.1 Adding borders, color, and shading to an object
Crystal Reports allows you to add borders, color, and shading to objects on your report in order to
emphasize important data and create professional-looking reports.
2011-05-0698
Report Layout and Formatting

7.2.1.1.1 To add borders, color, and shading to an object
1.
Right-click the object or element that you want to format and click Format <element>.
2.
In the Format dialog box, click Appearance.
3.
Set the desired appearance values.
For example, to add a border around an object, go to the "Border" section and set the properties for
top, bottom, right, and left.
7.2.1.2 Adding and editing lines
Crystal Reports allows you to add lines to a report to emphasize important data and create
professional-looking reports. Lines can run horizontally or vertically. For a vertical line to be broken
across several pages, the report section that the line ends in must not be on the same page that it starts
on. For example, if a line runs from a group header to the corresponding group footer, the line continues
on the top of each subsequent page—just below the page header—until the group footer is encountered.
7.2.1.2.1 To add lines to a report
1.
Click Insert > Line.
2.
Use the cursor to draw the line where you want it to appear.
Note:
You cannot draw diagonal lines.
7.2.1.2.2 To edit lines on a report
1.
Right-click the line that you want to format and click Format Line.
2.
In the Format dialog box, change the "General" or "Appearance" options for the line.
3.
When you are finished, click Close.
7.2.1.3 Adding and editing boxes
Crystal Reports allows you to add boxes to a report to emphasize important data and create
professional-looking reports.
7.2.1.3.1 To add boxes to a report
1.
Click Insert > Box.
2.
Use the cursor to place the box where you want it to appear.
2011-05-0699
Report Layout and Formatting

7.2.1.3.2 To edit boxes on a report
1.
Right-click the box that you want to format and click Format Box.
2.
In the Format dialog box, change the "General" or "Appearance" options for the box.
3.
When you are finished, click Close.
7.2.1.4 Adding shapes to a report
When designing report formats in Crystal Reports, you can insert a variety of shapes such as circles,
ellipses, and boxes with rounded corners, as part of your report. This is especially useful for formatting
reports in languages that require these shapes to effectively communicate.
7.2.1.4.1 To add shapes to a report
1.
Add a box to your report.
For more information, see Adding and editing boxes.
2.
Right-click the box that you want to format and click Format Line.
3.
Click the "Appearance" node.
4.
Set "Corner Rounding" to a number between 0 and 100.
The box that you started with gradually changes to an ellipse or circle, depending on how large a
number you enter.
Note:
If you have specified rounding for a box, you cannot use the Drop Shadow property. If you select
this property, Crystal Reports resets Corner Rounding to 0.
7.2.1.5 Using conventional accounting formats
As a way of supporting the conventions used in the accounting profession, Crystal Reports lets you
decide on how to display the currency symbol, negative values, and zero values on your financial
reports. You can also set up your report to reverse the signs for credit and debit amounts.
7.2.1.5.1 To use accounting conventions in a report
1.
Right-click the currency object or number object that you want to format and click Format Result
Object Element.
The Format dialog box appears.
2.
Expand the "Format" node.
2011-05-06100
Report Layout and Formatting

3.
Click "Number" node, and select how you want the number format to appear for either positive or
negative values from the "Show Zero Values As" list.
4.
Click on the "Currency" node, specify how you want the currency symbol to appear with the values
on your report.
7.2.1.5.2 To customize the accounting conventions for a report
1.
Right-click the currency object or number object that you want to format and click Format Result
Object Element
2.
Expand the "Format" node. go to the Number Format properties, and select Customize from the
Numeric Format list.
3.
Use the Numeric Format dialog box to set your custom accounting conventions:
Note:
Select the Reverse Sign for Display check box to reverse the signs for debit and credit amounts in
your financial reports.
4.
Click OK to save your changes.
7.2.1.6 Repeating report elements on horizontal pages
Some report elements, such as cross-tabs, can expand horizontally over a number of pages. Crystal
Reports lets you designate other report elements that don't expand horizontally, such as text elements,
date elements, charts, lines, boxes, and so on, to be repeated on each additional horizontal page that
the cross-tab creates. For example, if your report's page footer includes an image, a data element, and
a page number, you can use the Format dialog box to make Crystal Reports repeat these elements on
each horizontal page.
7.2.1.6.1 To repeat elements on horizontal pages
1.
Right-click the element you want to repeat and click Format <element>.
The Format dialog box appears.
2.
On the "General" node, select Repeat on Horizontal Pages.
If a cross-tab makes your report expand horizontally, the element you formatted is repeated on each
horizontal page.
Note:
• The repeated copies of a report object cannot be moved; you must move the original element to
move the copies.
• You can format any copy of a repeated report element, but changes you make are applied to all
copies.
To learn how to use page numbers on horizontal pages, see Numbering horizontal pages.
2011-05-06101
Report Layout and Formatting

7.2.1.6.2 Numbering horizontal pages
A "Predefined Object" called Horizontal Page Number lets you number horizontal pages.
To number horizontal pages
1.
On the "Data Explorer", expand Predefined Objects.
2.
Select Horizontal Page Number from the list and insert it in your report.
7.2.1.7 Using white space between rows
The height of a section in relation to the elements within it affects the amount of white space that appears
between rows on the report.
The "Page" mode lets you add and delete white space by using the Resizing cursor to resize the area.
7.2.1.7.1 Adding white space by resizing
To add extra white space between rows in the report, move the pointer over the lower section boundary
line. The pointer changes to a Resizing cursor. Pull the boundary line downward to add space.
7.2.1.7.2 Deleting white space by resizing
To delete unnecessary white space within a section, move the pointer over the lower section boundary
line. The pointer changes to a Resizing cursor. Pull the boundary line upward to delete space.
7.2.1.7.3 Deleting white space by hiding a section
If an entire section is blank (for example, if you are not putting anything into the Page Footer section
of the report), you can eliminate the unnecessary white space that the Page Footer would occupy by
hiding the section in the Format dialog box.
To delete white space by hiding a section
1.
Right-click the report section that you want to suppress, and click Format <section>.
2.
In the Format dialog box, select Hide.
The blank section will no longer be printed.
7.2.2 Working with conditional formatting
2011-05-06102
Report Layout and Formatting
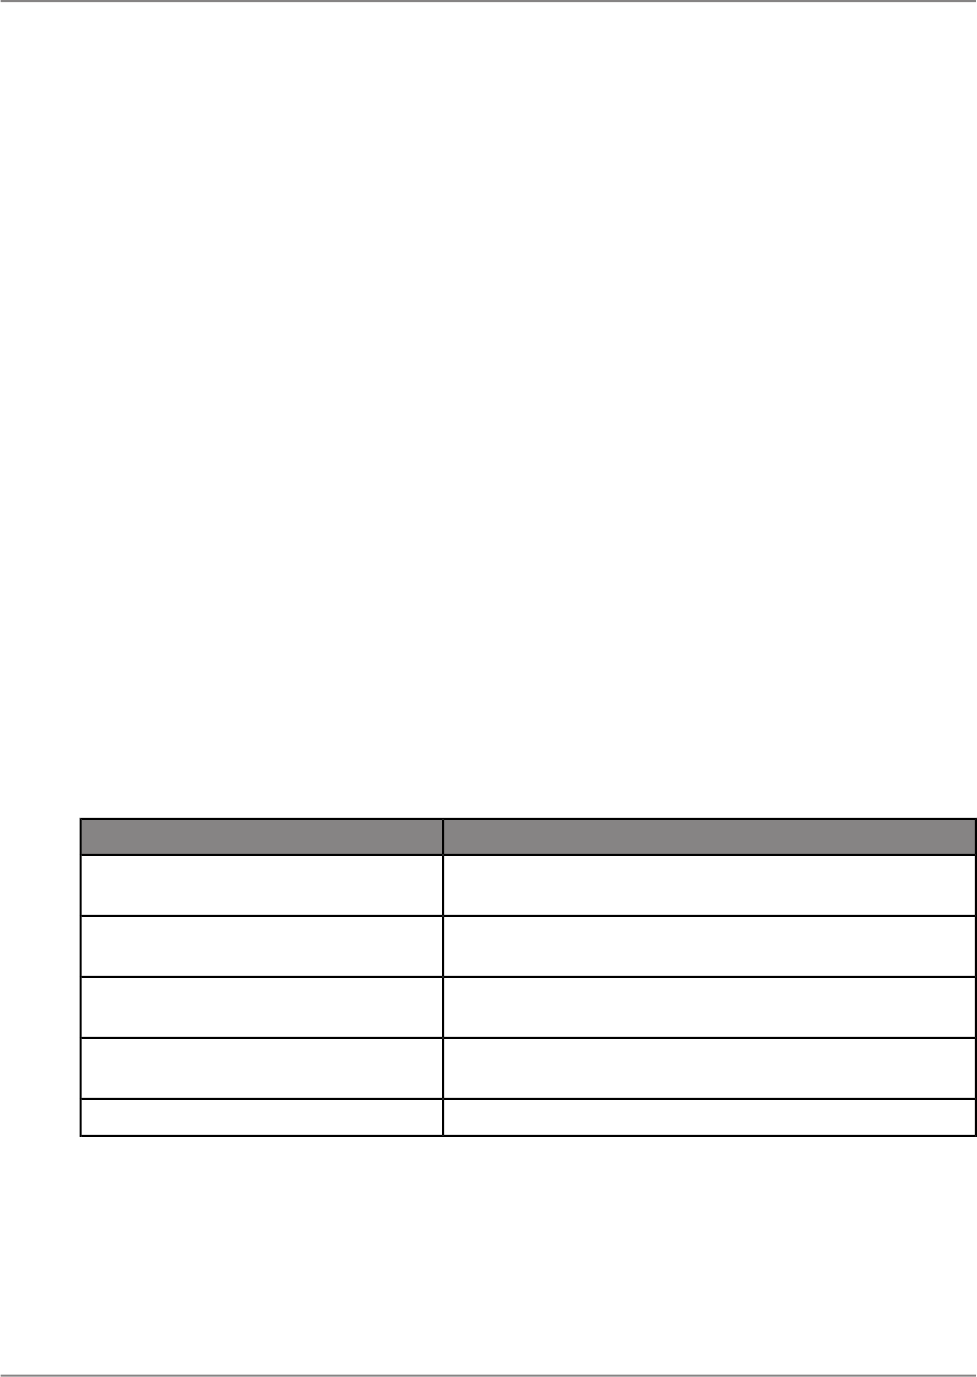
Conditional formatting is formatting that applies only under certain conditions. For example, in a report
you may want any of these formats when certain conditions are met:
• Customer balances are printed in red, if they are past due.
• Dates appear in the Day, Month, Year format, if the customer is Canadian.
• A background color appears, if the line number is odd.
Crystal Reports makes it easy to apply conditional formatting in these and many other situations.
With absolute formatting, you follow the "select, then apply" procedure. For conditional formatting, you
follow the same general procedure, but you go a step further and set up conditions that determine
whether or not the formatting will be applied. You specify these conditions using simple formulas. When
a conditional formatting formula is set up, the formula overrides any fixed settings you have made in
the Format dialog box. For example, if you select the Hide property, then set up a conditional formula
for the Hide property, the property will still apply only if the condition in the formula is met.
Crystal Reports enables you to set both on and off properties and set attribute properties conditionally.
However, each of these requires a different kind of formula.
7.2.2.1 About conditional operators and values
When you format a result object or element conditionally, an operator and value must be selected to
define the condition.
The following table lists the available operators:
DescriptionOperator
The condition includes items that include/exclude the speci-
fied value.
Equal to/Not equal to
The condition includes items whose value is less than/less
than or the same as the specified value.
Less than/Less than or equal to
The condition includes items whose value is greater
than/greater than or the same as the specified value.
Greater than/Greater than or equal to
The condition includes items whose value is included/not
included in a specified list of items.
In List/Not in List
The condition includes items whose value is Null/Not Null.Is Null/Is Not Null
2011-05-06103
Report Layout and Formatting
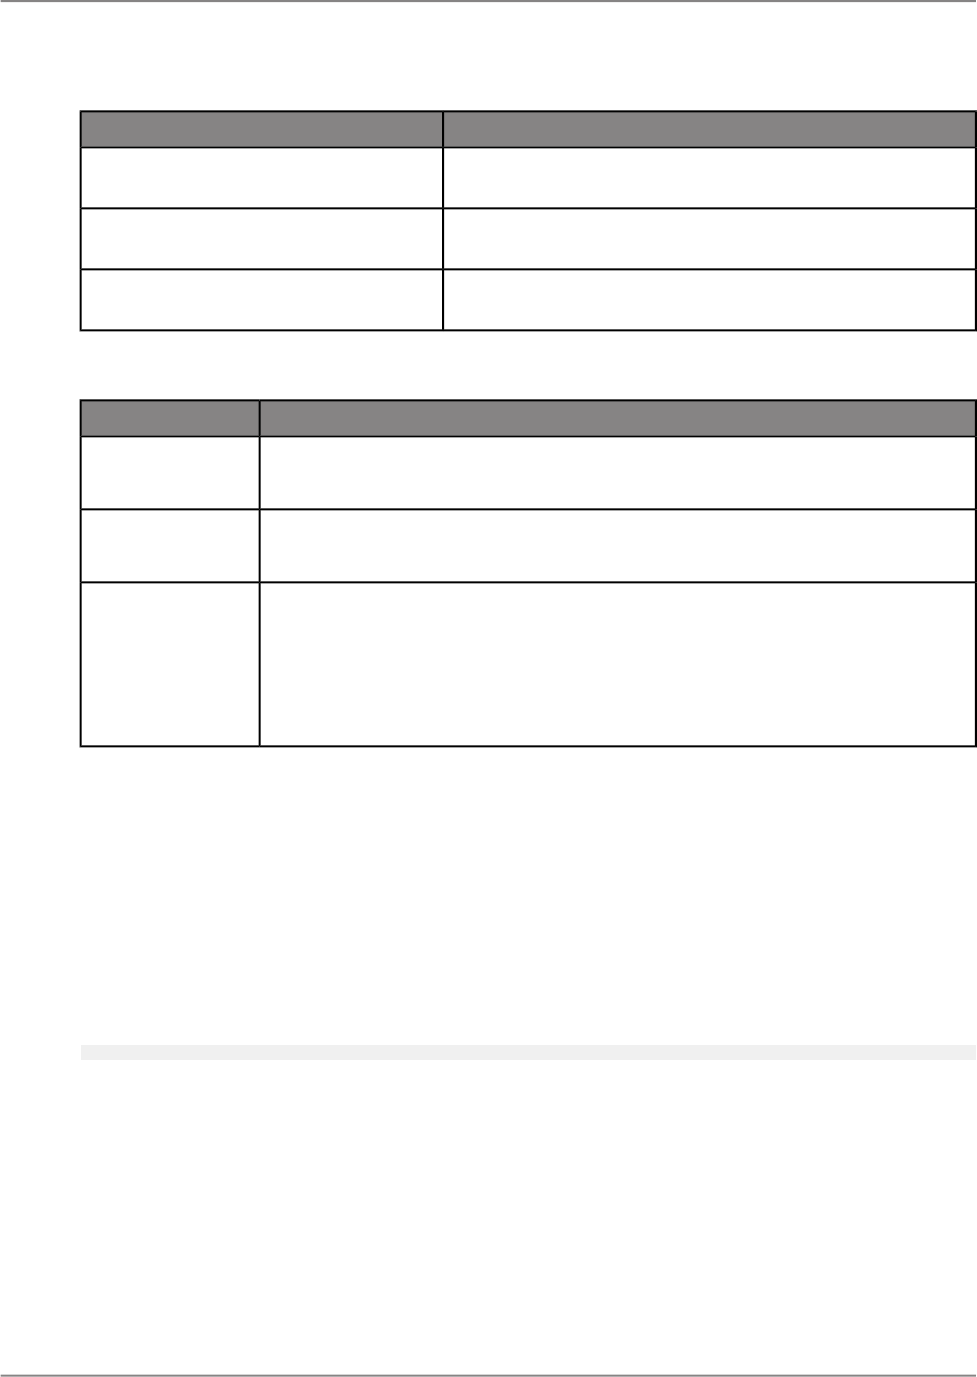
DescriptionOperator
The condition includes items that include/exclude the speci-
fied word or letter.
Starts with/Does not start with (non-nu-
meric objects only)
The condition includes items that include/exclude the speci-
fied word or letter.
Contains/Does not contain (non-numeric
objects only)
The condition includes items whose value falls between/not
between the specified word or letter.
Between/Not between
The following table lists the available values and steps to apply them:
ProcedureOption
• Select a value from the list or click New Parameter to open the "Create Pa-
rameter" dialog box to create a new parameter.
"<Enter a Value>"
• Select a value from the list or click New Parameter to open the "Create Pa-
rameter" dialog box to create a new parameter.
"<Choose Value>"
From the "Between Values" dialog box, select one of the following:
• Click the Minimum list and select a minimum parameter from the list or click
New Parameter to create a new parameter.
• Click the Maximum list and select a maximum parameter from the list or click
New Parameter to create a new parameter.
"<Choose
Min/Max>"
7.2.2.2 Understanding conditional on or off properties
A conditional "on" or "off" property tests to see if a condition has been met. It is on if the condition is
met, off if the condition is not met. Use Boolean formulas for this kind of formatting.
Crystal syntax example
{Customer.Country} = "Canada"
7.2.2.3 Understanding conditional attribute properties
A conditional attribute property tests to see which of two or more conditions is met. The program then
applies the formatting appropriate to the condition. For example, assume that you want values under
2011-05-06104
Report Layout and Formatting

quota printed in red and all other values printed in black. The program tests to see whether the value
is under quota or not. If it is under quota, then it applies the red attribute; if it is not, then it applies the
black attribute.
Use an If-Then-Else formula for this kind of conditional formatting.
Crystal syntax example
If {CUSTOMER.LAST_YEARS_SALES} > 5000 Then
crRed
Else
crBlack
When you create formulas for conditional attribute properties, Crystal Reports shows you a selection
of attributes in the formula comments area within the Formulas view. You can use any of these attributes
in your formula. For example, if you are setting a background color conditionally, the selection contains
attributes for each color that you can use. If you are setting borders conditionally, the selection contains
attributes such as crSingleLine, crDoubleLine, crDashedLine, crDottedLine, and crNoLine.
Note:
Always include the Else keyword in conditional formulas; otherwise, values that don't meet the If condition
may not retain their original format. To retain the original format of values that don't meet your If condition,
use the DefaultAttribute function. The DefaultAttribute function returns the value of the formatting
property set in the "Properties" dialog box.
Crystal syntax example
If {CUSTOMER.LAST_YEARS_SALES} > 5000 Then
crRed
Else
DefaultAttribute
You can take this kind of property one step further. You can specify a list of conditions and a property
for each; you are not limited to two conditions. For example, if you have a number object on your report
that contains sales figures from countries around the world, you can specify the number attribute(s)
that you want to apply to each country. In this case, your conditions would specify that if it is from
Country A, the program should apply the Country A attribute; if it is from Country B, the Country B
attribute; if it is from Country C, the Country C attribute, and so on.
With more than two alternatives, use this kind of formula:
Crystal syntax example
If {CUSTOMER.Country} = "Canada" Then
crRed
Else If {CUSTOMER.Country} = "England" Then
crBlack
Else If {CUSTOMER.Country} = "Australia" Then
crGreen
Else
crBlue
Use a multi-condition If-Then-Else formula for this kind of conditional formatting.
7.2.2.4 Changing fonts conditionally
2011-05-06105
Report Layout and Formatting

For memo or string objects that are based on conditions such as a parameter value, you can conditionally
change the font, font style, size, and color.
7.2.2.4.1 To change fonts conditionally
1.
Right-click the element you want to format and click Conditional Formatting.
The Formatting dialog box appears.
2.
In the Formatting dialog box, click Add Condition.
3.
On the "Condition" pane, select a result object in the object list.
4.
Select an operator for the result object in the operator list.
5.
Select a value in the value list.
6.
On the Formatting Settings pane, select one or more font properties to be applied when a condition
is true.
7.
Add values for each font property.
8.
Click OK to apply conditions.
7.2.2.5 Changing margins conditionally
Page margins can be controlled conditionally by use of formula.
Margins based on page number
The following formula checks whether a page number is even or odd and sets the margins accordingly:
if the page is an even number, the margin is set to one inch; if the page is an odd number, the margin
is set to two inches.
If Remainder(pagenumber,2) = 0 then 1440 else 2880
Margins based on page orientation
The following formula checks for page orientation and sets the margins accordingly: if the orientation
is portrait, the margin is set to one inch; if the orientation is landscape, the margin is set to two inches.
If CurrentPageOrientation = crPortrait then 1440 else 2880
Note:
Margin position is measured in twips; there are 1440 twips in an inch.
7.2.2.5.1 To change margins conditionally
1.
Click File > Page Setup.
The "Page Setup" dialog box appears.
2.
Click the Conditional Formula button next to the margin you wish to change.
3.
In the Formula Workshop, enter your conditional margin formula.
2011-05-06106
Report Layout and Formatting

4.
Click Save and close to return to the "Page Setup" dialog box.
5.
Click OK.
7.2.2.6 Creating footers after the first page
You may choose to print a page footer on all pages except the first page. You can do this by formatting
the "Page Footer" section conditionally, using an on or off property.
7.2.2.6.1 To create footers after the first page
1.
Place the object you want displayed as a page footer in the "Page Footer" section of the report.
2.
Right-click the "Page Footer" section, and click Format Section.
The Format dialog box appears.
3.
Select Hide.
4.
Click the Formula Workshop button next to the "Hide" option.
The "Formula Workshop" appears, and the name of your new formula is shown.
5.
Enter the following formula in the "Formula Workshop":
Crystal syntax example:
PageNumber = 1
This formula suppresses the page footer on the first page, but not on any of the other pages.
6.
Click Save and close.
7.
Click the Page mode to see the change in your report.
Note:
• If you have a multi-line page footer and have inserted the lines into separate "Page Footer" sections,
you will need to suppress each section conditionally, using the formula above.
• To create a page header that appears on all pages but the first, place the header information in the
"Page Header" section and then suppress that section conditionally, using the same formula that
was used for suppressing the "Page Footer" section.
Related Topics
• Formulas
7.2.2.7 Changing X position conditionally
2011-05-06107
Report Layout and Formatting

You can change the X position (that is, the horizontal position from the left margin) for an object based
on a condition. You might do this when you want elements to appear in different columns when their
values meet a certain condition; for example, orders that shipped on time appear in the first column,
while orders that shipped late appear in a second column.
Note:
You cannot conditionally change the X position of line or box elements.
7.2.2.8 Changing element width conditionally
You can change the width of an element based on a condition.
Note:
You cannot conditionally change the width of line or box elements.
7.2.2.8.1 To conditionally change the width of an element
1.
Right-click the element that you want to conditionally change the width of, and click Format
<element>.
2.
In the Format dialog box, expand the "General" node.
3.
Click the Conditional Formula button next to the width element.
The "Formula Workshop" appears.
4.
In the "Formula Workshop", enter your conditional width formula text.
5.
Click Save and close.
6.
Close the Format dialog box to save your width setting.
Crystal Reports resizes elements that meet your condition to a new width, but shows those elements
that do not meet the condition in their original size.
7.2.2.9 Creating a conditional picture
You can add conditions to a single picture or multiple pictures on your report using the "Conditional
Picture Expert" dialog box. The conditional pictures are inserted on your report in a single picture object.
For each picture you add to the "Conditional Picture Expert", you will enter a condition that will determine
how the picture is applied to the report.
7.2.2.9.1 To add a conditional picture
Before you create a conditional picture, you must insert a picture on to your report. For each picture
you add, you will select an operator and a value to apply to condition to the picture. The type of operator
2011-05-06108
Report Layout and Formatting

(for example, equal, not equal, between, not between, and greater) affects the value and selection types
available for the picture.
1.
Right-click the picture element on your report and click Conditional Picture Expert.
The "Conditional Picture Expert" dialog box appears.
2.
Click Add Pictures.
The "Open" dialog box appears.
3.
Select the picture files you want to add to the report and click Open.
The "Conditional Picture Expert" dialog box appears with a list of the selected picture files.
4.
From the "Choose an Object" list, select a result object for each picture.
Tip:
You can also type the result object title in the text box. As you type the result object title, the list
automatically filters the list of result objects.
5.
In the Operators box, select one of the following operators for the picture.
Depending on the operator you select, the value box displays Enter a Value, Choose Values, or
Choose Min/Max Values.
6.
From the Value box, set a value for the condition.
7.
Repeat these step to add conditions to each picture. When you are finished applying conditions to
each picture, click OK.
The conditions are applied to the picture(s).
7.3 Using the Format Painter
Use the Format Painter to copy common absolute and conditional formatting properties from one report
element to one or more target elements. The Format Painter option is available when you right-click a
source element in your report and choose Format Painter from the context menu. If you apply formatting
to a target object that is not the same as your source object, only the common properties are applied.
For example, if your source object is a Boolean object and your target object is a currency object, only
the common font and border properties are changed; Boolean properties are not applied and currency
properties are not set.
Note:
• The Format Painter does not copy hyperlink information to a target element or object.
• When using a "Date and Time" object as your source, a target object's date or time properties are
changed; the reverse is also true (that is, a Date object or a Time object used as your source also
affects the date and time properties of a "Date and Time" object).
2011-05-06109
Report Layout and Formatting

7.3.1 To copy and apply formatting
1.
Select a source element or object in your report, right-click it, and choose Format Painter.
Note:
Press ESC to exit the Format Painter.
2.
Click the target element or object you want to apply formatting to.
When you move your mouse over your report, the cursor changes to a Stop cursor if the element
or object cannot be used as a target.
Note:
Hold the ALT key down if you want to apply formatting to more than one element or object.
7.4 Multiple Section Reports
This section introduces the various types of sophisticated reports you can create using the multiple
section reporting capabilities in Crystal Reports. Multiple sections help you control overlapping elements.
You can create reports that display values based on conditions you apply to each section. For example,
you can create form letters that display information based on conditions.
7.4.1 About sections
Each of the following report areas contains a single section when you create a new report:
• "Report Header"
• " Page Header"
• " Body"
• "Report Footer"
• "Page Footer"
You can add other sections in addition to the original section. Once you have added sections, you can
delete them, or move them in relation to other sections within the area. However, each area must contain
at least one section, which cannot be deleted. If you do not want to display the final section in an area,
you can hide it.
2011-05-06110
Report Layout and Formatting

7.4.2 Working with sections
Sections can be inserted, deleted, moved, resized, and so on.
7.4.2.1 To insert a section
It is easier to add sections when you are working in "Structure" mode than in "Page" mode.
1.
On the "Insert" tab, click Section.
2.
Point to the area of the report canvas that you want to add a new section to, and then click to add
the section.
A new section is added to the report.
7.4.2.2 To delete a section
• Right-click the section you want to delete, and then click Delete.
Note:
Each area must contain at least one section. You can hide the final section in an area if you do not
want to display it.
The section is removed from the report.
7.4.2.3 To move a section
1.
Click the section that you want to move.
2.
Click the section tab, and drag it to a new location.
Note:
You can only move a section up or down within an area.
2011-05-06111
Report Layout and Formatting

7.4.2.4 To resize a section
1.
Click on the section that you want to resize.
2.
Move the cursor over the bottom boundary of the section.
The cursor changes into a resizing cursor
3.
Drag the boundary to make the section bigger or smaller.
7.4.3 Using multiple sections in reports
Reporting tasks, such as keeping variable-length elements from overwriting each other or eliminating
blank lines, are performed more efficiently by creating multiple sections within an area.
7.4.3.1 Keeping variable-length elements from overwriting each other
When a variable-length element, such as a subreport, has the "Can Grow" option set and the element
is placed above another element in one section of the report, the variable-length element may overprint
elements positioned directly below it.
You can avoid this problem by creating multiple sections in an area and placing elements below the
variable-length element in their own sections.
7.4.3.2 Eliminating blank lines when objects are empty
It is very common to have two address lines in a customer folder, one for street address (Address 1),
and one that can be used for a suite number or mail stop (Address 2). Address 1 usually contains a
value, but Address 2 is often blank. If you create a customer list using this data and stack the objects
on top of one another in mailing label format, those customer records with an empty Address 2 object
will print with a blank line. You can eliminate this blank line by using multiple sections.
7.4.3.2.1 To eliminate blank lines by using multiple sections
1.
Create two new "Body" sections so that you have a total of three sections in the "Body" area.
2011-05-06112
Report Layout and Formatting

2.
Place the Address 2 object in the middle section and the other result objects in the sections above
and below it as you want them to appear in the report.
3.
In the "Body" area, right-click the second section, and then click Format Section.
4.
In the "General" area, select Hide if Blank.
When the report prints, if the Address 2 section is blank, the program will not print it as a blank line in
the report.
Related Topics
• To insert a section
7.4.3.3 Adding blank lines conditionally
You can use multiple sections to print a blank line on your report under specific conditions. For example,
you may want to insert a blank line after every fifth record in the report.
7.4.3.3.1 To add blank lines conditionally
1.
Create two "Body" sections in your report.
2.
Place the result objects for your report in the top section.
3.
Right-click the second section, and then click Format Section.
4.
Select Hide and then click the Conditional Formula button.
5.
Enter the following formula:
Remainder (RecordNumber,5) <> 0
This formula divides each record number by 5. If the division produces a remainder, it hides the
blank section for that record. However, if the division produces no remainder (which it will for every
fifth record printed), the program prints the second section, thus inserting a blank line.
Note:
To insert a blank line under different conditions, you can modify your formula appropriately.
Related Topics
• To insert a section
7.4.4 Form letters
2011-05-06113
Report Layout and Formatting

Form letters are often (but not necessarily) used in multi-section reports, they are often used in
multi-section reports to generate custom mailings. This section explains how to use multiple sections
to create form letters or multiple versions of the same form letter for custom mailings.
Form letters often use text elements to hold the content of the report.
7.4.4.1 Working with text elements
You will use text elements when creating form letters. Some things to know about text elements are as
follows:
• A text element can contain both text and result objects. Form letters often use both.
• You can resize text elements. In form letters, the text element is often resized so that it prints as a
letter.
7.4.4.2 Creating a form letter using a text element
You are going to use a text element to create a form letter. The form letter you create will be co-ordinated
with a result folder so that each letter will be customized with company information from a different
record.
If you have difficulty performing any of the steps, see Working with text elements.
7.4.4.2.1 To create a form letter
The letter will consist of a date, an inside address, a salutation, a one paragraph letter body, and a
closing section.
1.
Create a blank report that includes result objects found in a customer list report.
For example, Customer Name, Country, City, Region, Postal Code, Address 1, and so on.
2.
While in "Structure" mode, insert a text element into the Body section of the report.
3.
Drag the resizing handle on the right side of the element frame to the right edge of the report canvas.
This will make the element about eight inches wide, the approximate width of a page. You may have
to stop resizing, scroll the window, and resize some more to accomplish this.
7.4.4.2.2 To insert a date
You can insert a predefined object on your report that will print the current date on the letter.
1.
To insert a date element into the letter, expand the Predefined Objects area of the "Data Explorer"
side panel.
2011-05-06114
Report Layout and Formatting

2.
Drag Print Date into the text element, and type two spaces.
a. To change the date formatting, right-click the "Print Date" object and click Format Text.
The Format dialog box appears.
b. Select the appropriate date format.
Tip:
You might have to resize the "Body" section and the text element if you did not select the "Can Grow"
option for the text element.
7.4.4.2.3 To create an inside address
To create an inside address, you will drag result objects from the "Data Explorer" side panel into a text
element.
1.
Insert a text element in the "Body" section of your report.
2.
Drag the Address 1 object into the text element, and then type a space.
3.
Drag the City object, place it at the insertion point, and then type a comma followed by a space.
4.
Drag the Region object, place it at the insertion point, and then type two spaces.
5.
Drag the Postal Code object, place it at the insertion point, and then type two spaces.
Note:
When an object is placed within a text element, it is automatically trimmed on both the left and right
sides, so that it contains no extra white space.
7.4.4.2.4 To create a salutation
1.
Type four spaces.
2.
Type Dear, followed by a space.
3.
From the "Data Explorer" side panel, drag the <Contact Title> object into the text element, placing
it immediately after the space.
4.
Type a space.
5.
From the "Data Explorer" side panel, drag the <Contact Last Name> object into the text element,
placing it immediately after the space.
6.
Type a colon at the insertion point, followed by two spaces.
7.4.4.2.5 To create the letter body
1.
Type Your company and then type a comma followed by a space.
2.
From the "Data Explorer" side panel, drag the Customer Name object into the text element and place
it after the space.
3.
Type a comma, followed by a space.
4.
Type in your letter body, followed by two spaces.
For example: helped make this year an outstanding year for Xtreme Mountain Bikes, Inc. I want to
thank you and your staff for your support. I hope next year will be a banner year for you.
5.
Type Sincerely yours, followed by a comma and four spaces.
2011-05-06115
Report Layout and Formatting

6.
To complete the form letter, type your name.
You can view the final form letter in "Structure" mode.
7.4.4.3 Printing conditional messages in form letters
You may want to print conditional messages in form letters. For example, say your company may
charges a minimum order fee of $50 on orders less than $300, and provides free shipping for orders
over $500. You might create two conditional messages, one that encourages customers who spent
less than $300 to raise their purchase amount to avoid paying the minimum order fee, and another that
reminds customers who spent over $500 that they will continue to receive free shipping at that spending
level.
7.4.4.3.1 To create a conditional message
Create two form letters. For more information, see Creating a form letter using a text element.
1.
Insert a second "Body" section in the report.
For more information, see Working with sections.
2.
In the "Body" A section, place a letter that encourages customers to buy more to avoid paying the
minimum order fee.
3.
In the "Body" B section, place a letter that congratulates customers on saving on shipping costs.
4.
Right-click the "Body" A section, and then click Format Section.
The Format dialog box appears.
5.
Select Hide, and then click the "Conditional Formula" button ( ) adjacent to "Hide".
The "Formula Workshop" appears.
6.
Select Internet Sales Amount from the "Add Object" list.
7.
Type a condition.
For example: > 300.
8.
Click Save and Close.
When a customer spends less than the minimum order limit ($300), a letter will print that encourages
them to spend more to avoid paying extra fees.
9.
Right-click the "Body" B section, and then click Format Section.
The Format dialog box appears.
10.
Select Hide, and then click the "Conditional Formula" button ( ) adjacent to "Hide".
The "Formula Workshop" appears.
11.
Select Internet Sales Amount from the "Add Object" list.
12.
Type a condition.
For example: < 500.
2011-05-06116
Report Layout and Formatting

13.
Click Save and Close.
When a customer spends more than $500, a letter will print that congratulates them on saving on
shipping costs.
Note:
When a customer spends between $300 and $500, no form letter will be printed for that customer.
7.5 Semantic Error Messages
A semantic error is indicated in the Crystal Reports designer when an object is placed in a location that
is likely to result in incorrect information. This can occur most often in OLAP data sources where Crystal
Reports detects that a measure is not available in the data source for a particular context. For example,
a measure may not be calculated for a grouping context.
A semantic error is indicated by Crystal Reports when you attempt to place objects in such a context
to help you avoid creating reports that have misleading information in them.
7.5.1 {xxxx} may have multiple values in this group; only the first or last value will
be displayed.
Context
Using a level or attribute inside a group header or footer.
Reason
The object has multiple values within this context. For example, when referring to the Region level
within the Country group, Region refers to all the regions within the Country. In this case, only the first
or last region will be displayed.
If it is in a group header, only the first value is displayed. If it is in a group footer, only the last value is
displayed.
Resolution
Move the object out of the header or footer.
7.5.2 {xxxx} may have multiple values in the report header; only the first value will
be displayed.
2011-05-06117
Report Layout and Formatting

Context
Refers to a dimension, level, or attribute within a report header, unless it is used as a summarized field
or grouping condition inside a chart or crosstab.
Reason
The object has multiple values within this context. For example, when referring to the Country level
within the report header, Country refers to all the countries within the report. In this case, only the first
country will be displayed.
Resolution
Move the object out of the header.
Note:
It is safe to ignore this warning if the intent is to show the last value.
7.5.3 {xxxx} may have multiple values in the report footer; only the last value will
be displayed.
Context
Refers to a dimension, level, or attribute within a report footer, unless it is used as a summarized field
or grouping condition inside a chart or crosstab.
Reason
The object has multiple values within this context. For example, when referring to the Country level
within the report footer, Country refers to all the countries within the report. In this case, only the last
country will be displayed.
Resolution
Move the object out of the footer.
Note:
It is safe to ignore this warning if the intent is to show the last value.
7.5.4 Only the first value on the page will be shown
Context
You have a dimension, level, or attribute inside the page header.
Reason
This is an informational message only. No action is required.
2011-05-06118
Report Layout and Formatting

7.5.5 Only the last value on the page will be shown
Context
You have a dimension, level, or attribute inside the page footer
Reason
This is an informational message only. No action is required.
7.5.6 The measure {xxxx} has no meaningful value in this location
Context
A measure is placed in a page header or footer.
Reason
There is no aggregation context for the measure to be based on.
Resolution
Move the measure to the report header or footer or another section in the report.
7.5.7 The measure {xxxx} may have multiple values in this location
Context
A non-delegated measure is placed in a report or group header or footer.
Reason
It is not clear which value should be displayed for this measure.
Resolution
Create a total based on this object.
7.5.8 The delegated measure {xxxx} may have multiple values in this group
2011-05-06119
Report Layout and Formatting

Context
Inserting a delegated measure into a group that is based on an attribute.
Resolution
Group by associated dimension.
7.5.9 The value for the delegated measure {xxxx} cannot be calculated in this group
Context
Inserting a delegated measure into a group context where the measure cannot be resolved (formula,
another measure, date custom grouping).
Reason
This report contains features that cannot be understood by the data source.
Resolution
Approximate the measure by using a local total.
7.5.10 The value for the delegated measure {xxxx} cannot be calculated in this
crosstab
Context
Inserting a delegated measure into a crosstab where the measure cannot be resolved (formula, another
measure, date custom grouping, where objects from the same dimension are used on opposing axes).
Reason
The crosstab contains features that cannot be understood by the data source.
Resolution
Approximate the measure by using a local total.
7.5.11 The delegated measure {xxxx} may have multiple values in this crosstab
Context
Inserting a delegated measure into a crosstab that is based on an attribute.
2011-05-06120
Report Layout and Formatting

Resolution
Group by associated dimension.
7.5.12 Select the External Hierarchy option when grouping on a hierarchy.
Context
This message is displayed when you have flat grouping on a hierarchy object.
Reason
Flat grouping on hierarchical objects may yield incorrect total data.
Resolution
Select the "External Hierarchy" option to switch to hierarchical grouping, or change the grouping to use
the corresponding level object.
7.5.13 Hierarchy objects should be placed within a hierarchical group
Context
Projecting a hierarchy onto the report canvas without a hierarchical group based on the same hierarchy
surrounding it.
Resolution
Place the hierarchy objects within a hierarchical group.
7.5.14 The level {xxxx} should be placed within a group based on its associated
hierarchy
Context
A level is placed in a group which is not grouping on the level itself, the levels below it, or its parent
hierarchy.
Reason
The level has multiple values within this context. For example, when referring to the Region level within
the Country level group, Region refers to all the regions within the country. In this case, only the first
region will be displayed.
2011-05-06121
Report Layout and Formatting

Resolution
Move the level into the body section.
7.5.15 The recommended operation for this Total is {xxxx}
Context
Total is inserted in report header, group header, chart, or cross-tab.
Reason
There is a mismatch between the specified total operation and the operation that is recommended in
the universe.
Resolution
Change the total operation type to match the recommended type.
7.5.16 Totalling on {xxxx} is not recommended
Context
Summarizing on a measure when the universe recommends that we do not summarize.
Resolution
Move the object into the body section and do not summarize.
2011-05-06122
Report Layout and Formatting
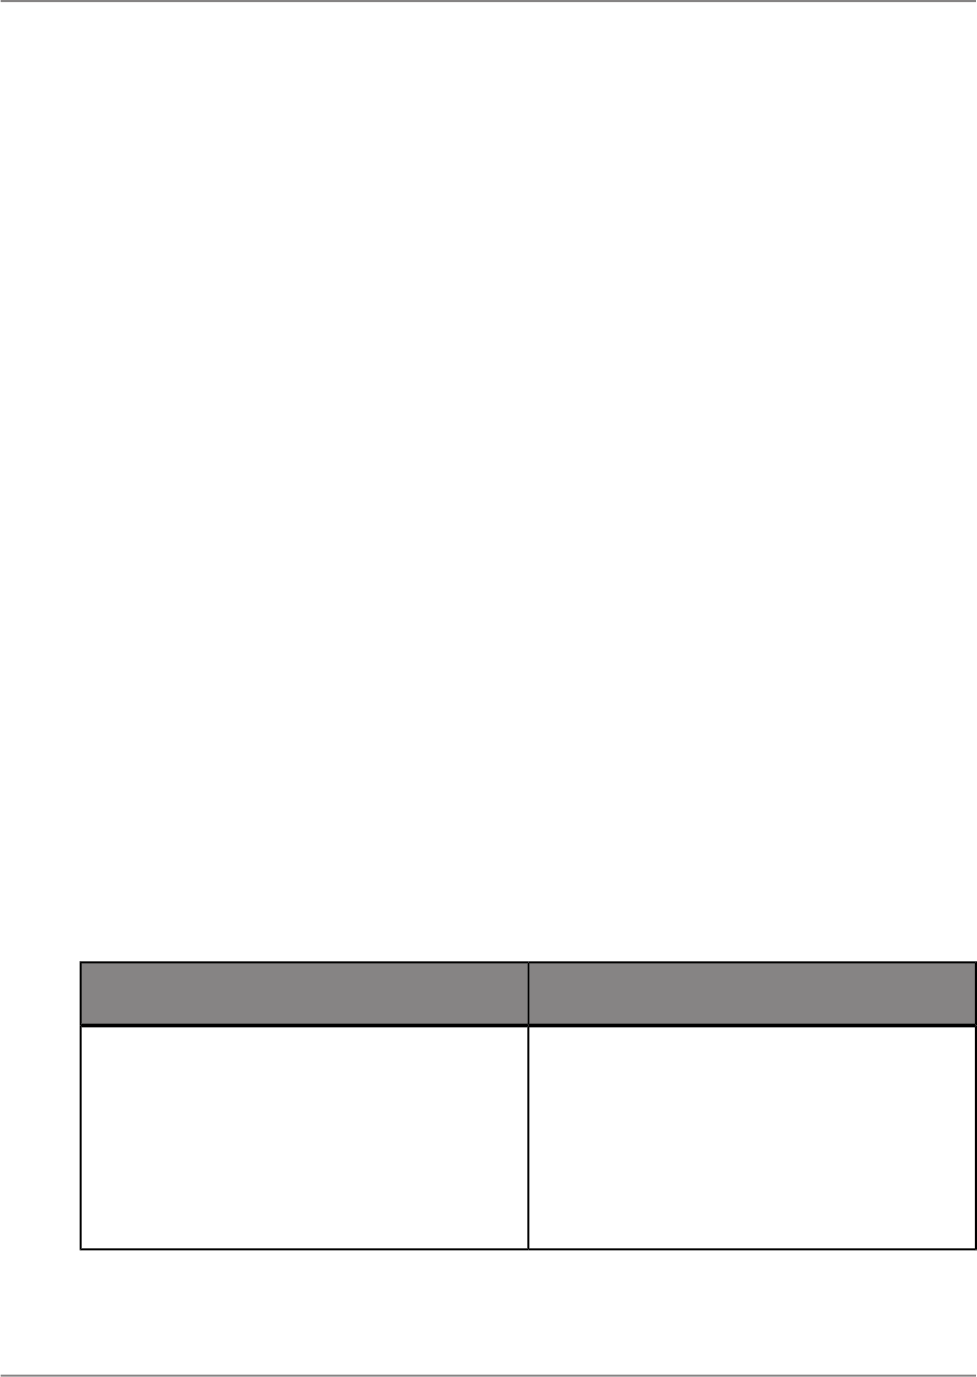
Sorting, Grouping, and Totaling
Sorting, grouping, and totaling are the steps that turn disorganized data into useful information on a
report. This section describes the types of sorting, grouping, and totaling that you can do in a report.
8.1 Sorting data
When you first insert a result object into your report, the data within the objects appears in an arbitrary
order. However, you can use the Sorting feature to sort data into a logical format.
8.1.1 Understanding sort options
When you sort, Crystal Reports asks you to define two things: the sort direction (ascending or
descending), and the object you want the sort to be based on (sort object).
Sort objects let you determine the order in which data appears on your report. Almost any object can
be used for sorting, including formulas. An object's data type determines how the data from that object
is sorted.
Note:
You cannot sort on memo or BLOB objects.
Sort OrderObject Type
blanks
punctuation
numbers
uppercase letter
lowercase letters
Single-character string objects
2011-05-06123
Sorting, Grouping, and Totaling
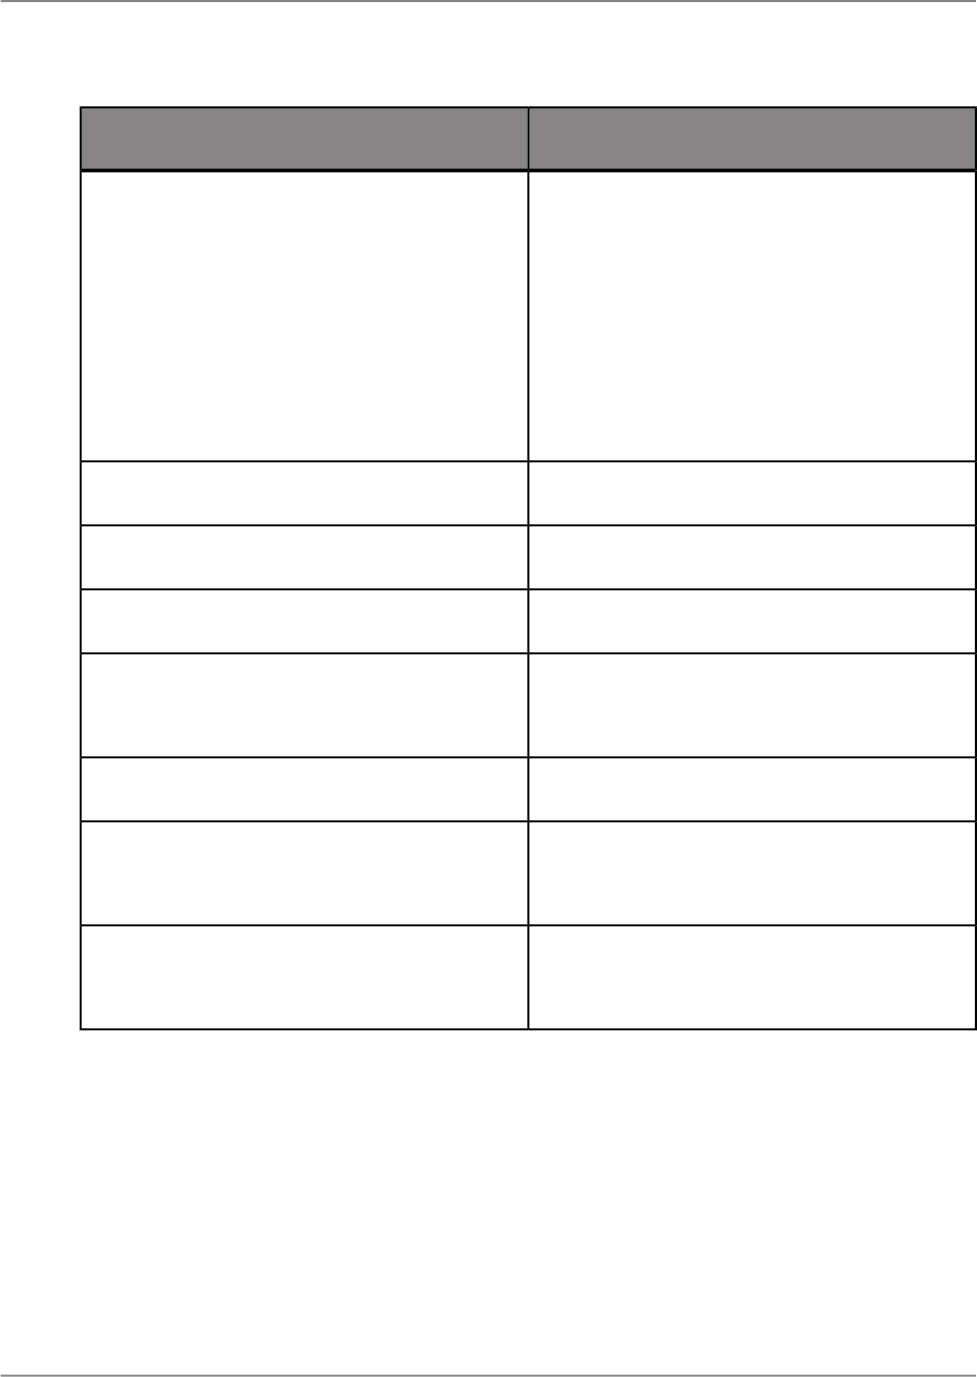
Sort OrderObject Type
two letters
three letters
four letters, and so on
For example:
• "123" comes before "124"
• " " (blank) comes before "a"
• "aa" comes before "aaa"
Multiple character string object
numeric orderCurrency objects
numeric orderNumber objects
chronological orderDate objects
chronological order
same-date values sorted by time
DateTime objects
chronological orderTime objects
False values (0)
True values (1)
Boolean comparison objects
null values
non-null values
Null values
Note:
If sorting and grouping are performed on the data source server, the sort order may vary when Unicode
or UTF-8 data is used. The order applied depends on the rules in place for your data source. In certain
cases, Unicode data is sorted by its binary value, but it can also be sorted according to a particular
locale setting. Refer to the documentation for your data source for details on how Unicode data objects
are sorted.
2011-05-06124
Sorting, Grouping, and Totaling

8.1.2 How to sort your data
In single object sorting, all the records used in the report are sorted based on the values in a single
object. Sorting an inventory report by stock number or sorting a customer list by customer number are
examples of single object sorts.
In multiple object sorts, Crystal Reports first sorts the records based on the values in the first object
selected, putting them in ascending or descending order as specified. If two or more records have a
matching object value in the first sort object, the matching records are sorted by the value in the second
sort object.
For example, if you choose to sort first by Country and then by Region, both in ascending order, the
report would appear with countries listed in alphabetic order, and regions within each country listed in
alphabetic order. Any other objects, such as the postal codes within each region, would remain unsorted.
You create single or multiple object sorts using the same procedure.
8.1.2.1 To sort your data
1.
On the "Data" tab, click Sorts.
The "Groups and Sorts" dialog box appears.
2.
Expand the Body area, and click Add Sort.
3.
From the list, select the object you want to sort on.
4.
Click the Sort button to switch from ascending to descending sort order.
5.
Repeat steps 2 to 4 to add additional sort objects.
Note:
The data is sorted in the order that the objects are listed. You can change the order of multiple sort
objects by moving them up or down in the list.
6.
Click OK.
8.1.3 Sort controls
You may want to design your report so that users can modify a sort object or sort direction without
refreshing information from the data source. You can do this by using a sort control.
2011-05-06125
Sorting, Grouping, and Totaling

A sort control is useful for several reasons:
• It allows users to sort report data for further analysis without leaving the canvas of the report.
• It eliminates processing demand on the data source.
• It reduces the time spent waiting for data to be sorted.
• It allows users to sort objects in the report with or without a connection or rights to access the data
source at the time of viewing.
When planning to include a sort control in your report, it is important to consider the following points:
• Sort controls apply across an entire record set; you cannot sort only one group.
• Sort controls cannot be used in subreports.
• Sort controls cannot be created within a Cross-tab.
There are two ways to insert a sort control on your report: you can insert a sort control as a separate
element on the report, or you can bind the sort control to an existing element.
8.1.3.1 To create a sort control
Before you create a sort control, you must create a sort object.
You can bind a sort control to an existing element in the "Page Header" section of the report canvas.
For example, if you are creating a sort control on the Customer.LastName sort object, you may want
to bind the sort control to the Customer.LastName object header. The sort control will then be applied
to all data retrieved by that object.
1.
In the "Page Header" section, right-click the object that you want to bind the sort control to, and then
click Bind Sort Control.
The "Sort Control" pane appears. The "Sort Control" pane lists the sort objects you have added to
the report.
2.
From the list, select the sort object to which you want to bind a sort control, and then click OK.
3.
Repeat these steps for any additional sort controls you want to add.
Tip:
You can also insert a sort control as a separate element on your report through the "Insert" tab. The
sort control will not be bound to an element that already exists on the report, such as a group header.
An interactive sort control is added to the report.
Users can sort the objects you have selected by clicking the sort arrows that appear beside the element.
The report promotes the selected object temporarily to the top of the sort order. When a second sort
control is used, the first is returned to its original position in the sort order and the second is promoted
to the top sort.
Note:
Grouping hierarchy is not affected by sort controls.
2011-05-06126
Sorting, Grouping, and Totaling

8.1.3.2 To remove a sort control
A sort control can be removed only through the Bind Sort Control dialog box.
1.
Right-click the text object that contains the existing sort control.
2.
Click Bind Sort Control.
The Bind Sort Control dialog box appears.
3.
Click Not Interactive.
4.
Click OK.
The sort control is removed from the report.
8.2 Grouping data
Grouped data is data that is sorted and separated into meaningful groups. For example, a customer
list may be grouped by Postal Code or Region. In a sales report, a group might consist of all orders
placed by a particular customer or orders generated by a particular sales representative.
Group and sort direction
When data is grouped, the following sort and group direction options are available. Direction refers to
the order in which the values are displayed:
• Ascending
Ascending order means smallest to largest (1 to 9, A to Z, False to True). The program sorts the
records in ascending order and then begins a new group whenever the value changes.
• Descending
Descending order means largest to smallest (9 to 1, Z to A, True to False). The program sorts the
records in descending order and then begins a new group whenever the value changes.
• Specified order
Specified order is an order that you customize for your needs. The program places each record into
the custom group that you specify, leaving the records in each group in original order; or, it sorts
them in ascending or descending order, depending on your instructions.
2011-05-06127
Sorting, Grouping, and Totaling

8.2.1 To group data
1.
On the "Insert" tab, click Group.
The "Group" pane opens.
2.
Select the object you want to group on.
3.
Select the sort order, Ascending or Descending, and then click Insert.
The group is inserted into the report at the first level. If you create more groups in your report, you
will need to specify the order in which they appear.
4.
If you want to change the font size of the group name, resize it from the "Format" tab.
Related Topics
• Sorting records within groups
• Grouping data into intervals
• Creating group headers
8.2.2 Creating custom groups
Usually data is sorted and grouped based on the values from an object in the report. Sometimes,
however, you may want to group data based on other criteria. Custom groups provide a solution for
grouping data in such instances. For example:
• You want to create collections of groups based on the values in an object.
For example, you may have a Color object on your report that includes specific color names (Logan
Green, Sky Blue, Emerald Green, Navy Blue, and so on) but you want all shades of each color to
appear as a single group (Greens, Blues, Reds, and so on). In this case you can build custom groups
and manually assign the records you want to be in each group.
• You want to select specific values or ranges of values for each group.
For example, you might want one group to contain records where gross sales are less than a certain
value, a second group where gross sales are greater than a certain value, and a final group where
gross sales fall between two values. In this case, you can create custom groups (Low Sales, Medium
Sales, High Sales) that use the same range of selection facilities that are available to you for building
record selection queries.
Creating custom groups to perform specified order grouping provides a solution to these sorting and
grouping challenges. Specified order grouping enables you to create both the customized groups that
will appear on a report and the records that each group will contain. The only limitation is that a record
can be assigned to only one group.
2011-05-06128
Sorting, Grouping, and Totaling
Related Topics
• Grouping data into intervals
8.2.2.1 To create a custom group
Before you create a custom group, you must create a group in your report.
1.
Click Data > Groups.
The "Groups and Sorts" dialog box appears.
2.
Click the Custom Grouping button adjacent to the group name.
The "Custom Grouping" dialog box appears.
3.
In the "Custom Sort" area, click the first cell and select an item from the list.
4.
To edit the condition used to filter data for the group, click the "Condition" cell adjacent to the "Custom
Sort" cell, and set the filter condition in the "New Custom Grouping" dialog box.
5.
After you have created all of the custom groups needed for the report, select an option for organizing
the records that are not in one of the custom groups:
• Discard everything else
• Group everything else in a single group with the name: <Others>
• Include everything else without changing the grouping
6.
Click OK.
8.2.3 Sorting records within groups
Once you have grouped your data, you can easily sort the records within the groups to further organize
the information.
8.2.3.1 To sort records within groups
1.
On the "Data" tab, click Sorts.
The "Groups and Sorts" dialog box appears.
2.
On the "Sorts" tab, click the arrow next to the group name to expand the options for the group.
2011-05-06129
Sorting, Grouping, and Totaling

3.
Click the icon adjacent to the "Sort by" object and select an option to sort the records within
the group.
4.
Click OK.
8.2.4 Grouping data into intervals
Age groups, time periods, and sales categories are some of the interval groupings that you can create.
In this example, you will rank customers by the amount of business they did in the previous year.
This example uses specified order grouping to create a custom group that lets you specify the records
that will be included in each group. You define the intervals you want and the program does the rest.
8.2.4.1 To group data into intervals
To group data into intervals, you must first create a report with a numeric value object. For example:
Internet Sales Amount.
1.
On the "Insert" tab, click Group, select Internet Sales Amount as the object to be grouped on, and
then click Insert.
2.
On the "Data" tab, click Groups.
The "Groups and Sorts" dialog box appears.
3.
Click Custom Grouping.
The "Custom Grouping" dialog box appears.
4.
In the "Custom Sort" area, click the first cell and type Less than $1,000.
5.
Click the "Condition" cell adjacent to the "Custom Sort" cell.
The "New Custom Grouping" dialog box appears.
6.
Because the first group will contain only those records that have an Internet Sales Amount figure of
less than $1,000, set the condition to read as follows:
Internet Sales Amount Less Than 1,000
a. From the operator list, select Less Than.
b. Type 1000.
c. Click OK.
7.
Set up a second custom group that contains values between $1,000 and $2,500.
a. Click the next cell in the "Custom Sort" area, and type $1,000 and $2,500.
b. Click the "Condition" cell adjacent to the "Custom Sort" cell.
The "New Custom Grouping" dialog box appears.
2011-05-06130
Sorting, Grouping, and Totaling

8.
Set the condition to read as follows:
Internet Sales Amount Between [1,000; 2,500]
a. From the operator list, select Between.
b. Click the value.
The "Between Values" dialog box appears.
c. Type 1000 in the "Minimum" box.
d. Type 2500 in the "Maximum" box.
e. Click OK twice.
9.
Set up the final custom group that contains all values over $2,500.
a. Click the next cell in the "Custom Sort" area, and type Over $2,500.
b. Click the "Condition" cell adjacent to the "Custom Sort" cell.
The "New Custom Grouping" dialog box appears.
10.
Set the condition to read as follows:
Internet Sales Amount Greater Than 2,500
11.
Click OK until all of the dialog boxes are closed.
8.2.5 Grouping by the first letter of a customer name
You might want to break your data into groups based on the first letter of the customer name. To do
this requires the use of a formula.
In this example, you create a formula to extract the first letter of each customer's name. Then, you
group the data using the object from the formula as the sort-and-group-by object. The program sorts
the data based on the first letter of each customer name and starts a new group whenever that letter
changes.
Related Topics
• Formulas overview
8.2.5.1 To group data by the first letter of a customer name
To group data by the first letter of a customer name, you must first create a report with a Customer
object.
1.
In the "Data Explorer" side panel, right-click Formulas, and then click New Formula.
2.
Type a name for your formula in the "Name" text box.
2011-05-06131
Sorting, Grouping, and Totaling

For example, myformula1.
3.
Click OK.
The "Formula Workshop" appears.
4.
Click Add Object and select Customer from the list.
A formula is automatically inserted.
5.
Type [1] after the formula. For example:
{AdventureWorks.Customer\Contacts\Customer}[1]
Typing [1] tells the program to group on the first letter of the customer's name instead of creating a
separate group for each customer's name.
6.
Click Save and Close.
7.
In the "Data Explorer" side panel, right-click the formula that you created and click Group on
<formula>.
The data for your report is grouped by the formula as specified. In this case, the data is broken into
groups based on the first letter of the customer's name. The formula provides a live header for every
group.
Related Topics
• Formulas overview
• Grouping data
• Grouping data into intervals
• Creating group headers
8.2.6 Grouping data hierarchically
You can group data in a report to show hierarchical relationships. When you group data hierarchically,
Crystal Reports sorts information based on the relationship between two objects (for example, parent
and child objects). For example, you could represent your company's organizational structure.
Note:
If you group on a hierarchy object, the data will automatically be grouped hierarchically.
8.2.6.1 Requirements for grouping data hierarchically
A hierarchical relationship must be inherent in the data that you use for the report:
2011-05-06132
Sorting, Grouping, and Totaling
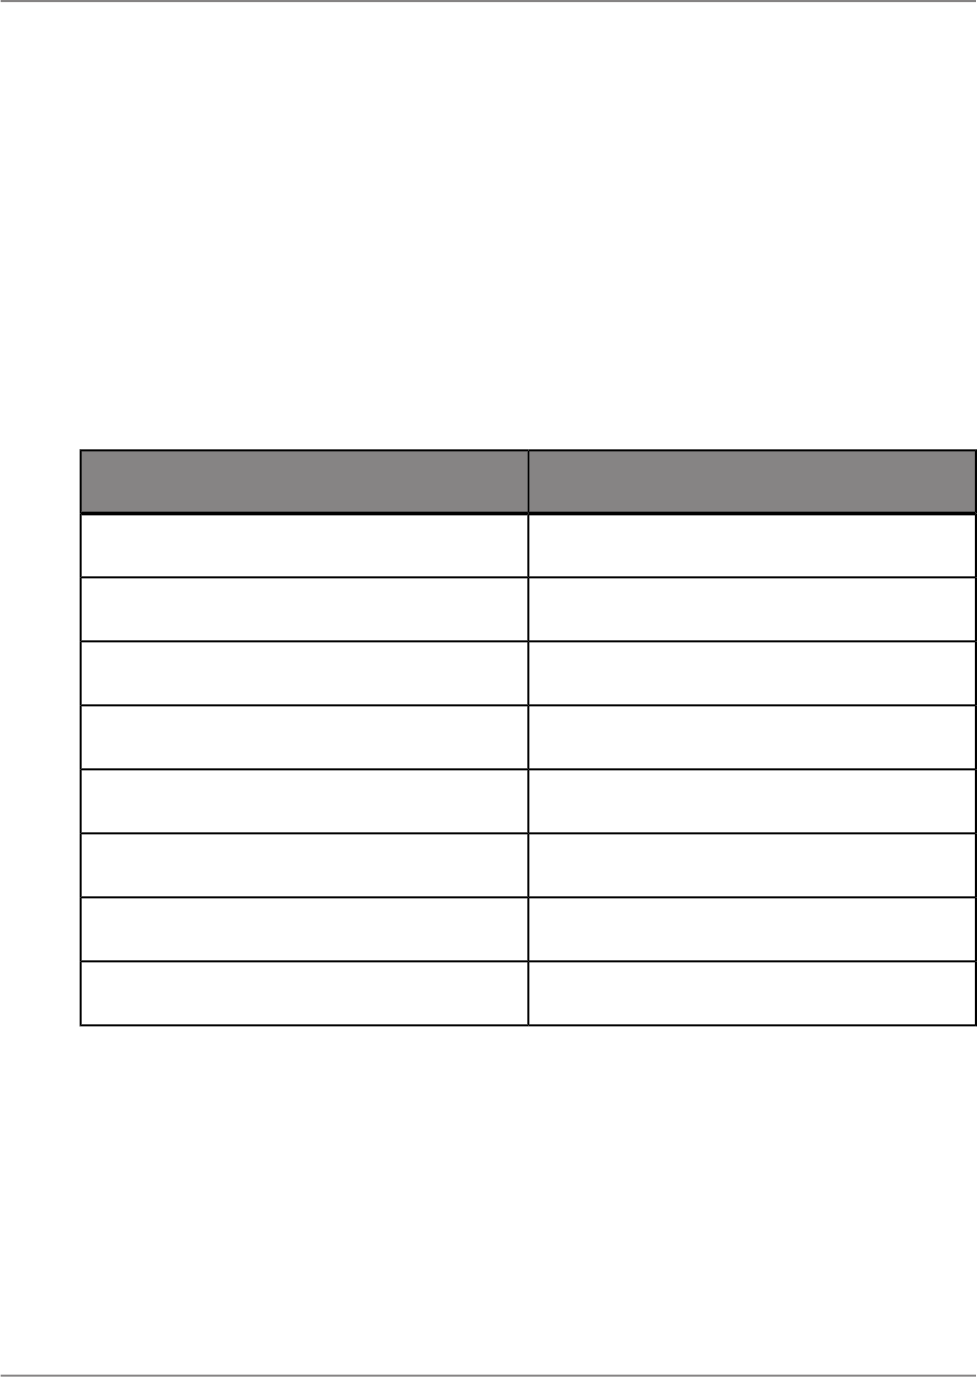
• Parent and child objects must be of the same data type for the program to recognize a relationship
between them.
• The data in the child object must be a subset of the data in the parent object.
• For the top level of a hierarchy to appear in a report, the value must appear in the parent data, and
the corresponding row in the child data must be empty.
• There cannot be any circular logic in the data (that is, if B reports to A, and C reports to B, then A
cannot report to C).
For example, if you want to show the hierarchical relationship of the people who work in a department,
you could group data by employee name (the parent object) and specify the hierarchy by using the
object that lists whom the employee reports to (the child object). Your result tables might look like the
following example.
Supervisor (child)Employee (parent)
Michael AdamsJohn Miller
Julie Armstrong
Michael AdamsRichard Wilson
Michael AdamsJohn Smith
Julie ArmstrongMichael Adams
Julie ArmstrongDonna Moore
Donna MooreDenise Smith
Donna MooreRichard Miller
The Employee and Supervisor objects contain overlapping data that implies a hierarchical relationship.
There are eight unique employee names, with three of these names also appearing as supervisors
(Julie Armstrong, Michael Adams, and Donna Moore). Two employees report to Julie Armstrong, three
employees report to Michael Adams, and two employees report to Donna Moore.
Note:
Julie Armstrong has no corresponding supervisor. This data implies that Julie Armstrong is a top-level
supervisor who does not report to anyone else in this folder.
In the report, the hierarchical groupings may be represented various ways. For example:
2011-05-06133
Sorting, Grouping, and Totaling
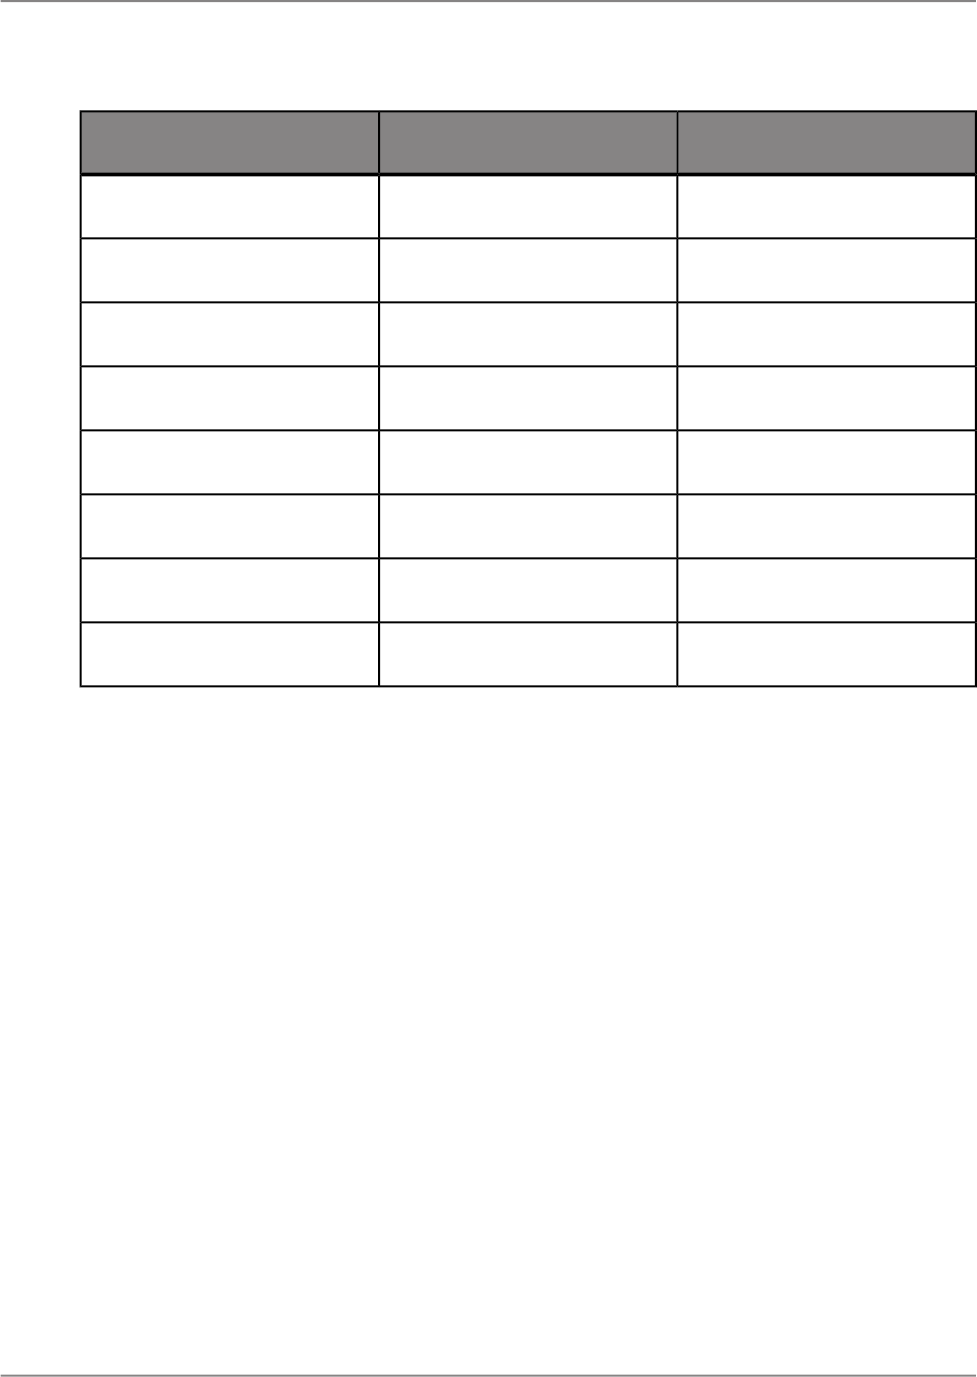
Third levelSecond levelFirst level of the hierarchy
Julie Armstrong
Michael Adams
John Miller
Richard Wilson
John Smith
Donna Moore
Denise Smith
Richard Miller
If you group a report on the Employee object, you can further sort the data to show the hierarchical
relationship between these employees and their supervisors.
8.2.6.2 Characteristics of hierarchically grouped data
In addition to providing a visual representation of the hierarchy inherent in your data, a report that you
have grouped hierarchically has other characteristics:
• When you isolate a group in the hierarchy, the isolated view will still show the records that are lower
in the hierarchy.
• The report contains hierarchical Group Footers that include the records that are lower in the hierarchy
of each group. You can total data across the hierarchies.
Note:
You cannot use hierarchical totals in formulas.
2011-05-06134
Sorting, Grouping, and Totaling

8.2.6.3 To group data hierarchically
Before you can group data hierarchically, you must create a group in your report. For example, if you
want to see the hierarchical structure of a company's employees, create a group based on the Employee
object.
1.
On the "Data" tab, click Groups.
The "Groups and Sorts" dialog box appears.
2.
On the "Sorts" tab, click the arrow next to the group name, and then click the icon next to
the "Sort By" object to choose Ascending as the sort order for the group.
Note:
If you have grouped on a hierarchy object, you can skip steps 3 and 4. The data will automatically
be displayed hierarchically.
3.
On the "Groups" tab, from the "Hierarchy Type" list, select Hierarchical Group Parent.
4.
From the "Hierarchical Group Parent" list, select the object that you want to use as the parent for
the hierarchy.
For example, for an Employee hierarchical report, you might select the data object listing the
supervisor to whom the employee reports.
5.
In the "Group Indent" box, enter the amount you want to indent for each subgroup.
6.
Click OK.
The report is now grouped by employee name and further sorted to show the supervisor hierarchy.
Related Topics
• Totaling grouped data
8.3 Totaling grouped data
One of the primary purposes for breaking data into groups is to find a total for each group of records
instead of for all the records in the report.
When the program totals data, it sorts the data, breaks it into groups, and then totals the values in each
group.
Many totaling options are available. Depending on the data type of the object you plan to total, you can
do the following:
• Sum the values in each group.
2011-05-06135
Sorting, Grouping, and Totaling
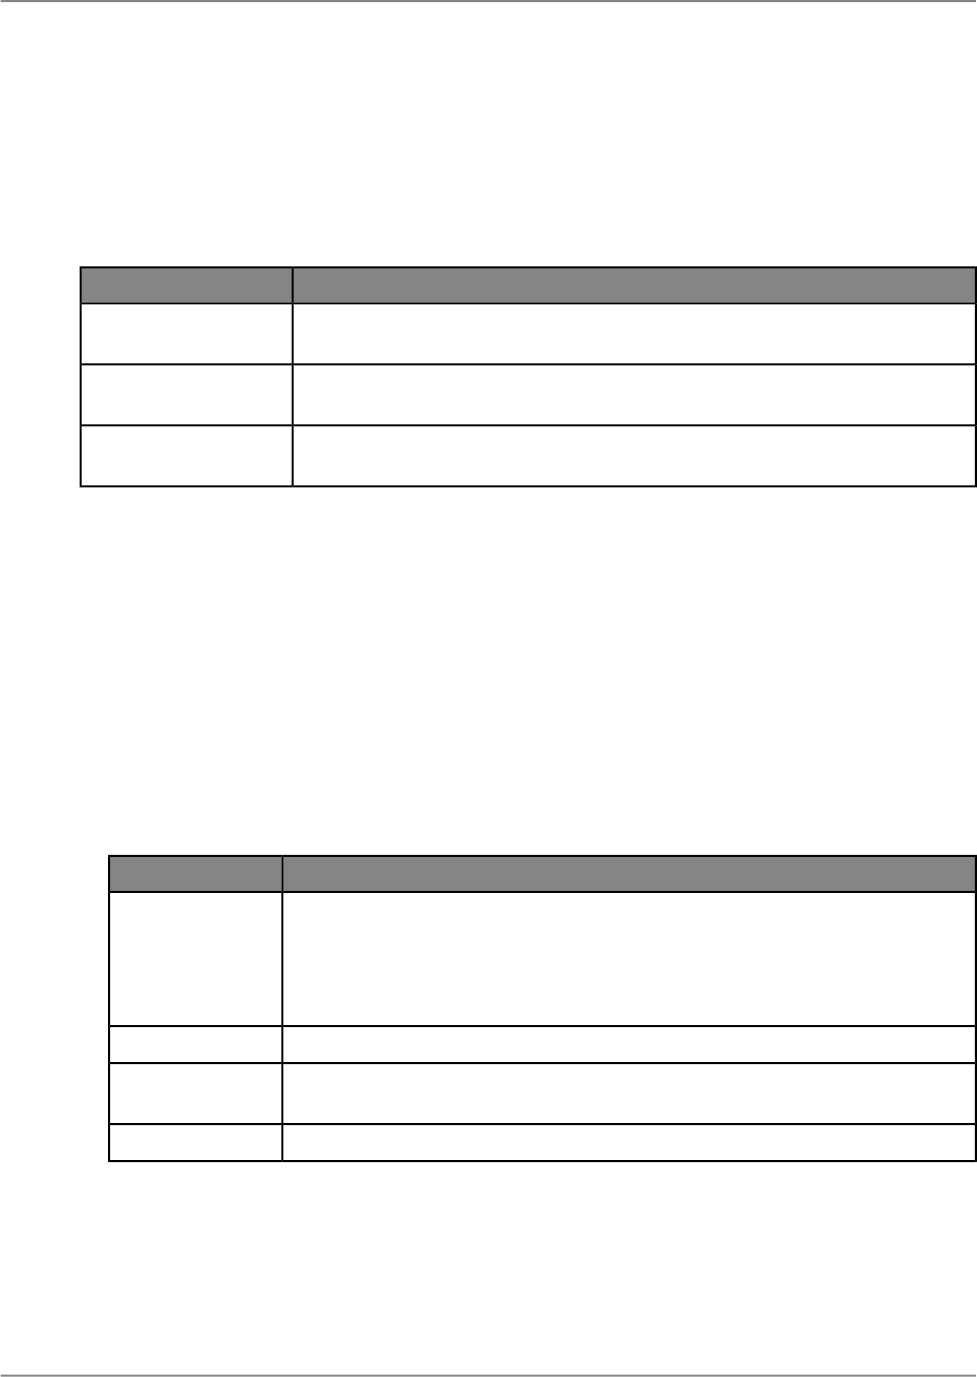
• Count all the values or only those values that are distinct from one another.
• Determine the maximum, minimum, average, or Nth largest value.
• Calculate up to two kinds of standard deviations and variances.
For example:
DescriptionOption
Determine the number of customers in each state. The total would count the
distinct customers in each state group.
Customer list reports
Determine the average order placed each month. The total would calculate
the size of the average order for each month group.
Purchase order reports
Determine the total sales per sales representative. The total would sum or
subtotal the purchase order amounts for each sales representative group.
Sales reports
You can also add a subtotal to your report. A subtotal is used to total part of a series of numbers. For
example, you may want to create report that provides a total of last year's sales for each country in
addition to the grand total of last year's sales for all countries.
8.3.1 To total grouped data
Before you can total grouped data, you must create a report with grouped data.
1.
On the "Insert" tab, click Total.
2.
Select options for your total:
DescriptionOption
The mathematical operation to perform on the grouped data, such as Count
of, Average of, or Maximum.
Note:
If you are totaling a delegated measure, select Delegated as the operation.
Total operation
The object of data to be counted.
Totaled object
Whether to place the total in a custom location, at all group levels, in the
report footer, or for each grouping of <object>.
Placement
Whether to place the total above data or below data.
Location
3.
Click Insert.
4.
If you want to change any of these settings, right-click the total and then click Format Total.
The Format dialog box appears, and you can edit a variety of options.
2011-05-06136
Sorting, Grouping, and Totaling

Related Topics
• Calculating Percentages
• Grouping data hierarchically
8.3.2 Ordering groups by totaled values
You can organize groups by total value in either ascending or descending order. For example, in a
purchase order report, if you subtotal the order amount by state, you can order the groups:
• From lowest to highest order amount (ascending).
• From highest to lowest order amount (descending).
8.3.2.1 To order groups by total value
Create a report with totaled data.
1.
On the "Data" tab, click Sorts.
The "Groups and Sorts" dialog box appears.
2.
On the Sorts tab, expand the options for the group by clicking the arrow next to the group name.
3.
Click Add Sort.
A sort based on the total is automatically added to the group.
4.
Using the arrow next to the "Sort By" object, select the sort order: Ascending or Descending.
5.
Click OK.
The records in the group are ordered based on the total value(s) specified.
8.3.3 Selecting top or bottom N groups or percentages
At times, you might want to show only the top or bottom groups, or percentage values in a report. For
example, you might want to show only the fastest selling product lines, the countries that account for
the top 25 percent of sales, the states that generate the most orders, and so on.
With top N groups or percentages, you are instructing the program to display the groups or percentages
that have the highest summary values (Top N).
2011-05-06137
Sorting, Grouping, and Totaling

With bottom N groups or percentages, you are instructing the program to display the groups or
percentages that have the lowest summary values (Bottom N).
When setting up top or bottom N, you also have to consider what to do with the records that do not fit
your top or bottom N criteria. You can either eliminate these records from your report, or collect them
into a single group.
Note:
In a top or bottom N selection, it is recommended that you do not use a group that is sorted hierarchically.
The integrity of your hierarchical group sort might be affected by the top or bottom N selection.
Related Topics
• Totaling grouped data
8.3.3.1 To select top or bottom N groups
Before you can select top or bottom N groups, you must create a report with totaled data.
This procedure shows how to select top or bottom N groups. Top or bottom N percentages work the
same as top or bottom N groups, except that you define the percentage value instead of the number
of groups.
1.
On the "Data" toolbar, click Sorts.
The "Groups and Sorts" dialog box appears.
2.
On the "Sorts" tab, select Top N or Bottom N from the "Show" list for the group.
3.
In the "N is" box, enter a value for N.
4.
Select Include Ties to accommodate groups whose totaled values are equal.
For example, suppose you had the following groups:
• Order 1 = 100
• Order 2 = 90
• Order 3 = 80
• Order 4 = 80
If you set your top N to be three, but you do not select Include Ties, your report will show Order 1,
Order 2, and Order 3.
However, if you select Include Ties, your report will show Order 1, Order 2, Order 3, and Order 4
even though N is set as three. In this way, the program accommodates the equal values of orders
3 and 4.
When the program runs the report, it will include only the groups that you specified.
5.
Select the Include Others, with the name check box to display other records, or clear this check
box to hide the other records.
2011-05-06138
Sorting, Grouping, and Totaling

If you select this option, enter a name for the other records to appear under.
6.
Click OK.
8.4 Calculating Percentages
You can calculate the percentage of a total of groups or of one group within a broader grouping. For
example, you can show the percentage of sales in each city based on the total sales for each country.
Or, you can see what percentage each country contributes to the grand total of sales.
8.4.1 To calculate a percentage
1.
On the "Insert" tab, click Total.
a. Select Count of as the total operation.
b. Select the object for which you want to calculate the sum.
c. Select the total location.
d. Click Insert.
Note:
The summary location cannot be in the report footer when you are calculating a percentage.
A total object is added to the "Group Footer" and "Report Footer".
2.
In the "Group Footer", right-click the total object and click Format Total.
The Format dialog box appears.
3.
Click Total, and then select Show as Percentage of.
4.
From the list, select the group that you want the percentage to be based on.
You can choose to show a percentage of a group within another group, or to show a percentage of
the grand total.
5.
Click Close.
8.5 Group headers
Whenever you create a group the program creates both a "Group Footer" section (where you can place
any subtotal or total value), and a "Group Header" section (where it automatically places the group
name). Group headers are useful and often necessary to make your report data clear and easily
2011-05-06139
Sorting, Grouping, and Totaling

understood. Though the program creates a group header automatically, you may find that you would
like to change or modify the header to suit your needs.
8.5.1 Creating group headers
You will learn how to create the most common kinds of group headers:
• Standard headers
• Live headers
• Complex live headers
8.5.1.1 Standard headers
A standard header identifies each group in generic categories, such as Customer, State, or Monthly
Orders.
Standard headers are useful but less descriptive. For example, while Region Sales Figures indicates
a regional group, the header doesn't indicate which regions are in the group.
8.5.1.1.1 To create a standard header
1.
Delete the automatically generated text for the group header.
Note:
Do not delete the "Group Header" section.
2.
On the "Insert" tab, click Text, and drag the object to the "Group Header" section.
3.
Enter the text you want to use for the header.
4.
Click outside the frame.
When you run the report, the same header will appear at the beginning of each group.
8.5.1.2 Live headers
A live header is a header that changes based on the content of the group. If the data is grouped by
region, for example, a live header would typically identify the region detailed in each group. Thus, the
Arizona group would have a header identifying the group as Arizona data, the California group would
have a header identifying the group as California data, and so on.
2011-05-06140
Sorting, Grouping, and Totaling

Note:
When creating a group, the program automatically inserts live header in the "Group Header" section.
However, you may want to change the information in the "Group Header".
8.5.1.2.1 Creating a live header with text
A more complex type of live header combines an object value and text. A typical group header of this
kind might represent sales data by region, such as Sales for California or Customers in Zip Code 60606.
You would create a text element for Sales for or Customers in Zip Code, and embed the object value
in the text element.
To create a live header with text
1.
Delete the automatically generated text for the group header.
Note:
Do not delete the group header area.
2.
On the "Insert" tab, click Text, and drag the object to the "Group Header" section.
3.
Enter the text you want to use for the header.
4.
In the "Data Explorer" side panel, click the object that matches the group that you are working on
and drag it into the text element, immediately after the text and the space you entered.
5.
Format the text element as you want it to appear.
When you run the report, the program will create a complex live header for each of your groups.
8.5.2 Suppressing group headers
You have the option to hide group headers in your report.
8.5.2.1 To suppress group headers
• On the report, right-click the group header and click Hide.
8.5.3 Drilling-down on group headers
2011-05-06141
Sorting, Grouping, and Totaling

To make it easier for users to scan headings, you can hide the "Body" section of your report and have
only the group headers visible. When necessary, users can click on the group header to view the report
body.
8.5.3.1 To drill-down on group headers
1.
Right-click the "Body" section and click Format Body.
2.
In the Format dialog box, in the General section, select Show on Drill Only.
3.
Click Close.
4.
Double-click the group header to show the hidden section.
Related Topics
• Using the isolate feature on grouped data
8.6 Running Totals
Running totals are a flexible and efficient way to create specialized totals and continually incrementing
totals.
This section shows you how to add a basic running total and a running total within a group. You will
also learn how to create conditional running totals and running totals using formulas.
8.6.1 Understanding running totals
Running total objects are similar to total objects but allow more control over how the total is calculated
and when it is reset. Running total objects are specifically suited to perform the following totaling
functions:
• Total a value independent of the report's grouping.
• Total a value conditionally.
8.6.1.1 How running totals work
2011-05-06142
Sorting, Grouping, and Totaling
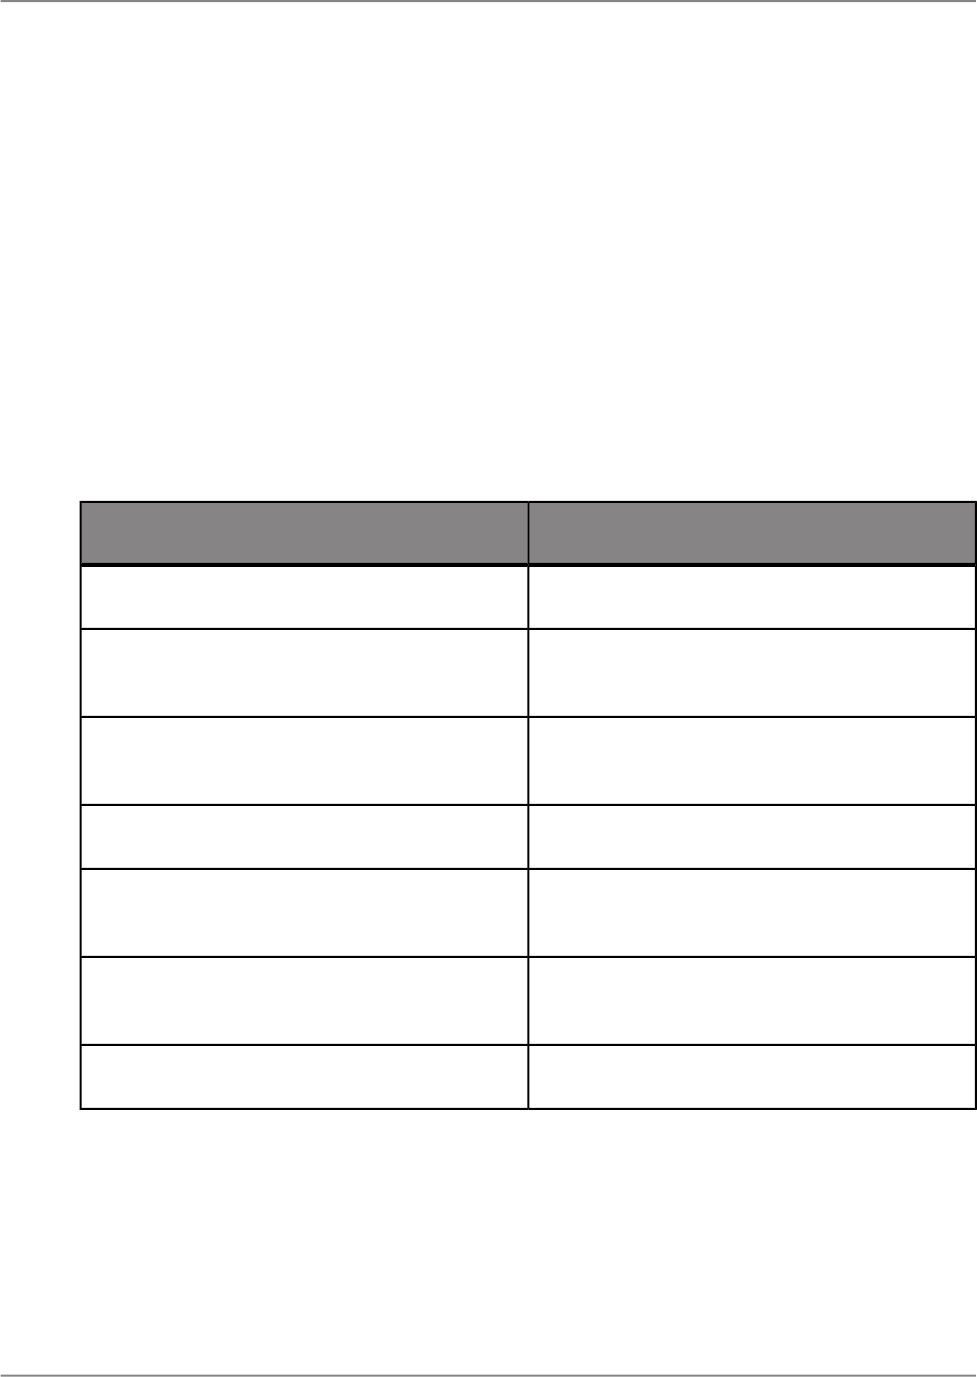
You create running totals in the "Data Explorer" side panel. The running total can be modified in the
Format dialog box, which lets you select the following:
• An object to total.
• The total operation to use.
• A condition upon which to base the evaluation.
• A condition upon which to reset the evaluation.
Note:
A running total object can be used on result objects and first-pass formulas, but cannot be used on
second-pass formulas or formulas that reference other second-pass formulas.
8.6.1.1.1 Placement of running total objects
The following list summarizes the records that are included in the calculation when a running total is
placed in various report sections. This list assumes the running total is not reset.
Records includedSection
The first record in the report."Report Header"
All records up to and including the first record on
the current page.
"Page Header"
All records up to and including the first record in
the current group.
"Group Header"
All records up to and including the current record."Body"
All records up to and including the last record in
the current group.
"Group Footer"
All records up to and including the last record on
the current page.
"Page Footer"
All records in the report."Report Footer"
8.6.2 Creating running totals in a list
2011-05-06143
Sorting, Grouping, and Totaling

Running totals are totals that can be displayed record by record. They total all records (in the report,
in the group, and so on) up to and including the current record.
Note:
Running total objects are prefixed by the # sign.
8.6.2.1 To create a running total in a list
Before you can create a running total in a list, you must create a report with a customer object such as
Customer Name, and numeric value objects such as Order Amount and Order ID.
1.
In the "Data Explorer" side panel, right-click Running Totals, and then click New Running Total.
A new running total is inserted in the "Running Totals" area of the "Data Explorer".
2.
Double-click the running total.
The Format dialog box appears.
3.
In the "Name" box, type a name for your running total.
4.
From the "Evaluate Condition""Type" list, select On Change of Object.
5.
From the list of result objects, select Order ID.
The program will run a running total each time this object changes.
6.
From the "Reset Condition""Type" list, select Never.
7.
Click the Total node.
8.
From the "Based On" list, select Order Amount.
9.
From the "Operation" list, select Sum.
10.
Click Close.
11.
Drag the running total object from the "Data Explorer" to the "Body" section of the report, to the right
of the Order Amount object.
On your report, each row in the running total column displays the current record value added to the
previous values. This total continues, unbroken, through the report.
8.6.3 Creating running totals for a group
You can use running totals to tally items in a group. The running total starts with the first item in the
group and ends with the last. The process starts again for the next group, until all the groups are done.
You can use a running total that combines with a group to perform several functions:
• Maintain a running total of customer orders.
• Group customer orders and reset the running total for each group.
2011-05-06144
Sorting, Grouping, and Totaling

• Display the subtotal for each customer group.
8.6.3.1 To create a running total for a group
Before you can create a running total for a group, you must create a report with a customer object such
as Customer Name, and numeric value objects such as Order Amount and Order ID.
1.
In the "Data Explorer" side panel, right-click the Customer Name object, and then click Group on
<Object>.
2.
Right-click Running Totals, and then click New Running Total.
A new running total is inserted in the "Running Totals" area of the "Data Explorer".
3.
Double-click the running total.
The Format dialog box appears.
4.
In the "Name" box, type a name for your running total.
5.
From the "Evaluate Condition""Type" list, select For Each Record.
6.
From the "Reset Condition""Type" list, select On Change of Group and accept the default group
name.
7.
Click the Total node.
8.
From the "Based On" list, select Order Amount.
9.
From the "Operation" list, select Sum.
10.
Click Close.
11.
Drag the running total object from the "Data Explorer" to the "Body" section of the report, to the right
of the Order Amount object.
Note:
If you want to view a grand total of each group, place the running total object in the "Group Footer"
section of your report.
8.6.4 Creating conditional running totals
You can use a conditional running total to subtotal selected values in a list. For example, you would
use a conditional running total in the following circumstances:
• To create a list that contains both Canadian and U.S. customers.
• To keep customer records sorted alphabetically based on customer name.
• To create a total of the values from only the Canadian records.
• To create a total of the values from only the U.S. records.
2011-05-06145
Sorting, Grouping, and Totaling

In each case, create two running totals: one to keep a running total of the U.S. records and one to keep
a running total of the Canadian records.
8.6.4.1 To create a conditional running total
Before you can create a conditional running total, you must create a report with a customer object such
as Customer Name, a location object such as Country, and a numeric value object such as Internet
Sales Amount.
1.
On the "Data" tab, click Sorts.
The Groups and Sorts dialog box appears.
2.
Add a sort to your report based on the Customer Name object.
3.
In the "Data Explorer" side panel, right-click Running Totals, and then click New Running Total.
A new running total is inserted in the "Running Totals" area of the "Data Explorer".
4.
Double-click the running total.
The Format dialog box appears.
5.
In the "Name" box, type USTotal.
6.
From the "Evaluate Condition""Type" list, select Use Formula.
The "Formula Workshop" appears.
7.
From the "Add Object" list, select Country, and then type = "USA". For example:
{AdventureWorks.Customer\Location\Country} = "USA"
The program will evaluate the running total each time it comes to a record where Country is equal
to "USA." The running total will ignore all other records (such as records for Canada).
8.
From the "Reset Condition""Type" list, select Never.
9.
Click the Total node.
10.
From the "Based On" list, select Internet Sales Amount.
11.
From the "Operation" list, select Sum.
12.
Click Close.
13.
Drag the running total object from the "Data Explorer" and insert it in the "Body" section of the report.
14.
Now create the "CanadaTotal" running total object using the process outlined in steps 3-13, but this
time, set the following evaluation formula:
{AdventureWorks.Customer\Location\Country} = "Canada"
15.
When you are finished, insert the "CanadaTotal" running total object in the "Body" section of your
report.
Note:
If you only want to see a grand total of the Canadian and American sales, place the two running
total objects you created in the "Report Footer" section of your report.
2011-05-06146
Sorting, Grouping, and Totaling

8.6.5 Creating running totals using a formula
If your report contains suppressed data or data based on a WhilePrintingRecords formula, create a
running total formula. If you do not use a running total formula, suppressed data will appear in the
running total.
When you create a running total manually, you need to create three formulas:
• A summary formula.
• A display formula to display the variable.
• A reset formula to set a variable to zero.
With running totals that use a formula, you can create a report that performs the following functions:
• Maintains a running total of customer orders.
• Groups customer orders and resets the running total for each group.
• Displays the subtotal for each order (the last running total for that order).
Related Topics
• Typical uses for formulas
8.6.5.1 To create a summary formula
Before you can create a summary formula, you must create a report with a customer object such as
Customer Name, and numeric value objects such as Order Amount and Order ID.
1.
In the "Data Explorer" side panel, right-click Formulas, and then click New Formula.
The "Formula Name" dialog box appears.
2.
Type a name for the formula, and then click OK.
The "Formula Workshop" appears.
3.
In the code text window, type a formula and select objects from the "Add Object" list.
For example:
WhilePrintingRecords;
CurrencyVar Amount;
Amount := Amount + {AdventureWorks.Internet Sales\Order Amount};
This formula prints the running total of the values in the Order Amount object.
4.
Click Save and Close.
2011-05-06147
Sorting, Grouping, and Totaling

5.
Drag the formula object from the "Data Explorer" to the "Body" section of the report, to the right of
the Order Amount object.
8.6.5.2 To create a reset formula to set a variable to zero
Before you can create a reset formula, you must create a report with a customer object such as Customer
Name, and numeric value objects such as Order Amount and Order ID.
1.
In the "Data Explorer" side panel, right-click the Customer Name object, and then click Group on
<Object>.
2.
In the "Data Explorer" side panel, right-click Formulas, and then click New Formula.
The "Formula Name" dialog box appears.
3.
Type a name for the formula, and then click OK.
The "Formula Workshop" appears.
4.
In the code text window, type the following formula:
WhilePrintingRecords;
CurrencyVar Amount := 0;
This formula sets the value in the Amount variable to 0.
5.
Click Save and Close.
6.
Drag the formula object from the "Data Explorer" to the "Group Header 1" section of the report.
Because the "Group Header 1" section appears once for every group, the formula will run each time
the group changes. The Amount variable is reset to 0 each time a new group begins.
7.
In "Structure" mode, right-click the formula, and then click Format Formula Element.
The Format dialog box appears.
8.
Select Hide.
The formula will not appear in the final print-out.
9.
Click Conditional Formula next to "Hide".
The "Formula Workshop" appears.
10.
Type {@Formula Name } = {@Formula Name }, and then click Save and Close.
Replace Formula Name with the name of your formula.
11.
Click Close.
8.6.5.3 To create a display formula to display the variables
2011-05-06148
Sorting, Grouping, and Totaling

Before you can create a reset formula, you must create a report with a customer object such as Customer
Name, and numeric value objects such as Order Amount and Order ID.
1.
In the "Data Explorer" side panel, right-click the Customer Name object, and then click Group on
<Object>.
2.
In the "Data Explorer" side panel, right-click Formulas, and then click New Formula.
The "Formula Name" dialog box appears.
3.
Type a name for the formula, and then click OK.
The "Formula Workshop" appears.
4.
In the code text window, type the following formula:
WhilePrintingRecords;
CurrencyVar Amount;
This formula displays the current value of the Amount variable at any time.
5.
Click Save and Close.
6.
Drag the formula object from the "Data Explorer" to the "Group Header 1" section of the report.
Because the "Group Footer 1" section appears once for every group, the formula will run each time
a group ends. The value stored in the Amount variable will be printed each time the group changes.
Note:
This formula prints the same value that a running total prints for the last record in each group.
Because it is printing it in the "Group Footer" section, it acts as a group subtotal, not as a running
total.
On your report, each row in the running total column displays the current record value added to the
previous values. The running total starts fresh with each new group, and the final running total for each
group becomes the subtotal for that group.
2011-05-06149
Sorting, Grouping, and Totaling

2011-05-06150
Sorting, Grouping, and Totaling

Charting
You can present summarized data in colorful, easy-to-read charts. This section demonstrates how to
create charts in reports to make report data more meaningful and easier to understand. You can choose
from a number of chart layouts and types, drill down to see the details behind the graphical totals, and
edit the formatting of chart objects.
9.1 Charting concepts
You can use charts any time you want to represent data visually in a report.
For example, if you have a sales report grouped by Region with a subtotal of Last Year's Sales for each
region, you can create a chart that displays Sales per Region.
You can chart on body, formula, and running total objects.
9.1.1 Chart definition
Some chart definitions may include other sections.
9.1.1.1 Chart types and subtypes
Different sets of data are particularly suited to a certain chart type. The following is an overview of the
main chart types and their most common uses.
Bar
Most bar charts (also known as a column chart) display or compare several sets of data. Two useful
bar charts are the Side-by-Side bar chart and the Stacked bar chart.
• Side-by-Side bar chart
2011-05-06151
Charting

A Side-by-Side bar chart displays data as a series of vertical bars. This type of chart is best suited
for showing data for several sets over a period of time (for example, last year's sales figures for AZ,
CA, OR, and WA).
• Stacked bar chart
A Stacked bar chart displays data as a series of vertical bars. This type of chart is best suited for
representing three series of data, each series represented by a color stacked in a single bar (for
example, sales for 1997, 1998, and 1999).
Line
A line chart displays data as a series of points connected by a line. This type of chart is best suited for
showing data for a large number of groups (for example, total sales over the past several years).
Area
An area chart displays data as areas filled with color or patterns. This type of chart is best suited for
showing data for a limited number of groups (for example, percentage of total sales for AZ, CA, OR,
and WA).
Pie
A pie chart displays data as a pie, split and filled with color or patterns. Pie charts are typically used for
one group of data (for example, the percentage of sales for the entire inventory); however, you can
choose multiple pie charts for multiple groups of data.
Doughnut
A doughnut chart is similar to a pie chart, displaying data as sections of a circle or doughnut. If, for
example, you charted sales by region on a particular report, you would see the total number of sales
(the figure) in the center of the doughnut and the regions as colored sections of the doughnut. As with
the pie chart, you can choose multiple doughnut charts for multiple groups of data.
3-D Riser
A 3-D Riser chart displays data in a series of 3-dimensional objects, lined up side-by-side, in a
3-dimensional plane. The 3-D Riser chart shows the extremes in your report data. For example, the
differences between sales by customer by country are visually dynamic when presented in this chart.
3-D Surface
3-D Surface charts present a topographic view of multiple sets of data. If, for example, you need a chart
to show the number of sales by customer by country, in a visually dynamic and relational format, you
might consider using the 3-D Surface chart.
XY Scatter
An XY Scatter chart is a collection of plotted points that represent specific data in a pool of information.
The XY Scatter chart allows the user to consider a larger scope of data for the purpose of determining
trends. For example, if you input customer information, including sales, products, countries, months,
and years, you would have a collective of plotted points that represents the pool of customer information.
Viewing all of this data on an XY Scatter chart would allow you to speculate as to why certain products
were selling better than others or why certain regions were purchasing more than others.
2011-05-06152
Charting

Radar
A radar chart positions group data, such as countries or customers, at the perimeter of the radar. The
radar chart then places numeric values, increasing in value, from the center of the radar to the perimeter.
Radar charts are particularly useful for determining how specific values relate to group data.
Bubble
A bubble chart (an extension of the XY Scatter chart type) displays data as a series of bubbles, where
the size of the bubble is proportional to the amount of data. A bubble chart would be very effective with
the number of products sold in a certain region; the larger the bubble, the greater the number of products
sold in that region.
Numeric Axis
A numeric axis chart is a bar, line, or area chart that uses a numeric object or a date/time object as its
"Category (X) Axis" object. Numeric axis charts provide a way of scaling your X-axis values, thus creating
a true numeric X-axis or a true date/time X-axis.
Gauge
A gauge chart presents values graphically as points on a gauge. Gauge charts, like pie charts, are
typically used for one group of data (for example, the percentage of sales for the entire inventory).
Gantt
A Gantt chart is a horizontal bar chart often used to provide a graphical illustration of a schedule. The
horizontal axis shows a time span, while the vertical axis shows a series of tasks or events. Horizontal
bars on the chart represent event sequences and time spans for each item on the vertical axis. You
should use only date objects when creating a Gantt chart. The Chart Group Type should be set to "For
Each Record", and the start-and end-date objects should be added to the "Total (Y)" area of the chart.
Funnel
Funnel charts are often used to represent stages in a sales process. For example, the amount of
potential revenue shown for each stage. This type of chart can also help identify potential problem areas
in an organization's sales processes. A funnel chart is similar to a stacked bar chart in that it represents
100% of the summary values for the groups included in the chart.
Histogram
A histogram is a type of bar chart used to depict how measurements vary from the mean value. It can
help identify the cause of problems in a process by the shape of the distribution as well as the width
(deviation) of the distribution. In a histogram, the frequency is represented by the area of a bar rather
than the height of the bar.
9.1.1.2 Chart group types
Each combination of chart type, subtype, and chart group type has a different set of required objects.
A subset of the following chart group types apply to each chart type:
2011-05-06153
Charting

• For each record
• On Change of
• For all records
Once you have defined your chart type, subtype, and chart group type, you must add data to one or
more of the following values:
• Category
• Total
• Series
• Label
Note:
Not all of the items are available for every chart type.
Total (Y)
The "Total" value indicates what information is summarized on your chart. For example, to create a
chart showing last year's sales for your customers, the Last Year's Sales object would be the value.
Category (X)
The "Category" value is used with the chart group type "On Change of". It is used to indicate when to
plot the point.
For example, a chart showing Last Year's Sales for your customers uses the CUSTOMER_NAME object
as the condition. Each time the category changes (the customer name changes), a point is plotted.
Series (Z)
The "Series" value is used with the chart group type "On Change of". It is used to specify data for a
series.
Label
The "Label" value is used with the chart group type "For each record". It is used to display a label for
the "Total" value.
9.1.1.2.1 Required values for chart group type "On Change of"
Not all charts have the chart group type "On Change of". For most of the chart types that do, you must
have Total values and either a Category value or a Series value, or both.
SeriesCategoryTotalSubtypeChart type
Only one value.Only one value.
At least one val-
ue.
All subtypesBar
2011-05-06154
Charting
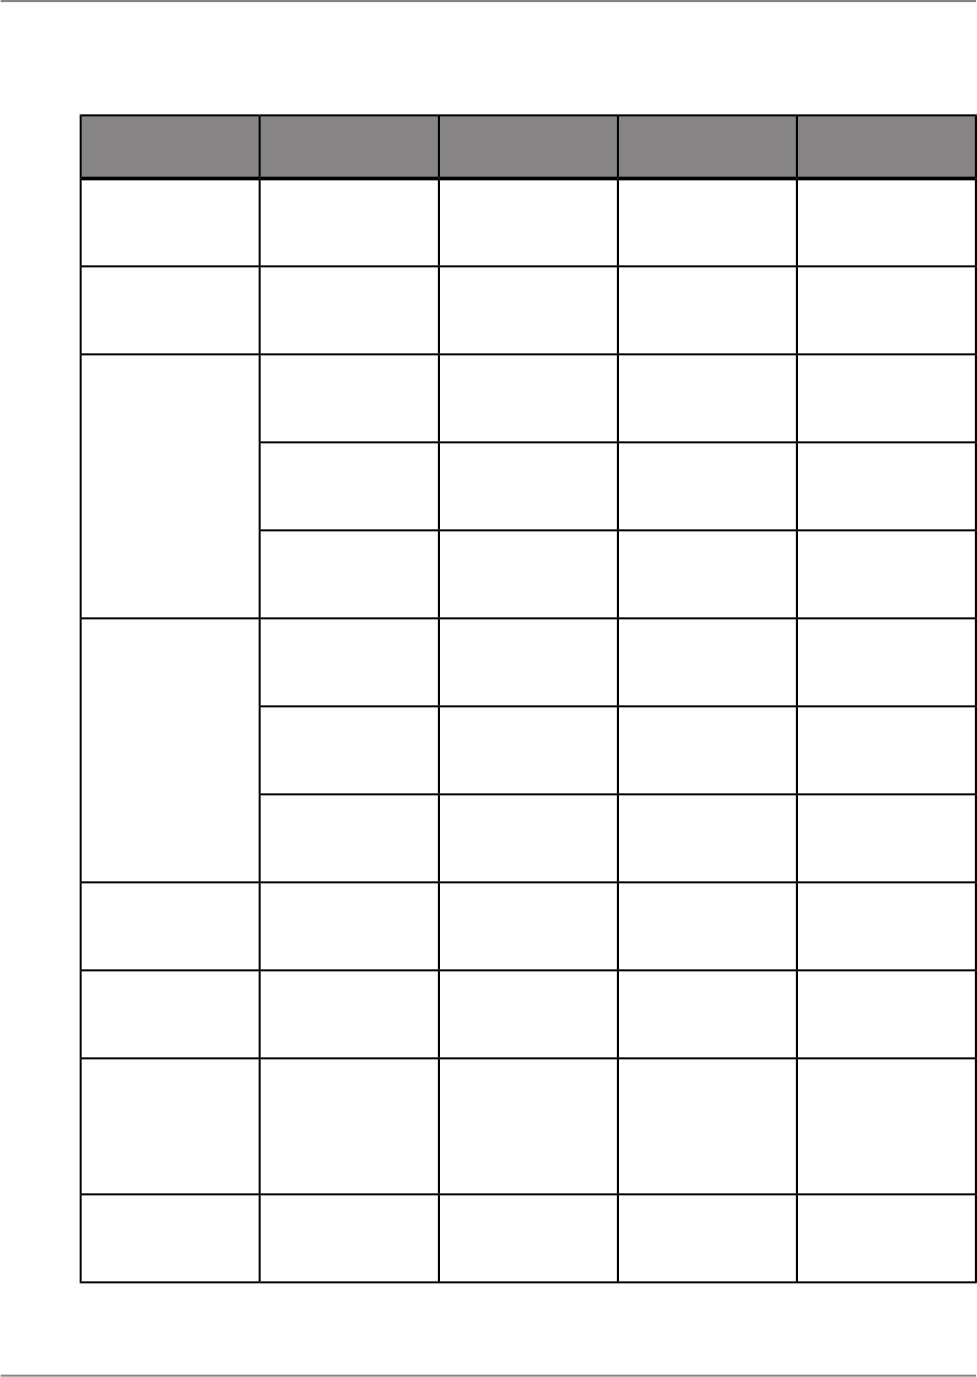
SeriesCategoryTotalSubtypeChart type
Only one value.Only one value.
At least one val-
ue.
All subtypesLine
Only one value.Only one value.
At least one val-
ue.
All subtypesArea
Only one value.Not applicable
At least one val-
ue.
Pie
Pie Only one value.Only one value.
At least one val-
ue.
Multiple pie
Only one value.Only one value.
At least one val-
ue.
Proportional multi-
ple pie
Only one value.Not applicable
At least one val-
ue.
Doughnut
Doughnut Only one value.Only one value.
At least one val-
ue.
Multiple doughnut
Only one value.Only one value.
At least one val-
ue.
Proportional multi-
ple doughnut
Only one value.Only one value.
At least one val-
ue.
All subtypes3-D Riser
Only one value.Only one value.
At least one val-
ue.
All subtypes3-D Surface
Only one value.Only one value.
Requires X and Y
values; accepts
only numeric data
type.
XY Scatter
Only one value.Only one value.
At least one val-
ue.
All subtypesRadar
2011-05-06155
Charting
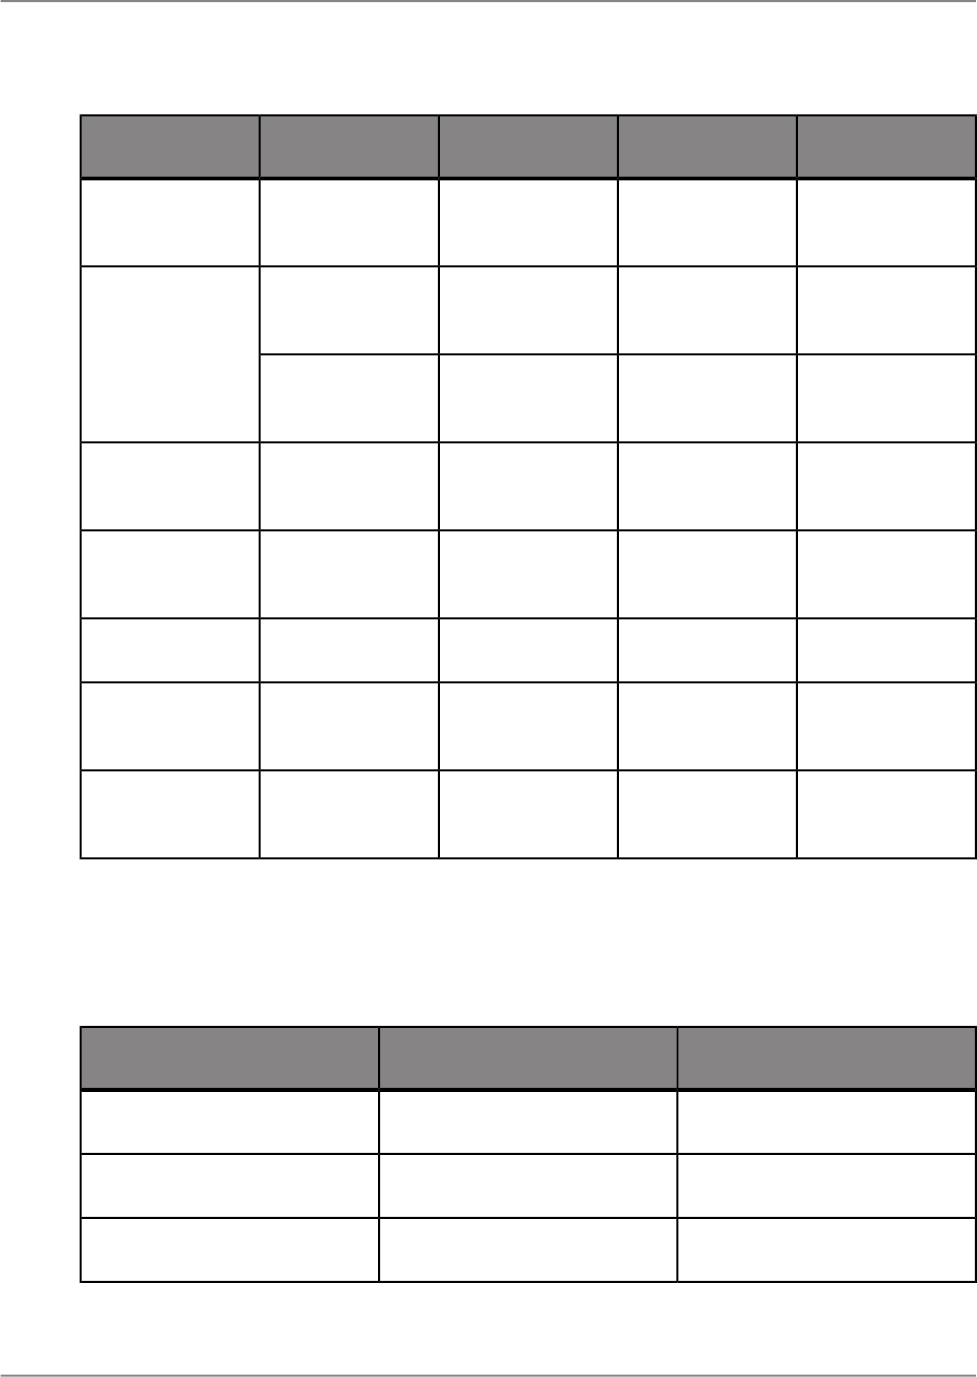
SeriesCategoryTotalSubtypeChart type
Only one value.Only one value.
Requires X, Y,
and size values.
Bubble
Only one value.Only one value.
Two values re-
quired.
High-Low
Stock
Only one value.Only one value.
Four values re-
quired.
High-Low-Open-
Close
Only one value.Only one value.
At least one val-
ue.
All subtypesNumeric Axis
Only one value.Only one value.
At least one val-
ue.
Gauge
Only one value.Only one value.Gantt
Only one value.Only one value.
At least one val-
ue.
Funnel
Only one value.Only one value.
At least one val-
ue.
Histogram
9.1.1.2.2 Required values for chart group type "For each record"
All chart types have the chart group type "For each record"; however, they do not all require the same
values for this option. The Label value is optional for all chart types and subtypes.
TotalSubtypeChart type
At least one value.All subtypesBar
At least one value.All subtypesLine
At least one value.All subtypesArea
2011-05-06156
Charting
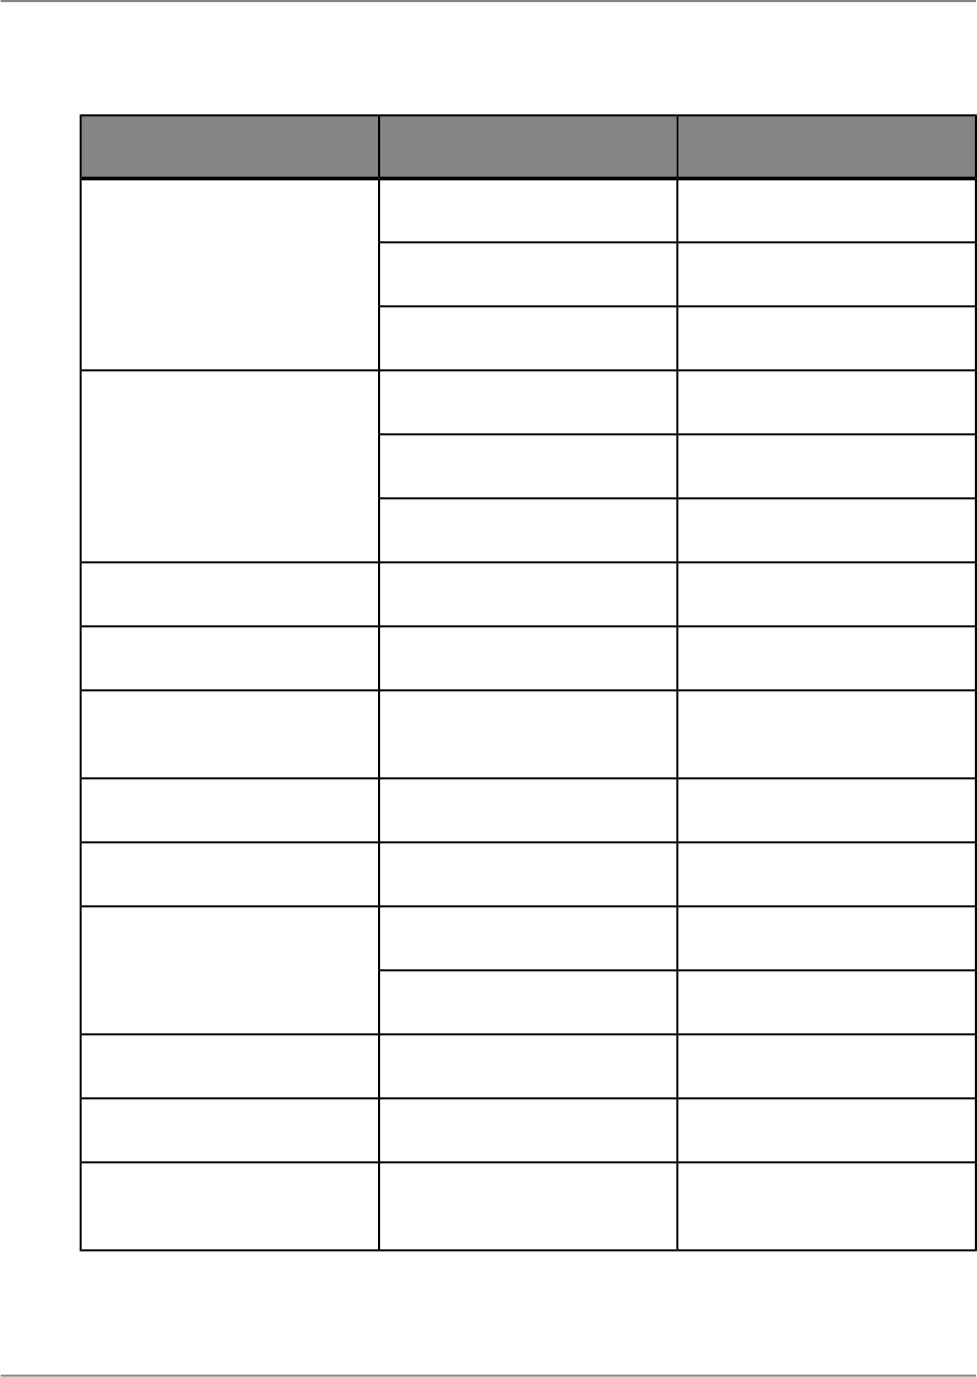
TotalSubtypeChart type
At least one value.Pie
Pie At least one value.Multiple pie
At least one value.Proportional multiple pie
At least one value.Doughnut
Doughnut At least one value.Multiple doughnut
At least one value.Proportional multiple doughnut
At least one value.All subtypes3-D Riser
At least one value.All subtypes3-D Surface
Requires X and Y values; ac-
cepts only numeric data type.
XY Scatter
At least one value.All subtypesRadar
Requires X, Y, and size values.Bubble
Two values required.High-Low
Stock
Four values required.High-Low-Open-Close
At least one value.All subtypesNumeric Axis
At least one value.Gauge
Requires a start date and an
end date.
Gantt
2011-05-06157
Charting
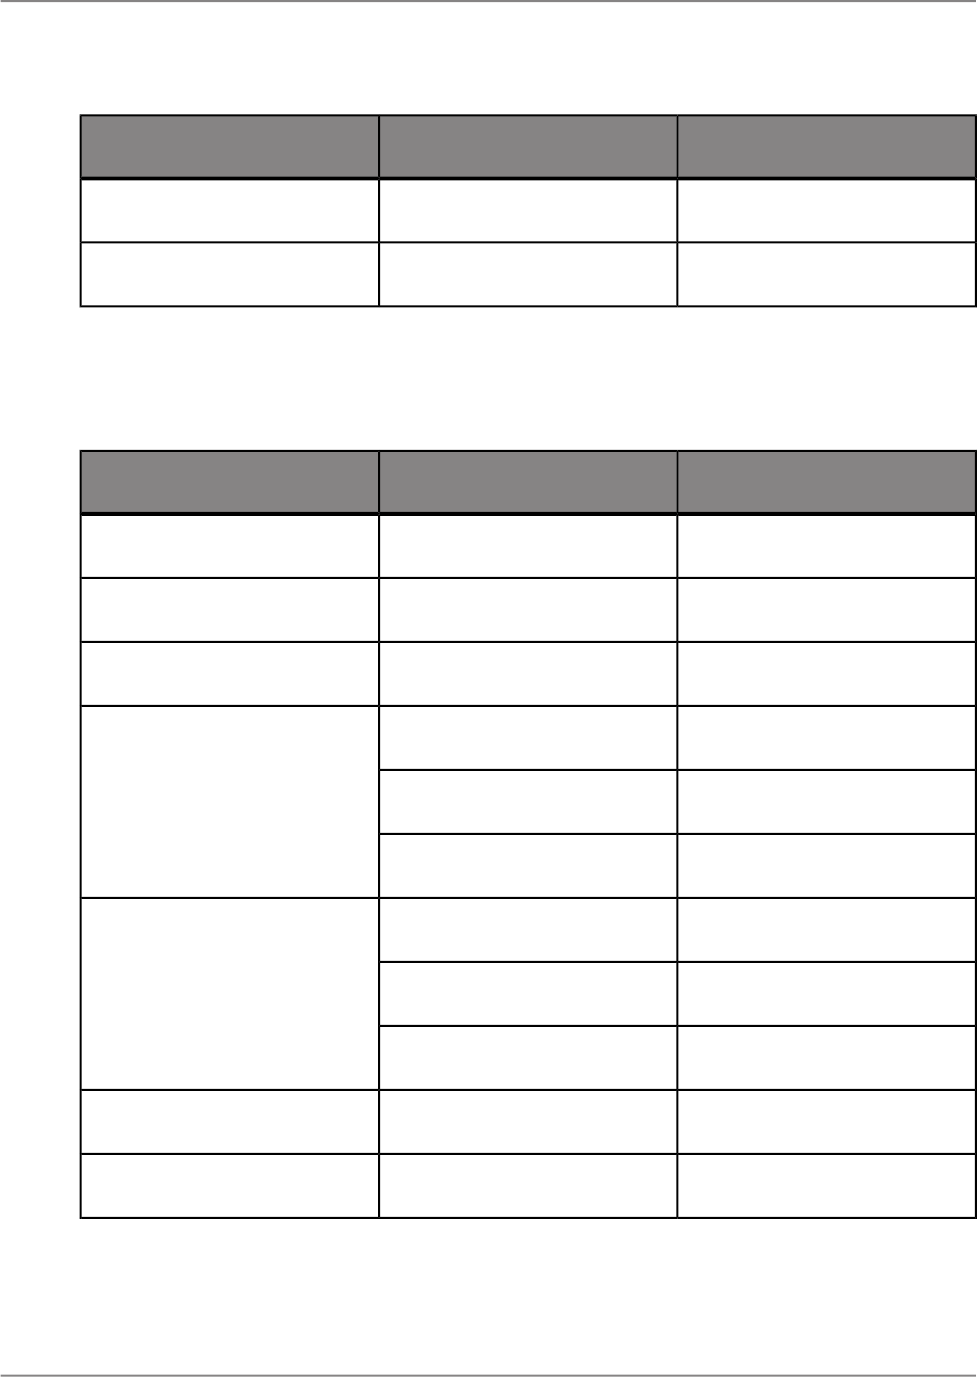
TotalSubtypeChart type
At least one value.Funnel
At least one value.Histogram
9.1.1.2.3 Required values for group type "For all records"
Some chart types or chart subtypes do not have the chart group type "For all records".
TotalSubtypeChart type
At least one value.All subtypesBar
At least one value.All subtypesLine
At least one value.All subtypesArea
At least one value.Pie
Pie Not applicableMultiple pie
Not applicableProportional multiple pie
At least one value.Doughnut
Doughnut Not applicableMultiple doughnut
Not applicableProportional multiple doughnut
At least one value.All subtypes3-D Riser
At least one value.All subtypes3-D Surface
2011-05-06158
Charting
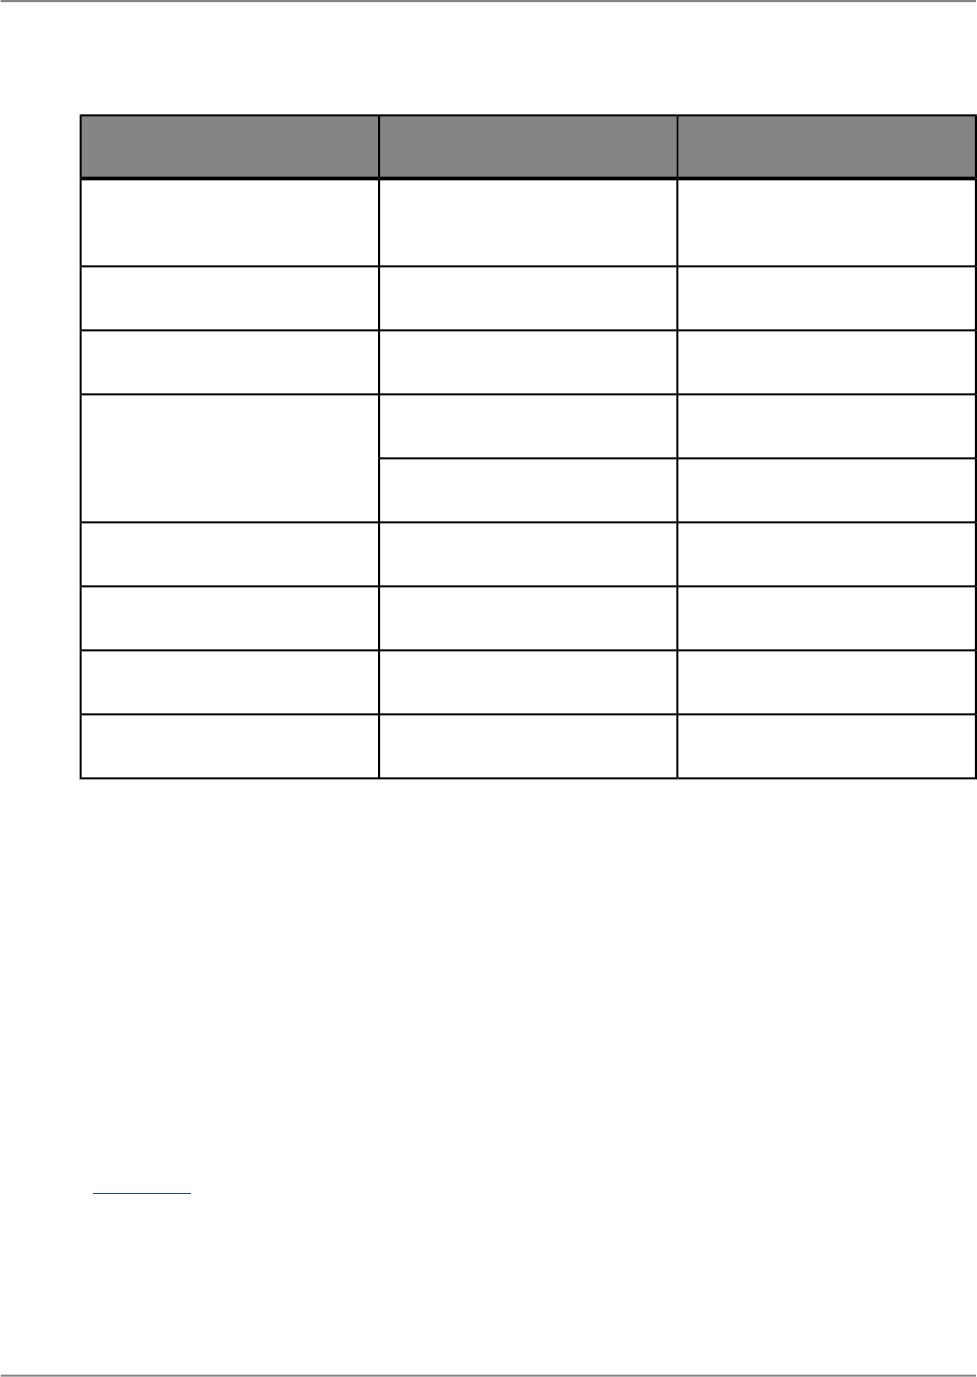
TotalSubtypeChart type
Requires X and Y values; ac-
cepts only numeric data type.
XY Scatter
At least one value.All subtypesRadar
Requires X, Y, and size values.Bubble
Two values required.High-Low
Stock
Four values required.High-Low-Open-Close
At least one value.All subtypesNumeric Axis
At least one value.Gauge
At least one value.Funnel
At least one value.Histogram
9.1.2 Where to place a chart
The placement of a chart determines which data is displayed and where it is printed. For example, a
chart placed in the "Report Header" section includes the data for the entire report, while a chart that is
placed in a "Group Header" or in a "Group Footer" section displays only the group specific data.
Note:
If your report contains subreports, you can place charts in those subreports as well.
Related Topics
• Subreports
2011-05-06159
Charting

9.1.3 Drill-down on charts
Charting is not only a means of presenting data: it is also an analysis tool. Move your cursor over a
section of the chart in the "Page" mode, so that the pointer becomes a drill-down cursor, and then
double-click to view the details for that section of the chart.
9.2 Creating charts
Since charts are a good way to display summarized information, they are usually based on a summary
object in your report. You can create a chart based on values in the Report Header or Footer, a Group
Header or Footer, or a Cross-Tab summary.
Note:
In an OLAP data source, if a measure is defined as a delegated measure, it is recommended to use
the delegated measure as a summary object.
9.2.1 To create a chart
1.
From the "Insert" tab, click Chart and then select a chart type and subtype.
Choose the chart type that best illustrates your data. See Chart types and subtypes.
2.
Drag the element frame to the area of the report canvas where you want to insert the chart.
Charts can be inserted in the Report Header or Footer, or in a Group Header or Footer.
3.
On the default chart, click the Data tab.
4.
Drag objects from the "Data Explorer" panel onto the "Total", "Category", and "Series" drop zones
to add them to the chart.
Each drop zone represents an axis on the chart. The "Total" drop zone represents the Y axis, the
"Category" drop zone represents the X axis, and the "Series" drop zone represents the Z axis.
Each chart type and chart subtype has different required objects. For information on which objects
are required for each chart type and subtype, see Chart group types.
Note:
• If there is a red outline around an object, then a value must be placed there. When you move
the cursor over the object, you will see a note specifying how many parameters are required for
the object.
2011-05-06160
Charting

• When you add a value to either the "Category" or the "Series" area, the red outline may disappear
from both areas.
5.
Right-click the chart and click Format Chart.
The Format dialog box appears.
6.
To edit the position and size of the chart, click General.
7.
To edit the formatting of the chart, click Appearance.
8.
To edit any of the titles on the chart (Title, Subtitle, and so on), select the element from the Selected
Element list and then make the changes.
9.
To edit other elements on the chart, such as the axis labels, right-click the element on the chart, and
edit it using the format dialog box.
Note:
When your chart is inserted, it may cover a portion of the report. Move and resize the chart so that it
fits properly within the report.
9.2.2 Charting on Cross-tab totals
Crystal Reports allows you to include a chart based on total values in your Cross-tab report. For example,
with a Cross-tab that shows the amount of a certain product sold in each region of the United States,
you may want to include a chart showing the percentage of total sales provided by each region for that
product.
Note:
You can also chart on a calculated member in a Cross-tab.
Note:
Bubble charts are not supported by Cross-tab charts.
9.2.2.1 To chart on a Cross-Tab total
1.
Right-click the Cross-tab on the report canvas and click Create Chart from Crosstab Data.
A chart with data from the Cross-tab appears on the report canvas.
2.
To add more objects to the chart, click on the chart Data tab.
3.
Right-click the drop zone you want to insert a result object in and click Insert Chart Data Object.
4.
Repeat step 3 to insert objects in the desired drop zones.
2011-05-06161
Charting

Note:
Each drop zone represents an axis on the chart. The "Total" drop zone represents the Y axis, the
"Category" drop zone represents the X axis, and the "Series" drop zone represents the Z axis.
Each chart type and chart subtype has different required objects. For information on which objects
are required for each chart type and subtype, see Chart group types.
Note:
If there is a red outline around an object, then a value must be placed there. When you move the
cursor over the object, you will see a note specifying how many parameters are required for the
object.
When you add a value to either the "Category" or the "Series" object, the red outline may disappear
from both elements.
5.
To edit other elements on the chart, such as the axis labels or title, right-click the element on the
chart and click Format <element name>.
Your chart is created based on the Cross-tab total.
Note:
When your chart is inserted, it may cover a portion of the report. Move and resize the chart so that it
fits properly within the report.
9.3 Working with charts
Once you have created a chart, you may want to add a new title, headings, or a legend, change fonts,
or even change the type of chart. Crystal Reports provides many options for working with your existing
charts.
9.3.1 Editing charts
You can modify many of your original choices, such as the type of chart to display, the data on which
the chart is based, and so on. When you change the type of chart, you may need to select new object
values to use for the chart.
9.3.1.1 To edit a chart using the Format dialog box
2011-05-06162
Charting

1.
Right-click the element of the chart you want to edit, such as the title, a text object, or the chart itself,
and click Format <object name>.
<object name> is the name of the object you are formatting. For example, "Format Frame", "Format
Title", "Format X Axis Title", and so on.
The Format dialog box appears.
Note:
The currently selected element is shown in the Selected Element menu. To edit a different element,
choose the element from the menu or click it on the chart.
2.
Make the desired changes.
3.
Click Close to apply the formatting changes.
9.3.1.2 To change axis options
1.
Right-click the axis and click Format <x, y, or z>Axis.
2.
In the dialog box, use the appropriate sections to change gridlines, the axis location, the color and
line style of your axis, and so on.
3.
Click Close to apply the formatting changes.
9.3.1.3 To change series options
1.
Right-click a riser item (area, bar, line, marker, pie slice, and so on) or a legend marker on the chart,
and click Format <object name>.
<object name> is the name assigned to the object that you selected.
2.
In the dialog box, make the desired changes.
3.
Click Close to apply the formatting changes.
9.3.2 Formatting charts
You can modify the fonts and text of the titles on the chart, modify the legend format, modify the gridlines
when they are used, and more. The following sections provide information on some of the formatting
options.
2011-05-06163
Charting

9.3.2.1 To change the chart's title
1.
Double-click the title on the chart.
2.
Enter a new title in the text box.
Note:
To change the font properties, use the options on the "Format" toolbar.
9.3.2.2 To change the chart's legend format
1.
Right-click the legend on the chart and then click Format Legend.
2.
Use the properties to change the appearance, font, or other options for the legend.
9.3.2.3 To change the border of a chart
1.
Right-click the chart and click Format Chart.
2.
From the "Selected Element" list, click Frame.
The "Appearance" section appears.
3.
In the "Border" area, change the border line style or color.
9.3.2.4 To change the background of a chart
1.
Right-click the chart and click Format Chart.
2.
From the "Selected Element" list, click Frame.
The "Appearance" section appears.
3.
In the "Fill" area, use the "Color" list to change the background color of the cart. c
2011-05-06164
Charting

9.3.2.5 To conditionally format a chart
1.
Right-click the chart and click Chart Highlighting Expert.
The "Chart Highlighting Expert" dialog box appears.
2.
Click Add Condition to add a new condition.
3.
Using the menus, set the formula conditions and choose a display color.
4.
Repeat steps 2 and 3 for any other conditions you want to add to your chart.
5.
Click OK.
The values specified by your condition are displayed in the color you selected.
Note:
• Conditional formatting is not available for every chart type.
• An area chart must have both Category and Series values for conditional formatting to appear.
• If your chart type is line, the chart must have data markers before you can see conditional formatting.
9.3.3 Trendlines
Trendlines show a graphical representation of trends in a data series. You can add trendlines to data
series in unstacked 2D Area, Bar, Bubble, Column, Line, Stock, Numeric Axis, Histogram, and Scatter
charts. You can draw Linear, Logarithmic, Polynomial, or Exponential trendlines. You can also draw a
Moving Average line that is a sequence of averages calculated from the data points in the series. A
moving average line smoothes the fluctuations in the data points in the series. Trendlines are not
available in Gantt, Gauge, Radar, Pie or Doughnut, and 3D charts.
9.3.3.1 To create a trendline
1.
Right-click an area, riser or marker on your chart, and click Format Series.
2.
In the dialog box, in the Trendline node, select the type of trendline.
A "Moving Average" trendline is calculated from the data points for the selected series. This trendline
smoothes the fluctuations in the data points and shows the pattern or trend.
3.
Type a value in the Order text box to specify the order of the trendline's curve. The options vary
depending on the trendline.
2011-05-06165
Charting

Note:
If you selected "Polynomial" as your trendline type, specify the degree of linear regression for the
polynomial trendline. It must be greater than one but no greater than the number of groups in the
chart.
4.
Type a value in the Period text box to specify the number of periods for the trendline.
5.
For all regression types except "Moving Average", select the Show Coefficient Values check box
to show the coefficient values that are used in the trendline.
6.
For all regression types except "Moving Average", select the Show Equation check box to show
the equation that is used in the trendline.
7.
In the Appearance section, set the color, style, and thickness of your trendline.
A trendline is added to the chart.
9.3.4 Dual Axis Charts
You can change the layout of a chart to include two numeric axes: a Primary Y1 axis and a Secondary
Y2 axis. The only charts that do not support dual axes are Gantt, Gauge, Histogram, Stock, Pie (or
Doughnut), and 3D.
When a dual axis layout is chosen, all the series in your chart will remain assigned to the Primary Y1
axis. You can use the Format dialog box to assign a series to the Secondary Y2 axis.
Note:
If the same chart is repeated across multiple pages in a report, all the charts will be affected by selecting
the Dual Axes option. All instances of the chart in the report will appear as dual axis charts.
9.3.4.1 To create a dual axis chart
1.
Right-click the chart and click Format Chart.
2.
On the "Selected Element" menu, select Total (Y) Axis.
3.
In the "Axes" section, select Dual Axes.
Note:
By default, all the series are assigned to the Primary Y1 Axis. You only need to change the axis
assignment of the series that you want assigned to the Secondary Y2 Axis.
4.
Close the Format dialog box.
5.
Right-click the series you want to move and select Format Series.
6.
In the "General" node, use the "Axis Assignment" menu to assign the series to the Primary Y1 axis
or the Secondary Y2 axis.
2011-05-06166
Charting

7.
Close the Format dialog box.
Your chart is now a dual axis chart. Use the Format dialog box to make any further formatting changes
to your chart.
Related Topics
• Editing charts
9.3.5 Auto-arranging charts
If you move or resize objects on the chart, select the Auto-Arrange check box so that Crystal Reports
automatically resets the chart objects to their original positions.
9.3.5.1 To auto-arrange a chart
1.
Right-click the chart and click Format Chart.
2.
In the dialog box, click the Chart section and select Auto-Arrange.
Crystal Reports automatically resets chart objects to their original positions when you resize or move
them on the report canvas.
2011-05-06167
Charting

2011-05-06168
Charting
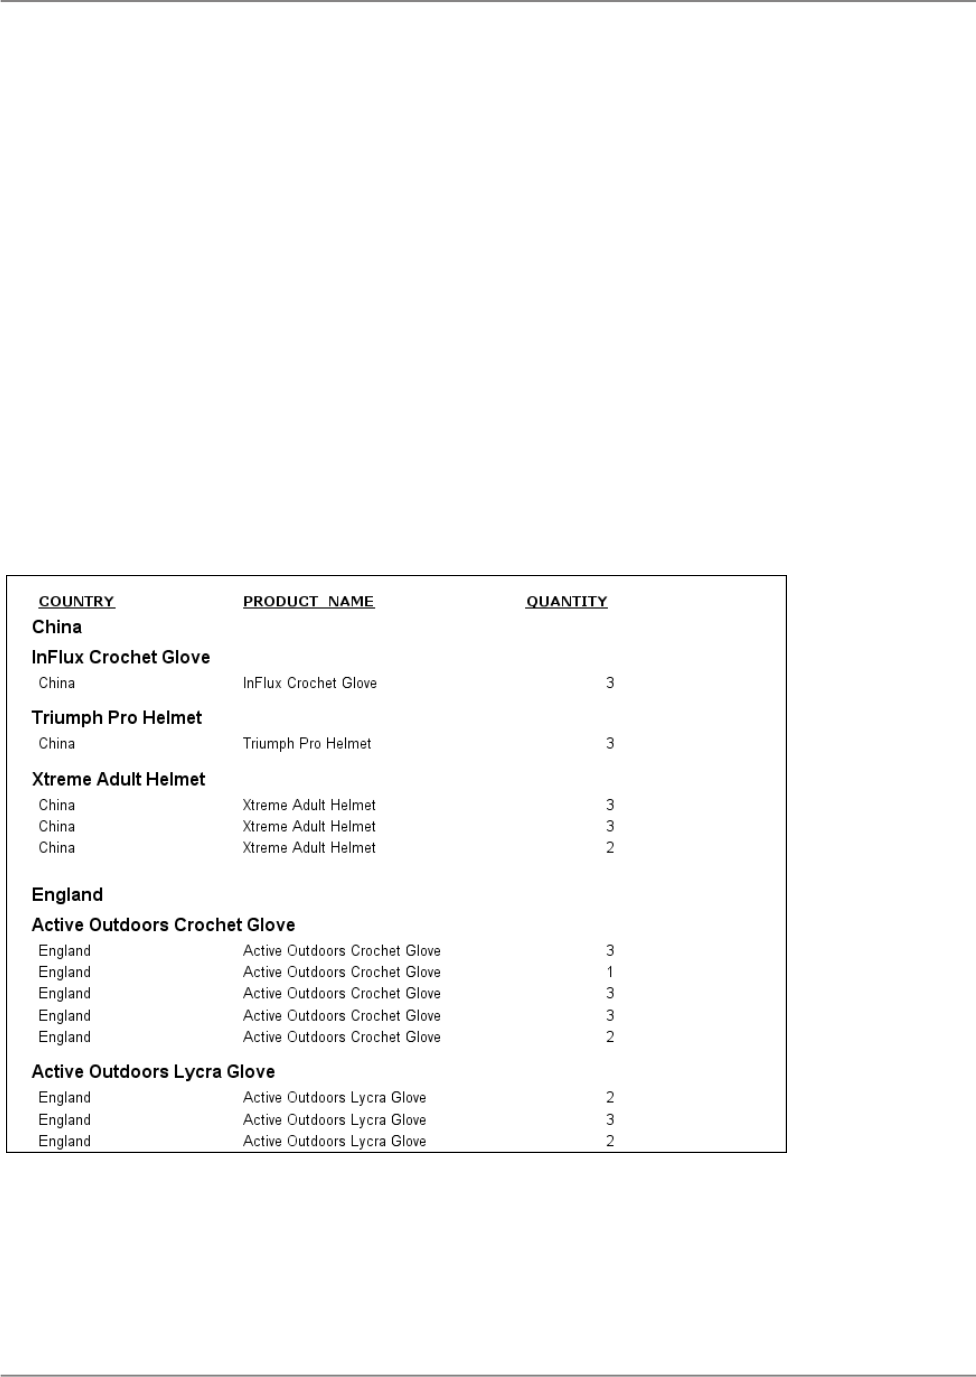
Cross-tabs
10.1 About Cross-tabs
A Cross-tab is a grid that displays values that are grouped and totaled in two directions. Data is presented
in a compact format, which makes it easier to compare data and identify trends.
For example, without a Cross-tab, a standard report grouped by region and by product will show the
quantities of a product sold for each region, but the data will be spread out and difficult to analyze, as
in the following figure.
A Cross-tab report displays the information in a compact format, making it easier to see the results.
2011-05-06169
Cross-tabs
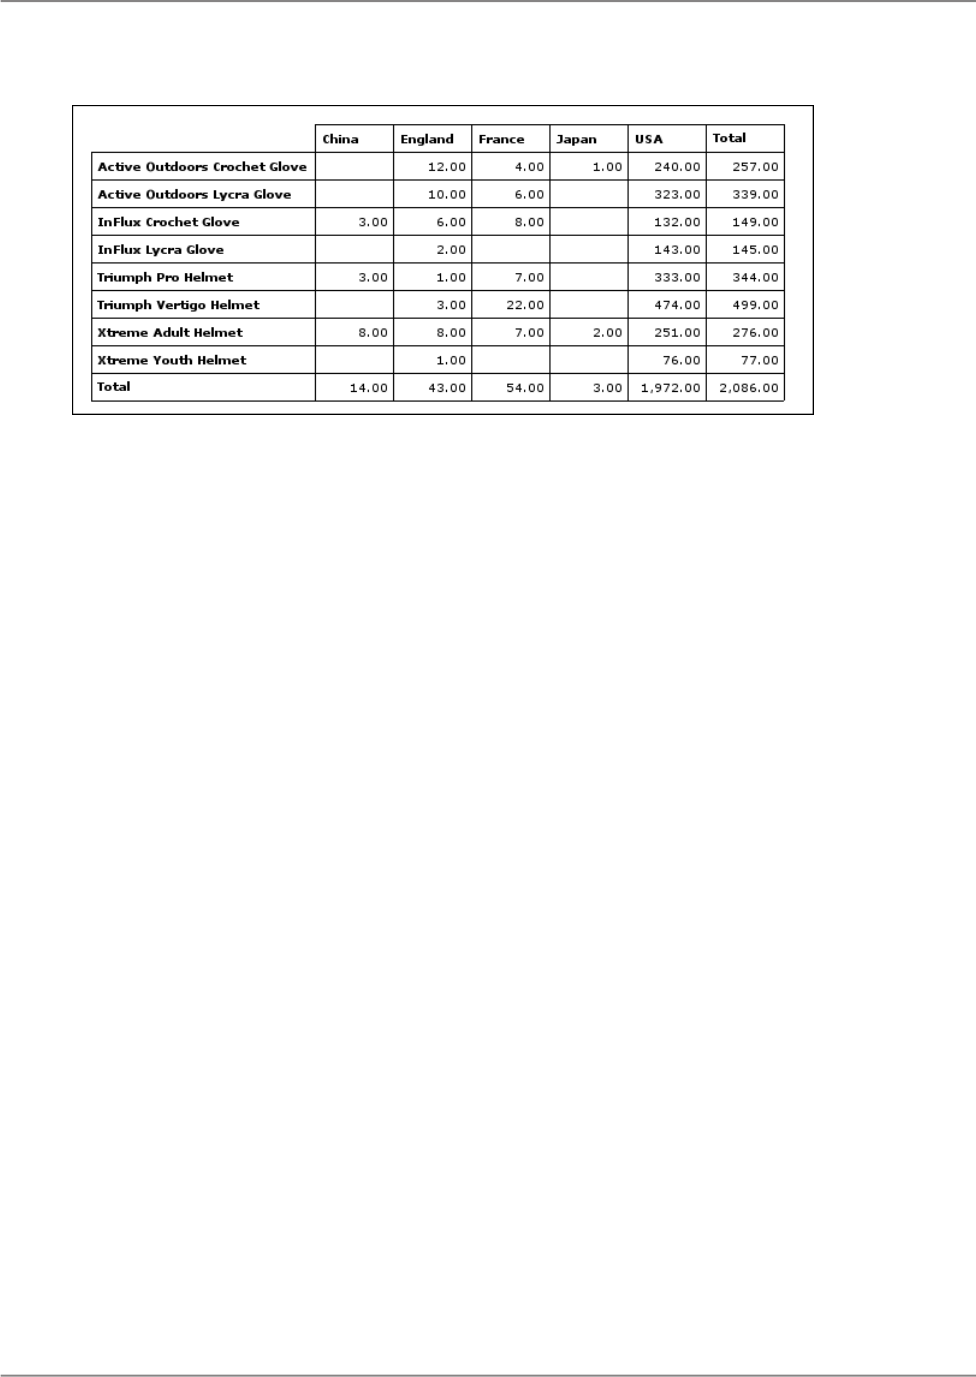
A Cross-tab includes row totals, column totals, and grand totals. The grand total is the value at the
intersection of the row total and the column total.
10.2 Adding a Cross-tab
You can create a Cross-tab in a new report or add a Cross-tab to an existing report. The following is a
list of things to keep in mind when using Cross-tabs:
• You can have multiple rows, columns, and totaled elements.
• You can use print-time formulas as your rows or columns.
• You can include a group sort (top or bottom N) on the rows in your Cross-tab.
Note:
Group sorting cannot be applied to columns.
• You can insert as many Cross-tabs in a report as you need.
• You can insert the Cross-tab into either the "Report Header" or "Report Footer" area, or the "Group
Header" or "Group Footer" area.
• You can place Cross-tabs in subreports. This is useful when you want to refer to results from another
report.
10.2.1 To add a Cross-tab
1.
On the "Insert" tab, click Cross-tab.
2.
From the "Column" list, select the object that you want to use for your column value.
3.
From the "Row" list, select the object that you want to use for your row value.
2011-05-06170
Cross-tabs

4.
From the "Total" list, select an operation, and then select the object that you want to use for the total.
5.
Click Insert.
An element frame appears with the mouse cursor.
6.
Place the element frame in the "Report Header", and click to release it.
Tip:
If your report has grouped information, you can place the Cross-tab in the "Group Header" or "Group
Footer".
10.3 Working with Cross-tabs
This section describes the ways you can work with a Cross-tab once you have added it to your report.
10.3.1 To show values as percentages
1.
Right-click a totaled element in a Cross-tab, and then click Format Total.
The Format dialog box appears.
2.
Click the Total option.
3.
Select Show as Percentage.
4.
From the Percentage From list, select Row or Column depending on whether you want your
percentage values to be calculated horizontally (row) or vertically (column).
Totaled element values are now displayed as percentages in your Cross-tab.
10.3.2 Printing Cross-tabs that span multiple pages
When you create a Cross-tab that is wider or longer than the specified page size, the program
automatically spans the printing across enough pages to accommodate the size of the Cross-tab. For
ease in reading, column headings will be repeated on subsequent pages. Row headings can also be
repeated using the "Repeat Row Labels" option.
10.3.2.1 To repeat row labels
2011-05-06171
Cross-tabs

1.
Right-click the blank top-left area of the Cross-tab, and click Grid Options.
The Format dialog box appears.
2.
Select Repeat Row Labels.
Note:
Crystal Reports lets you designate report elements that don't expand horizontally, such as text elements,
data elements, pictures, charts, lines, boxes, and so on, to be repeated on each additional horizontal
page that a Cross-tab creates.
Related Topics
• Repeating report elements on horizontal pages
10.4 Formatting Cross-tabs
10.4.1 To change the width, height, and alignment of Cross-tab cells
1.
Click a cell within the Cross-tab to activate the sizing handles.
2.
Drag one of the sizing handles to expand the width or height of the cell.
3.
On the "Format" tab, use the Font Alignment options to change the alignment of the data in the cell.
You can choose between left, right, center, and justified alignment.
Note:
Changing one cell affects all like cells. For example, changing the width of one total element cell changes
the width of all the other cells in the same row.
10.4.2 To format the background color of entire rows/columns
You can use background colors to emphasize certain rows or columns within your Cross-tab.
1.
Right-click the Cross-tab rows or columns and select Format Crosstab.
2.
Click the Appearance option.
3.
Select a color from the Fill list.
The row/column is formatted as specified.
2011-05-06172
Cross-tabs

10.4.3 To format elements individually
1.
Select the element you want to format.
2.
On the "Format" tab, edit the font, background, borders, numbering, and currency symbols.
The element is formatted as specified.
10.4.4 To format several elements at one time
1.
Press Ctrl + click to highlight the desired elements.
2.
On the "Format" tab, edit the font, background, and borders.
The elements are formatted as specified.
10.4.5 Hiding Cross-tab data
This section provides you with the steps required to hide data in your report. You can hide:
• Empty rows and columns.
• Row and column grand totals.
• Subtotals and their labels.
10.4.5.1 To hide empty rows and columns
1.
Right-click the blank top-left area of the Cross-tab, and click Grid Options.
The Format dialog box appears.
2.
Select either Hide Empty Rows or Hide Empty Columns.
When you print the report, empty rows and/or columns will not appear.
2011-05-06173
Cross-tabs

10.4.5.2 To hide row and column grand totals
1.
Right-click the blank top-left area of the Cross-tab, and click Grid Options.
The Format dialog box appears.
2.
Select either Hide Row Grand Totals or Hide Column Grand Totals.
10.4.6 Displaying totals from left to right
If you have two or more totals in your Cross-tab, you can display their values from left to right instead
of top to bottom (the default).
10.4.6.1 To display totals from left to right
1.
Right-click the blank top-left area of the Cross-tab and click Grid Options.
The Format dialog box appears.
2.
In the Total area, select Left to Right.
3.
Select Show Total Labels if you want to display labels for the totals.
Labels are displayed in the direction you chose for the totals.
4.
Click Close.
10.5 Advanced Cross-tab features
There are several ways to add even more information to your Cross-tabs. This section covers several
advanced Cross-tab features.
10.5.1 Displaying hierarchies in Cross-tabs
2011-05-06174
Cross-tabs

You can display rows or columns in a Cross-tab hierarchically. Displaying hierarchies in Cross-tabs is
useful if your Cross-tab includes hierarchy objects for the row or column values.
A new subtotal will be created for each level within the hierarchy. The subtotal will display the sum of
the values in the row immediately beneath it, it will not include the value for the hierarchical node itself.
Note:
Totaling across a hierarchy is not available within a crosstab.
Related Topics
• Quick reference to objects
10.5.1.1 To display hierarchies in Cross-tabs
In order to display hierarchies, you must select a hierarchy object for the row or column value when
you are setting up your Cross-tab.
Note:
If you select a hierarchy object that is also a delegated measure for the row or column value, the grand
total for that row or column will be hidden by default.
1.
Right-click a row or column in your crosstab, and click Format Element.
The Format dialog box appears.
2.
Expand the Row / Column option, and click Group.
3.
From the "Hierarchy Type" list, select External Hierarchy.
4.
Click Close.
The row or column headings in your Cross-tab are displayed hierarchically.
10.5.2 Calculated Members
Use Calculated Members to insert rows or columns to your Cross-tab. These rows or columns can
contain custom calculations (for example, the difference in sales between two regions) or can be used
entirely for formatting purposes (for example, inserting a blank row every three lines to increase
readability).
You have complete flexibility in designing your own calculation formulas and can choose whether they
appear only once or repeat regularly in the Cross-tab.
2011-05-06175
Cross-tabs

10.5.2.1 To add a Calculated Member to your Cross-tab
1.
Press Ctrl + click to highlight the two row or column headings you would like to use in your
Calculated Member.
For example, if you wanted to create a Calculated Member for the difference between Sales and
Sales Returns, the desired formula would be Sales - Sales Returns. In this example, you would
highlight the Sales and the Sales Returns headers.
2.
Right-click the highlighted headers, and click Insert Calculated Member.
A list of available operations appears:
• Sum
• Difference
• Product
• Quotient
3.
Select an operation.
In this example, you would select Difference.
A row or column that displays the results of the selected calculation is added to your Cross-tab.
Note:
The row or column is inserted directly under the second row or column heading that you highlighted.
10.5.2.2 To add a blank Calculated Member to your Cross-tab
• In your Cross-tab, right-click the header preceding the desired location of your blank Calculated
Member row or column, and then click Insert Calculated Member > Insert Blank.
A blank Calculated Member row or column is added to your Cross-tab.
10.5.2.3 To change the processing order of Calculated Members
1.
Right-click the top-left corner of your Cross-tab and click Format Crosstab.
The Format dialog box appears.
2.
Click the Advanced Calculations option.
2011-05-06176
Cross-tabs

3.
In the "Calculated Members" area, use the arrows to change the processing order of the Calculated
Members.
4.
Click Close to save your changes and return to your report.
The Cross-tab recalculates the values of the Calculated Members.
Note:
Changing the processing order of Calculated Members does not cause the data source to refresh.
10.5.2.4 Calculation Formulas
Calculation Formulas are mathematical formulas that Crystal Reports uses to determine values in
Calculated Member cells. You can design Calculation Formulas in the "Formula Workshop".
10.5.2.4.1 To insert a Calculation Formula
1.
Right-click the top-left corner of your Cross-tab and click Format Crosstab.
The Format dialog box appears.
2.
Click the Advanced Calculations option.
3.
In the "Calculated Members" area, click the Edit Calculated Member Formulas ( ) button, and
then select a calculated member from the list.
The "Formula Workshop" appears.
4.
Type the desired Calculation Formula.
For example, the following formula displays the difference between the value of Australia row and
the value of the Canada row:
GridValueAt(GetRowPathIndexOf("Australia"), CurrentColumnIndex, CurrentSummaryIndex) - GridValueAt(GetRow
PathIndexOf("Canada"), CurrentColumnIndex, CurrentSummaryIndex)
5.
Click Save and Close.
The Calculated Member displays the results of the new Calculation Formula.
Note:
Once you have created a Calculation Formula, you can edit it as follows: right-click the Caluclation
Formula, and click Edit Calculation Formula.
10.5.2.5 Header Formulas
Header Formulas determine the visible row or column header for a Calculated Member.
2011-05-06177
Cross-tabs

10.5.2.5.1 To edit a Header Formula
1.
Right-click the header of the Calculated Member you would like to edit, and click Calculated Member
> Edit Header Formula.
The "Formula Workshop" appears.
2.
Type the desired header name in the quotations.
Note:
You can also control your header to be displayed based on a formula that you specify. A Header
Formula must return a string.
3.
Click Save and Close to return to your report.
The Calculated Member header displays the result of the Header Formula.
10.5.2.6 Group Value Formulas
If you want to reference a Calculated Member in a formula, you must assign a value to it. Group Value
Formulas are used to assign values to Calculated Members.
Note:
Group Value Formulas are not supported for OLAP universes.
10.5.2.6.1 To edit a Group Value Formula
1.
Right-click the header of the Calculated Member you would like to edit, and click Calculated Member
> Edit Group Value Formula.
The "Formula Workshop" appears.
2.
Type your desired value.
Note:
You can also control your value to be displayed based on a formula that you specify. A Group Value
Formula must be of the same type as the row/column grouping object that it is inserted into.
3.
Click Save and Close to return to your report.
The Calculated Member retains the result of your Group Value Formula.
Note:
If you have not edited the Header Formula of a Calculated Member, the visible header displays the
result of the Group Value Formula. When you edit the Header Formula, it overrides the Group Value
Formula as the visible header.
2011-05-06178
Cross-tabs

10.5.2.7 Insertion Formulas
Insertion Formulas determine where a Calculated Member appears in a Cross-tab. In most cases, a
Calculated Member appears only once. However, you can set it to appear in multiple locations or in a
repeating pattern.
10.5.2.7.1 To edit an Insertion Formula
1.
Right-click the header of the Calculated Member you would like to edit, and click Calculated Member
> Edit Insertion Formula.
The "Formula Workshop" appears.
2.
Type your desired formula.
For example, the following formula inserts a Calculated Member after the country object for Canada:
GetColumnGroupIndexOf(CurrentRowIndex) = 1 and GridRowColumnValue("Customer.Country") = "Canada"
3.
Click Save and Close to return to your report.
The Calculated Member appears in the locations specified by the Insertion Formula.
10.5.3 Embedded Totals
You can add an additional calculation to your Cross-tab by inserting an Embedded Total.
Unlike Calculated Members, Embedded Totals do not add new rows or columns to your Cross-tab.
Instead, they cause additional calculations to appear within each cell of the Cross-tab.
For example, in a report showing regional sales, you could insert a calculation for each region that
shows the percentage of total sales for the country.
10.5.3.1 To add an Embedded Total to your Cross-tab
1.
In your Cross-tab, right-click any cell (except a header), and click Embedded Total > Insert
Embedded Total .
A blank Embedded Total appears in the Cross-tab.
2.
Right-click the total, and then click Embedded Total > Edit Embedded Total Formula.
The "Formula Workshop" appears.
2011-05-06179
Cross-tabs

3.
Type the desired embedded total formula.
4.
Click Save and Close.
The Embedded Total displays the results of the new Embedded Total Formula.
10.5.3.2 To change the processing order of Embedded Totals
If you have multiple Embedded Totals in your Cross-tab, the order in which they are calculated can
affect your results.
1.
Right-click the top-left corner of your Cross-tab and select Format Cross-Tab.
The Format dialog box appears.
2.
Click the Advanced Calculations option.
3.
In the "Totals" area, click the arrows to change the processing order of the totals.
4.
Click Close to save your changes and return to your report.
The Cross-tab recalculates the values of the Embedded Totals in the new processing order.
Note:
Changing the processing order of Embedded Totals does not cause the data source to refresh.
2011-05-06180
Cross-tabs

Saving, Exporting, Printing, and Viewing Reports
This section provides you with information about how to save reports, distribute reports by exporting
or printing, and view reports.
11.1 Saving reports
Crystal Reports lets you save reports to a file system on your computer. It also gives you the option of
saving reports with no data.
For information on saving reports to SAP BusinessObjects Business Intelligence platform, see Distributing
reports.
11.1.1 To save a report to your local computer
1.
The process for saving a report to your local computer is different if you are logged into the BI
platform.
• If you are not logged in to the BI platform, click File > Save.
• If you are logged in to the BI platform, click File > Save as a local file.
2.
In the "Save as" dialog box, browse for the location you want to save your report to.
3.
Enter a name for your report (.rpt) file.
4.
Click Save.
The report is saved to the location you selected.
Note:
Click File > Save as to save a report with a new name.
11.1.2 To save a report with no data
2011-05-06181
Saving, Exporting, Printing, and Viewing Reports

You may want to save a report without data if you want to re-use the report design with different data.
1.
Click File.
2.
Clear the Save Data With Report option.
The data will not be saved with the report when you save it to a file system or publish it to the BI platform
server.
11.2 Distributing reports
Crystal Reports lets you distribute your report in a number of ways.
11.2.1 Distributing reports through SAP BusinessObjects Business Intelligence
platform
One way to distribute your reports is through SAP BusinessObjects Business Intelligence platform.
When you publish a report to the BI platform, you can deliver it to end users via any web
application—intranet, extranet, Internet, or corporate portal.
11.2.1.1 To connect to an SAP BusinessObjects Business Intelligence platform
server
1.
Click File > Log On to SAP BusinessObjects Enterprise.
2.
Select your server on the Server Connections list box, or select Options > Specify new server
below and save to add a new server.
3.
Enter the connection information and click OK.
The server is added to the designer. You can now open and save reports to the server without having
to re-enter your connection information every time you do so.
11.2.1.2 Editing managed reports
To edit a report that is on your SAP BusinessObjects Business Intelligence platform system, connect
to the SAP BusinessObjects Business Intelligence platform server.
2011-05-06182
Saving, Exporting, Printing, and Viewing Reports

11.2.1.2.1 To open a managed report from an SAP BusinessObjects Business Intelligence platform
folder
1.
If you are not already logged on to the BI platform, click File > Log On to SAP BusinessObjects
Enterprise, enter your connection information, and then click OK.
2.
Click File > Open From <Server Name>.
Note:
In these steps, <Server Name> represents the connection server name given in the server connection
dialog box.
3.
In the "Open Report from <Server Name>" dialog box, browse for the report you want to open.
4.
When you have selected a report, click Open.
The report opens in Crystal Reports. Once you have made your changes, you need to save the report
to the server to save your changes online.
11.2.1.3 Publishing reports to SAP BusinessObjects Business Intelligence platform
Crystal Reports lets you distribute reports by publishing them to an SAP BusinessObjects Business
Intelligence platform server.
11.2.1.3.1 To publish a report to SAP BusinessObjects Business Intelligence platform
1.
If you are not already logged on to the BI platform, click File > Log On to SAP BusinessObjects
Enterprise, enter your connection information, and then click OK.
2.
Click File > Save.
3.
In the "Save Report to [Server Name]" dialog box, navigate to the location that you want to save
your report to.
Note:
In these steps, [Server Name] represents the name of your SAP BusinessObjects Business
Intelligence platform server.
4.
Type a display name in the Display Name box.
5.
Click Save.
A dialog box appears with a message that your report has been successfully published to SAP
BusinessObjects Business Intelligence platform.
11.2.2 Emailing reports
Crystal Reports lets you distribute your reports using email.
2011-05-06183
Saving, Exporting, Printing, and Viewing Reports

11.2.2.1 To email a report
1.
Click File > Attach to Email.
If you have an email client installed on your machine, Crystal Reports launches it and creates an
email with a temp copy of your report as an attachment.
Note:
Only a temp copy is saved. Crystal Reports will not save any changes to the original .rpt file.
2.
Enter the email address or addresses of your recipient(s) and any other information that you want
to add, and then click Send.
An email containing the report is sent to the recipient(s).
11.2.3 Exporting a report
Finished reports can be exported to a number of popular formats, such as XML, PDF, HTML,
spreadsheets and word processors, and other common data interchange formats. This makes the
distribution of information easier. For example, you may want to use the report data to enhance the
presentation of data in a desktop publishing package.
The exporting process requires you to specify a format and a destination. The format determines the
file type, and the destination determines where the file is located.
11.2.3.1 To export a report
1.
While in the "Page" mode, click File > Export and select an export format from the list.
The" Export Options" dialog box appears.
2.
Select the export options.
Note:
The Page Range option is not available for Microsoft Excel (97-2003) Data-Only, Microsoft Excel
Workbook Data-Only, Crystal Reports, Commar-Separated Values and XML formats.
3.
Click OK.
4.
In the "Export Destination" dialog box, do one of the following:
• Click To File and enter the report title to save the exported report in the "Export Report" dialog
box.
2011-05-06184
Saving, Exporting, Printing, and Viewing Reports

• Click To Application to open the report in the selected application without saving it.
11.2.3.2 Export format types
The export formats supported by Crystal Reports can be broadly categorized in two groups: page-based
formats and record-based formats.
Page-based formats tend to produce a more exact output. The emphasis of these formats is structure
representation and formatting. Formatting refers to attributes such as font style, text color, text alignment,
background color, and so on. Structure refers to element position, element size, and the relationship
between these attributes and other elements. Depending on the format you choose, it may not be
possible for the program to preserve all structure and formatting perfectly, but page-based formats, in
general, preserve these properties as closely as possible.
With record-based formats, the emphasis is on data rather than the structure and formatting. However,
in some formats you will notice that some formatting is exported. Some of the record-based formats
are only data-exchange formats.
Microsoft Excel (97-2003) Data-Only
Microsoft Excel (97-2003) Data-Only is a record-based format that concentrates on data. This format
does export most of the formatting, however, it does not merge cells; each element is added to only
one cell. This format can also export certain kinds of summaries as Excel functions. The summaries
that are supported are SUM, AVERAGE, COUNT, MIN and MAX.
Microsoft Excel (97-2003)
Microsoft Excel (97-2003) Page-based format converts your report contents into Excel cells on a
page-by-page basis. Contents from multiple pages are exported to the same Excel worksheet. If a
worksheet becomes full and there is more data to export, the export program creates multiple worksheets
to accommodate the data. If a report element covers more than one cell, the export program merges
cells to represent a report element. Microsoft Excel has a limit of 256 columns in a worksheet; therefore,
any report element (or part of it) that is added to cells beyond 256 columns is not exported. This export
format retains most of the formatting, but it does not export line and box elements from your report.
Note:
The page-based Excel format in Crystal Reports for Enterprise does not exhibit the same behavior as
the page-based Excel format in Crystal Reports 2010. The following are the main categories of known
differences between the two versions:
• Unsupported elements:
The Crystal Reports for Enterprise Java runtime engine does not support all the elements that can
be embedded in a report. For example, OLAP Grids and Map elements are not supported.
The horizontal alignment of these unsupported elements is not respected in the Java runtime engine.
• Character rendering:
2011-05-06185
Saving, Exporting, Printing, and Viewing Reports

The character rendering technology differs between Crystal Reports for Enterprise and Crystal
Reports 2010. This means that the size of each individual character can have slight differences (1
pixel) that add up over time and create additional rows or columns.
• Cross-tabs:
• When cross-tab elements are in repeated sections - for example, the Group Header - enhanced
exporting functionality output will be different between Crystal Reports for Enterprise and Crystal
Reports 2010. This behavior also applies to cross-tabs that are embedded in subreports.
• When cross-tab elements are overlapped, enhanced exporting functionality output will be different
between Crystal Reports for Enterprise and Crystal Reports 2010.
• Page breaks:
Page breaks are displayed differently between Crystal Reports for Enterprise and Crystal Reports
2010 since the products use different rendering technologies.
• Charting:
Crystal Reports for Enterprise and Crystal Reports 2010 use different underlying charting engines.
This can create slightly different looking chart output.
Microsoft Excel Workbook Data-Only
Microsoft Excel Workbook Data-Only is a record based format that concentrates on data as well. This
exporting format is an enhancement on the existing Microsoft Excel Workbook Data-Only exporting
type. The exported result of this format is an XLSX file. XSLX file format is an XML based open document
format introduced and supported by Microsoft Excel 2007 and later. With the Microsoft Excel Workbook
Data-Only format, limitations of previous XLS file formats are moved, approximately 65536 rows and
256 columns.
Microsoft Word (97-2003)
The Microsoft Word (RTF) format is a page-based format, but not all of the report's structure and
formatting options are preserved in the output. Microsoft Word is a page-based, exact format that
produces an RTF (Rich Text Format) file. The exported file contains text and drawing objects to represent
report objects. Individual objects are placed in text frames. This format is intended for use in applications
such as fill-out forms where the space for entering text is reserved as empty text objects. Almost all of
the formatting is retained in this export format.
Microsoft Word (97-2003) - Editable
The Microsoft Word - Editable format is different from the Microsoft Word format; it is a page-based
format, but not all of the layout and formatting properties are preserved in the output. This format
converts all of the report object contents to text lines. Unlike Microsoft Word format, this format does
not use text frames. Text formatting is retained, but attributes such as background color and fill pattern
may not be retained. All of the images in your report are inlined with the textual content. Therefore, the
images automatically shift to accommodate the text when the document is edited in Microsoft Word.
This format does not export line and box objects from your report. Also, the Predefined Objects: Page
Number and Page N of M do not work when exported in this format. The Microsoft Word - Editable
format has an option to insert page breaks at the end of each report page. This option may not correspond
to the page breaks created by Microsoft Word; the option is used mainly to separate your report-page
contents.
2011-05-06186
Saving, Exporting, Printing, and Viewing Reports

Adobe Reader (PDF)
Adobe Reader format is a page-based format. The exported documents are intended for printing and
redistribution. Acrobat format will export both structure and formatting in a manner that is consistent
with how the report looks on the Page tab. Acrobat format embeds the TrueType fonts that appear in
the document. (Non-TrueType fonts are not supported.) This export format does not support Microsoft
font-linking technology—which is used to provide support for some extended character sets such as
Chinese HKCS. Therefore, the fonts used in the report must contain all of the required glyphs. These
URI types are supported for hyperlinks: "http:", "https:" and "mailto:".
Separated Values (CSV)
The Character-Separated Values (CSV) format is a record-based, data-exchange format. It exports the
report element contents as a set of values separated by a comma.
Like record-style formats, the CSV format also creates one line of values for each record in your report.
A record contains all of the elements in each section of your report as seen in the "Structure" mode.
That is, elements in the "Report Header" section are exported first, followed by the "Page Header"
section, the "Group Header" section, the "Body" section, the "Group Footer" section, the "Report Footer"
section, and finally, the "Page Footer" section.
Note:
• The CSV format cannot be used to export reports with cross-tabs; nor can it be used to export reports
with subreports in "Page Header" or "Page Footer" sections.
• Standard Mode of the "Separated Values" format respects conditional suppression but only for report
content. The data is suppressed, but a row is printed in the report with the field delimiters. For
example, if your field delimiter is a comma and your report has four columns, you will see a blank
row that contains four commas.
Rich Text Format (RTF)
The Rich Text Format (RTF) format is similar to the Microsoft Word (RTF) format.
Report Definition
The Report Definition format exports your report to a text file that contains a brief description of the
report's design view.
XML
XML is used primarily for data exchange. It is a record-based format that uses the Crystal XML Schema.
The XML Expert in Crystal Reports can be used to customize the XML output.
Plain Text (Page Based)
Plain Text (Page Based) Text format is a page-based format in SAP Crystal Reports for Enterprise. It's
different from the Text exporting format in Crystal Reports 2011, which is a record based exporting
format.
Tab Separated Text (Page Based)
The Tab Separated Text (Page Based) format is similar to the Plain Text (Page Based) format. It is
also a page-based exporting format, different from the Tab Separated Text exporting format in Crystal
Reports 2011, which is record-based. TTX files can be opened in Microsoft Excel.
2011-05-06187
Saving, Exporting, Printing, and Viewing Reports
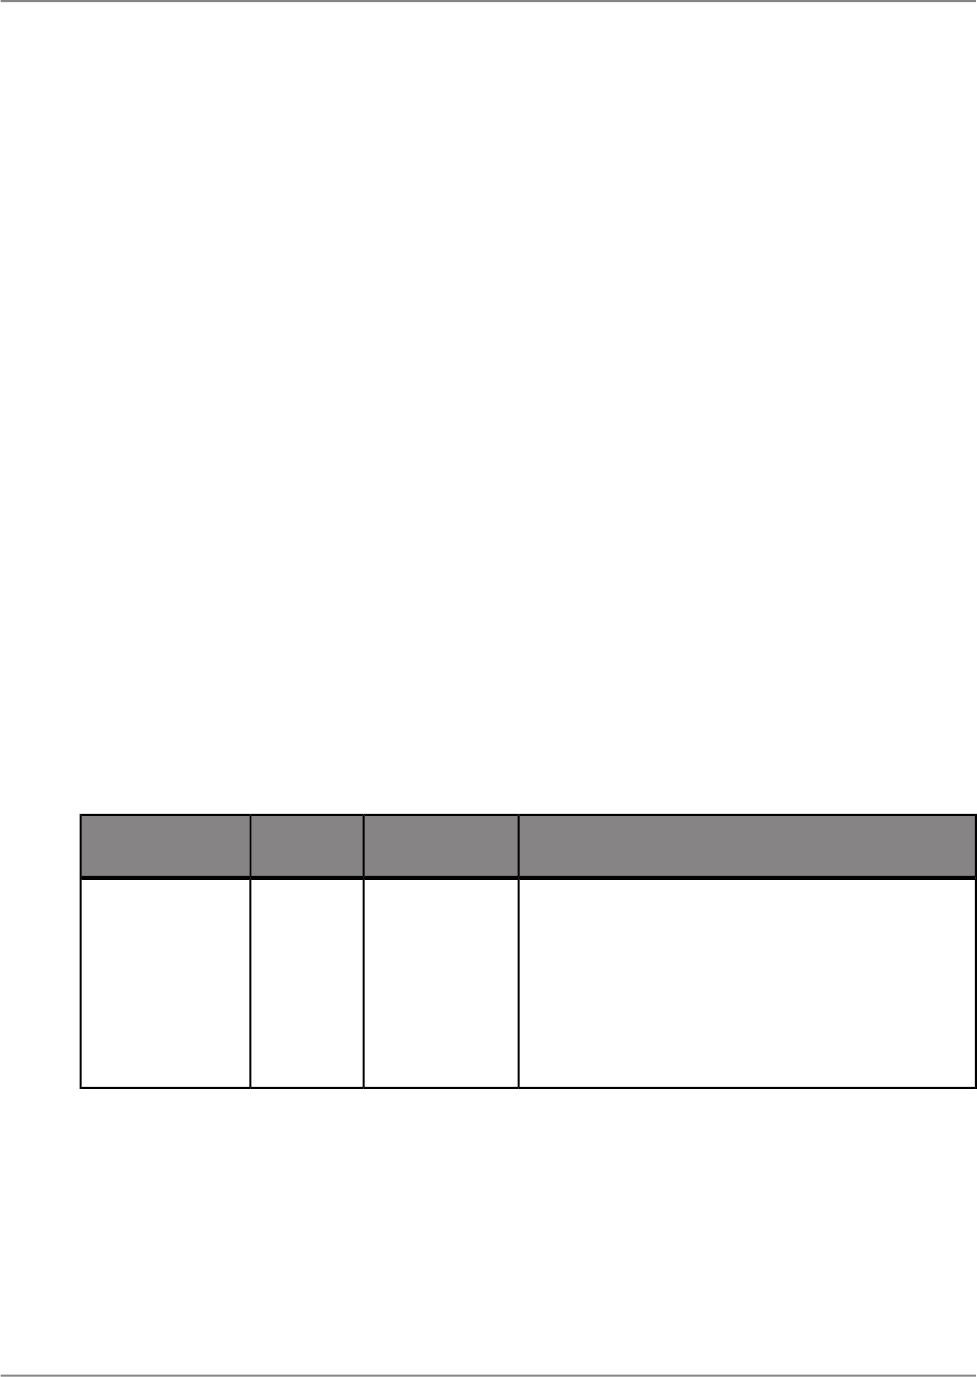
HTML 4.0
HTML export formats are page based. The HTML 4.0 format preserves the layout and formatting of the
report by using DHTML.
Managing XML Exporting Formats
Crystal Reports contains a built-in schema for exporting reports in XML format. Crystal Reports XML,
is a format to produce exported XML that are easy to transform into other formats using XSLT.
Using the XML Exporting Format Manager, you can set this schema to be the default schema used
when exporting reports in the XML format.
If you want to create a different file format (XML with a different schema or a different text-based file
type) from a report, there are industry standard schemas, such as XBRL or HL7 you can apply to the
Crystal Reports report data. In this case, use the XML Export Format Manager to import your XSLT
into the report, and optionally set it as the default XML format when formatting the report during XML
export.
11.2.3.3 Export configuration properties in SAP Crystal Reports for Enterprise
You can specify export configuration properties in Crystal Reports. Specifications include setting a
"Property Name", "Value Type", and "Value".
The following tables include available export configuration properties:
Table 11-1: Microsoft Excel (97-2003) Data-Only
Property Purpose and Value DescriptionValue
Value
Type
Property Name
Text
The property determines whether or not to include
Page Headers and Page Footers in the exported
file.
• If True: The header appears once at the top of
your spreadsheet and the footer appears once
at the bottom.
• If False: The header and footer do not appear.
True
False
String
Export.XLS-
DATAONLY.Ex
portPageHeader
Footer
2011-05-06188
Saving, Exporting, Printing, and Viewing Reports
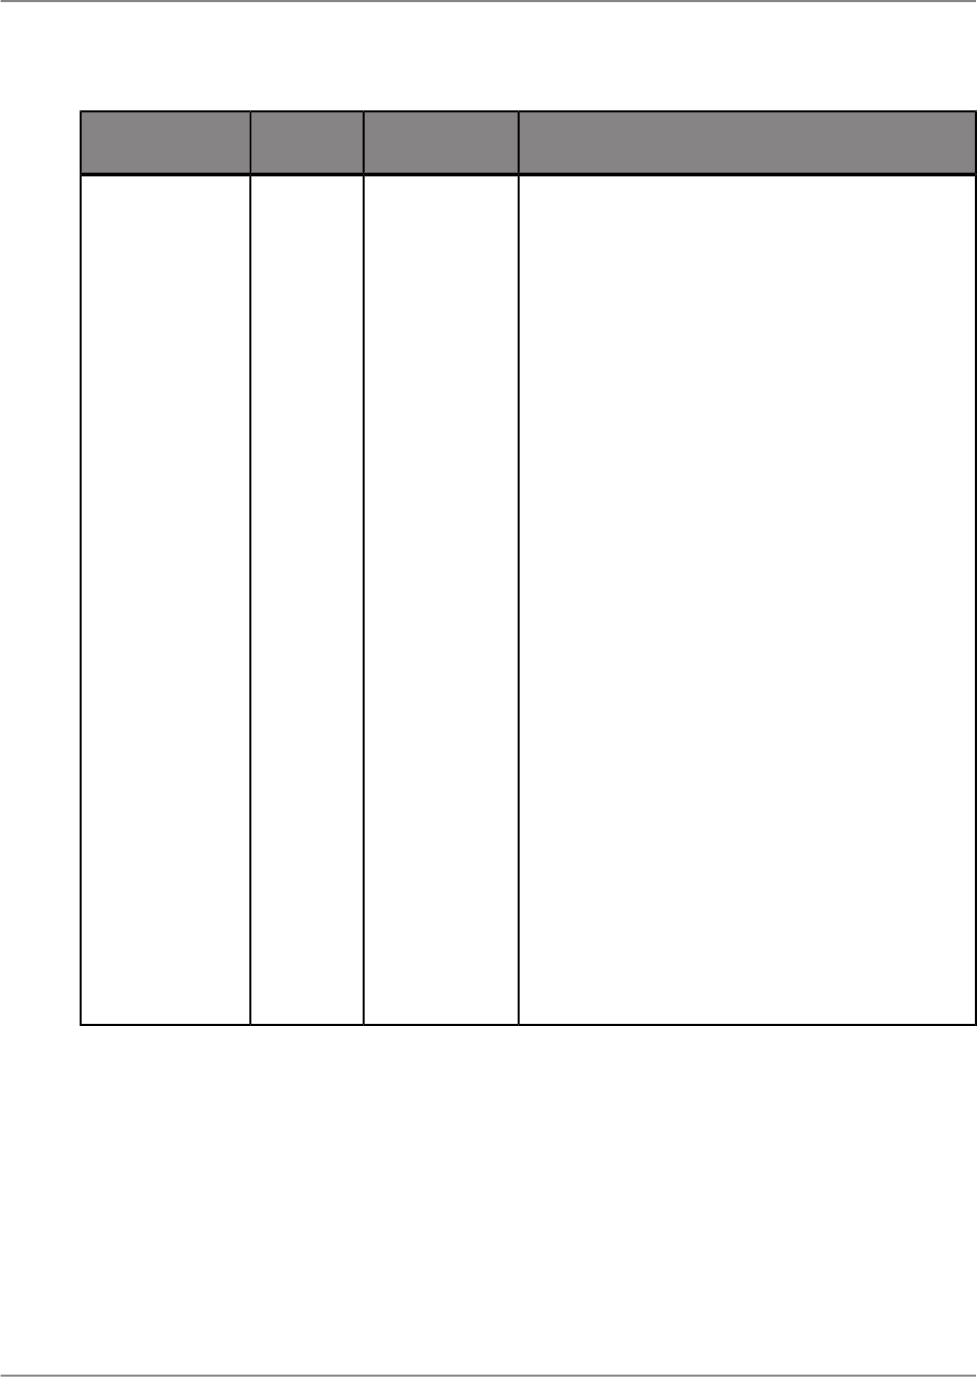
Property Purpose and Value DescriptionValue
Value
Type
Property Name
Text
The property determines the Crystal Reports col-
umn width in the exported spreadsheet to be based
on specified report objects.
• Whole Report: The column width in the export-
ed spreadsheet is based on objects found in
any section of your report.
Note:
The export spreadsheet layout is likely not to
be consistent with the layout in Crystal Reports.
• Report Header: The column width in the export-
ed spreadsheet is based on objects found in
the Report Header section only.
• Page Header: The column width in exported
spreadsheet is based on objects found in the
Page Header section only.
• Group Header: The column width in the export-
ed spreadsheet is based on objects found in
the Group Header section only.
• Body: The column width in the exported
spreadsheet is based on objects found in the
Body section only.
• Group Footer: The column width in the exported
spreadsheet is based on objects found in the
Group Header section only.
• Page Footer: The column width in the exported
spreadsheet is based on objects found in the
Page Footer section only.
• Report Footer: The column width in the export-
ed spreadsheet is based on objects found in
the Report Footer section only.
255: Whole re-
port
1: Report
Header
2: Page Head-
er
3: Group Head-
er
Note:
If ColumnWidth-
GroupNumber
is <= 0, than
ColumnWidth-
GroupNumber
will be set to 1.
4: Body
5: Group Foot-
er
Note:
If ColumnWidth-
GroupNumber
is <= 0, than
ColumnWidth-
GroupNumber
will be set to 1.
7: Page Footer
8: Report Foot-
er
String
Export.XLS-
DATAON
LY.ColumnWidth
BaseArea
2011-05-06189
Saving, Exporting, Printing, and Viewing Reports

Property Purpose and Value DescriptionValue
Value
Type
Property Name
Text
The property determines the Crystal Reports col-
umn width in the exported spreadsheet based upon
the Group Header or Group Footer.
Note:
This configuration property will only take effect if
the value of ColumnWidthBaseArea is 3:Group
Header or 5:Group Footer.
• The column width in the exported spreadsheet
will be based on the objects found only in the
Group Header section or Group Footer section
of the report
If >=1 then de-
fault = 1
String
Export.XLS-
DATAON
LY.ColumnWidth
GroupNumber
The property determines whether or not to export
any images that are present in your report.
• If True: The images present in the report will
be exported to the spreadsheet.
• If False: The images present in the report will
not be exported to the spreadsheet.
True
False
String
Export.XLS-
DATAONLY.Ex
portImagesIn
DataOnly
The property determines whether or not to maintain
the relative position of the result objects in the ex-
ported spreadsheet.
• If True: The relative position of the result objects
are maintained in the spreadsheet.
• If False: The relative position of the result ob-
jects are not maintained in the spreadsheet.
True
False
String
Export.XLS-
DATAON-
LY.MaintainRela-
tiveObjectPosi-
tion
(Deprecated)
2011-05-06190
Saving, Exporting, Printing, and Viewing Reports
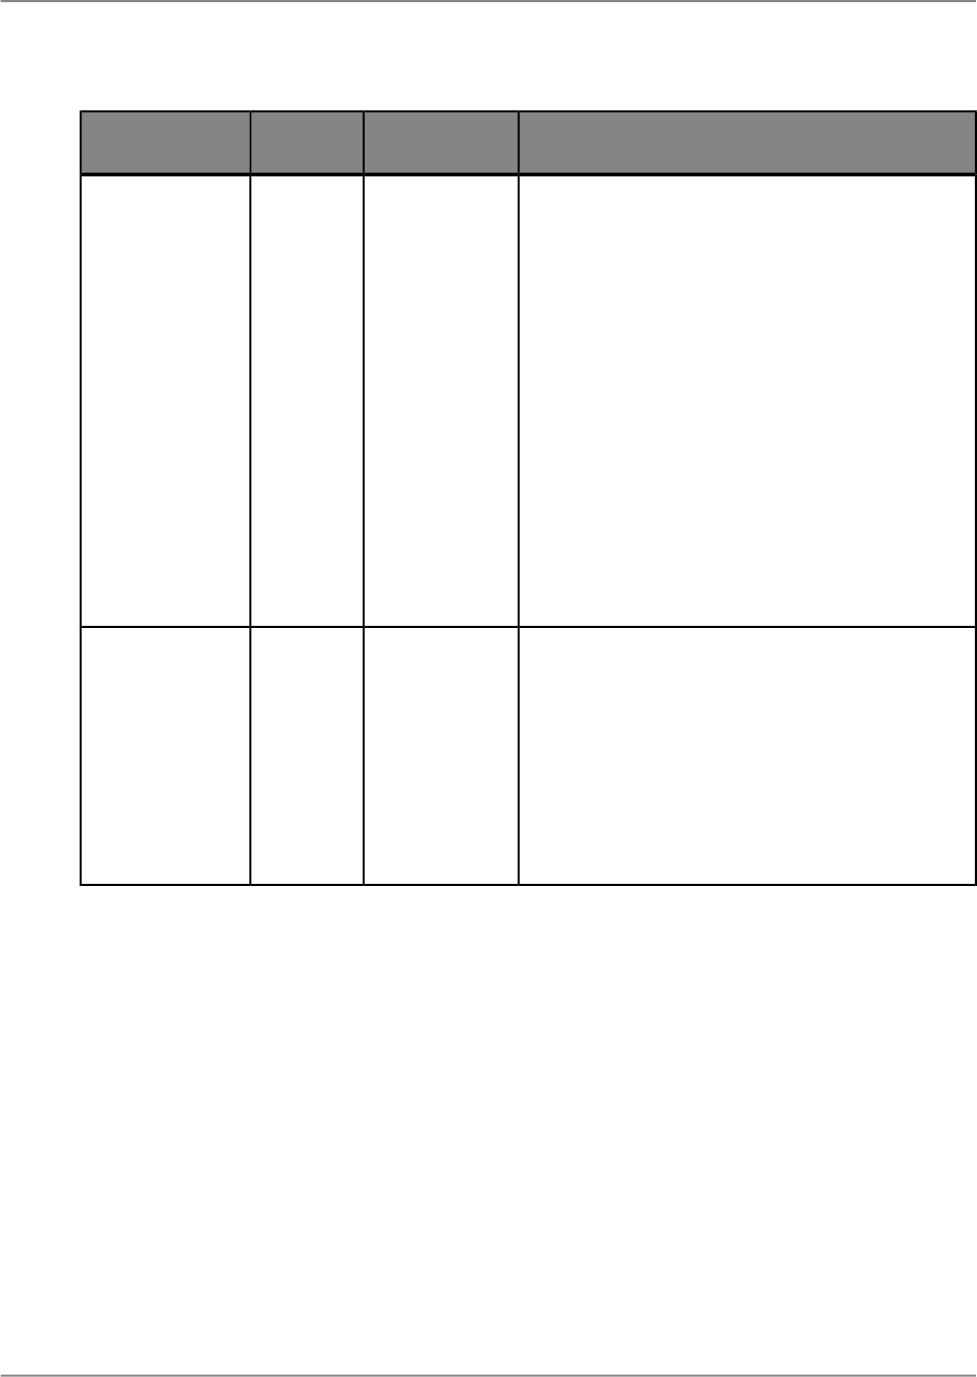
Property Purpose and Value DescriptionValue
Value
Type
Property Name
Text
The property determines whether or not to align
objects and corresponding totals in the same Excel
column.
Note:
This configuration property effects only when
"Maintain Relative Object Position" is true.
• If True: The objects and their corresponding
totals are forced to align in the exported
spreadsheet.
Note:
The column width of the object and total will be
10.
• If False: The objects and their corresponding
totals will be placed freely and it is likely that
they will be placed into different columns.
True
False
String
Export.XLS-
DATAON
LY.Maintain
ColumnAlign
ment
The property determines whether or not to maintain
the formatting information applied on the report
objects.
• If True: The formatting information applied on
the report objects will be kept in the exported
spreadsheet.
• If False: The formatting information applied on
the report objects will not be kept in the export-
ed spreadsheet.
True
False
String
Export.XLS-
DATAONLY.Use
FormatInDataOn
ly
2011-05-06191
Saving, Exporting, Printing, and Viewing Reports
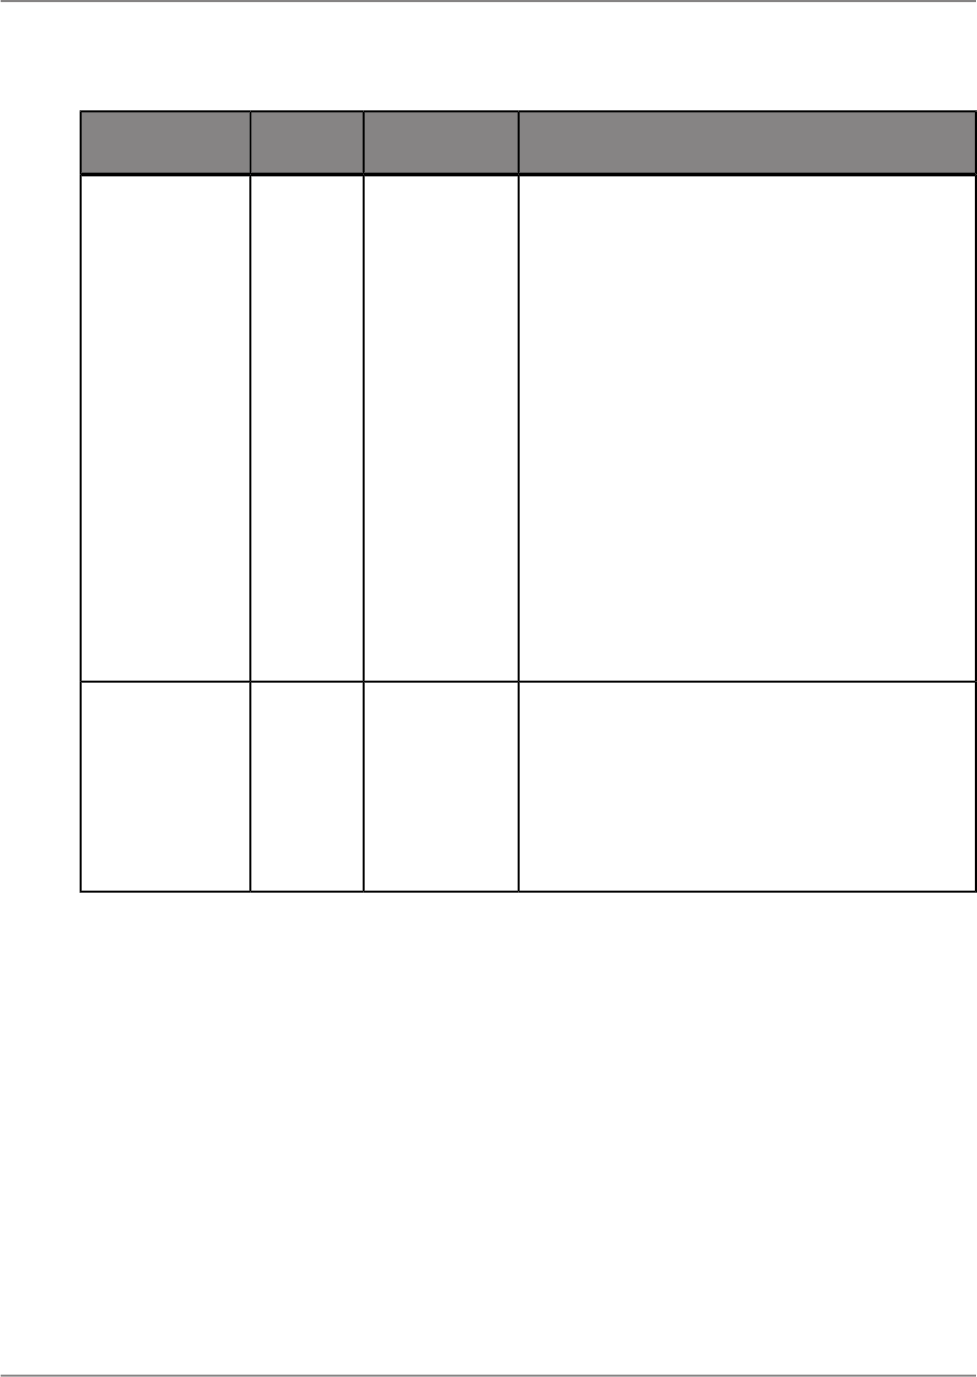
Property Purpose and Value DescriptionValue
Value
Type
Property Name
Text
The property determines whether or not to wrap
the text in the exported spreadsheet.
Note:
This configuration property will only effect under
the following conditions:
1.
String Field Object: The configuration property
will effect when "export element formatting" is
true.
2.
Text Object: The configuration property will ef-
fect when "export element formatting" is true
and "maintain relative object position" is true.
Otherwise, the default behavior will always wrap
the text.
• If True: The text will be wrapped in the exported
spreadsheet.
• If False: The text will not be wrapped in the ex-
ported spreadsheet.
True
False
String
Export.XLS-
DATAON
LY.WrapTextIn
DataOnly
The property determines whether or not to simplify
the report Page Header in the exported spread-
sheet.
• If True: The Page Header in the exported
spreadsheet will be simplified.
• If False: The Page Header in the exported
spreadsheet will not be simplified.
True
False
String
Export.XLS-
DATAONLY.Sim
plifyPageHeader
2011-05-06192
Saving, Exporting, Printing, and Viewing Reports
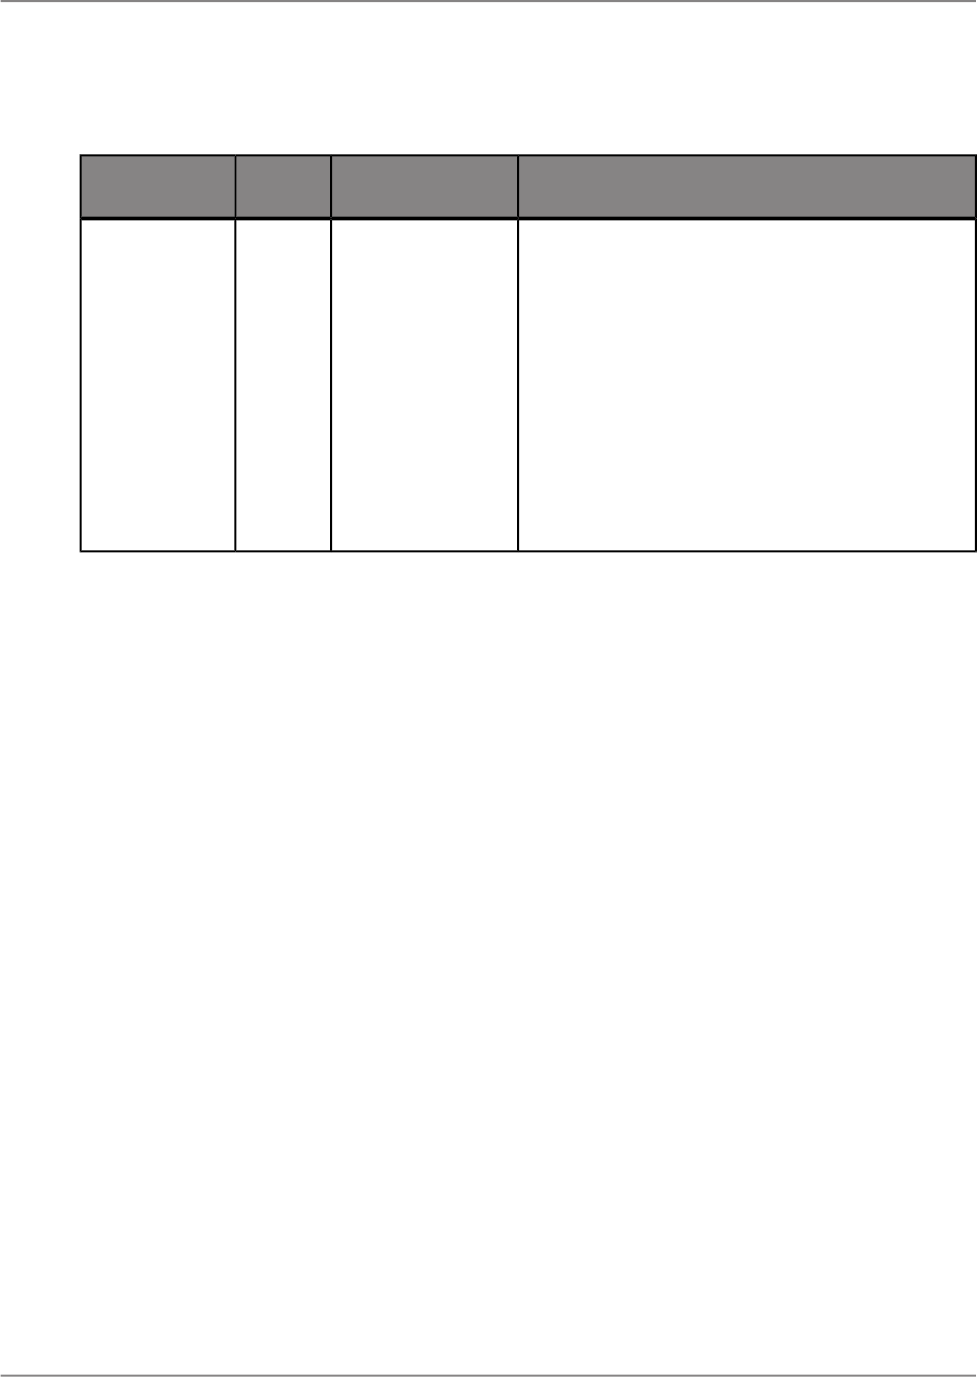
Table 11-2: Microsoft Excel (97-2003)
Property Purpose and DescriptionValue
Value
Type
Property Name
Text
The property determines whether or not to export
the Page Header and Page Footer sections of your
report.
• If None: The report page header and footer do
not appear.
• If Once per report: The report page header ap-
pears once at the top of your spreadsheet and
the footer appears once at the bottom.
• If On each page: The report page header and
footer appear repeatedly throughout the
spreadsheet in relation to the pagination of the
data in your report.
1: None
2: Once per report
3: On each page
String
Ex
port.XLS.PageArea
ExportType
2011-05-06193
Saving, Exporting, Printing, and Viewing Reports
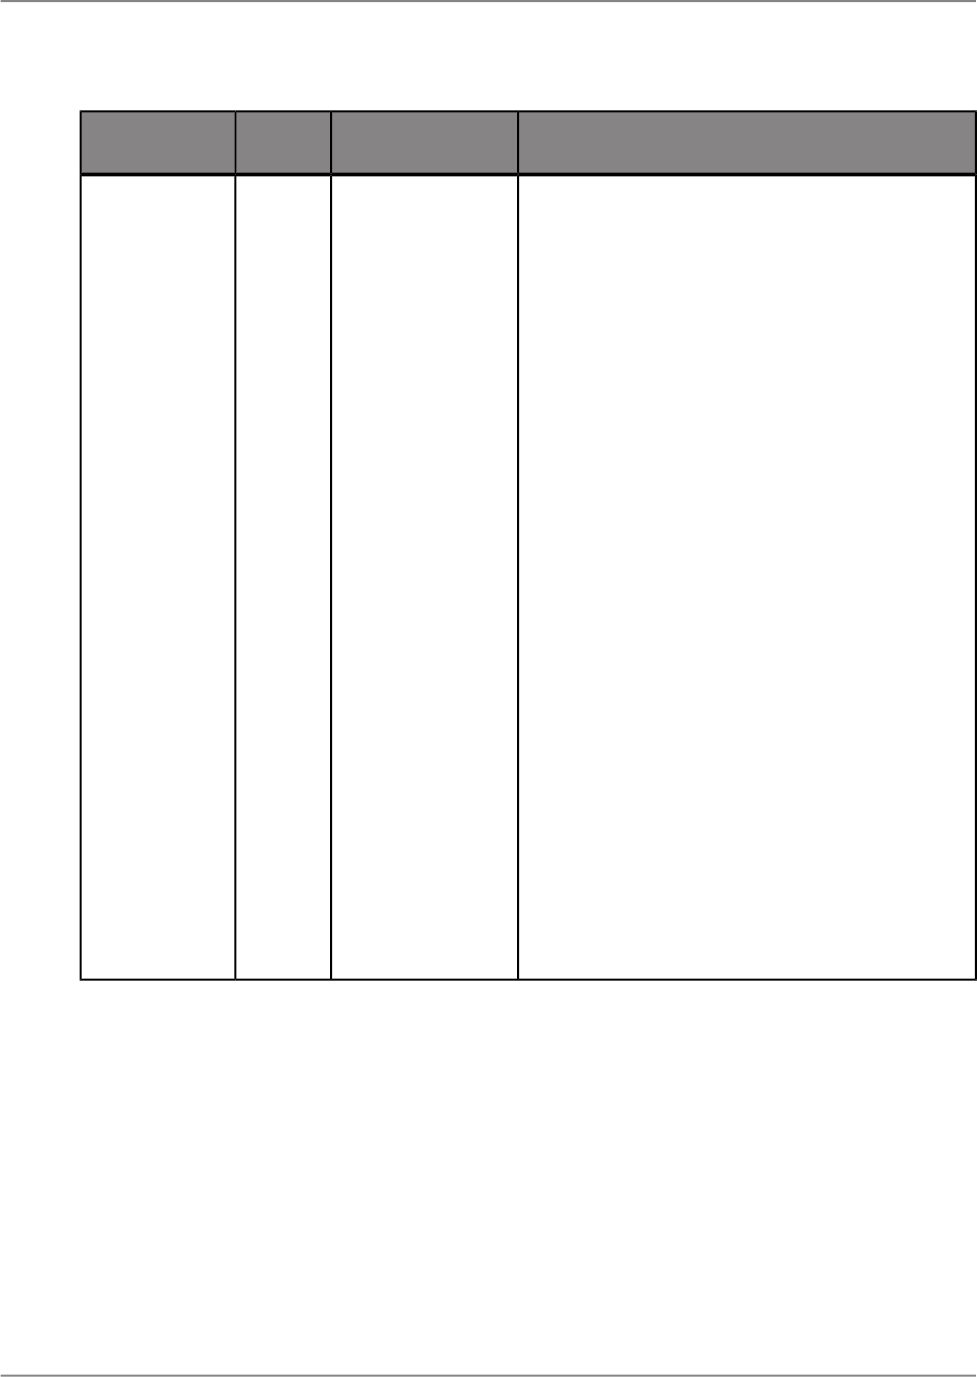
Property Purpose and DescriptionValue
Value
Type
Property Name
Text
The property determines the report column width
in the exported spreadsheet to be based on speci-
fied report objects.
• Whole Report: The column width in the export-
ed spreadsheet is based on objects found in
any section of your report.
Note:
The export spreadsheet layout is likely not to
be consistent with the layout in Crystal Reports.
• Report Header: The column width in the export-
ed spreadsheet is based on objects found in
the Report Header section only.
• Page Header: The column width in exported
spreadsheet is based on objects found in the
Page Header section only.
• Group Header: The column width in the export-
ed spreadsheet is based on objects found in
the Group Header section only.
• Body: The column width in the exported
spreadsheet is based on objects found in the
Body section only.
• Group Footer: The column width in the exported
spreadsheet is based on objects found in the
Group Header section only.
• Page Footer: The column width in the exported
spreadsheet is based on objects found in the
Page Footer section only.
• Report Footer: The column width in the export-
ed spreadsheet is based on objects found in
the Report Footer section only.
255: Whole report
1: Report Header
2: Page Header
3: Group Header
Note:
If ColumnWidth-
GroupNumber is
<= 0, than Column-
WidthGroupNum-
ber will be set to 1.
4: Body
5: Group Footer
Note:
If ColumnWidth-
GroupNumber is
<= 0, than Column-
WidthGroupNum-
ber will be set to 1.
7: Page Footer
8: Report Footer
String
Ex
port.XLS.Colum
nWidth
BaseArea
2011-05-06194
Saving, Exporting, Printing, and Viewing Reports
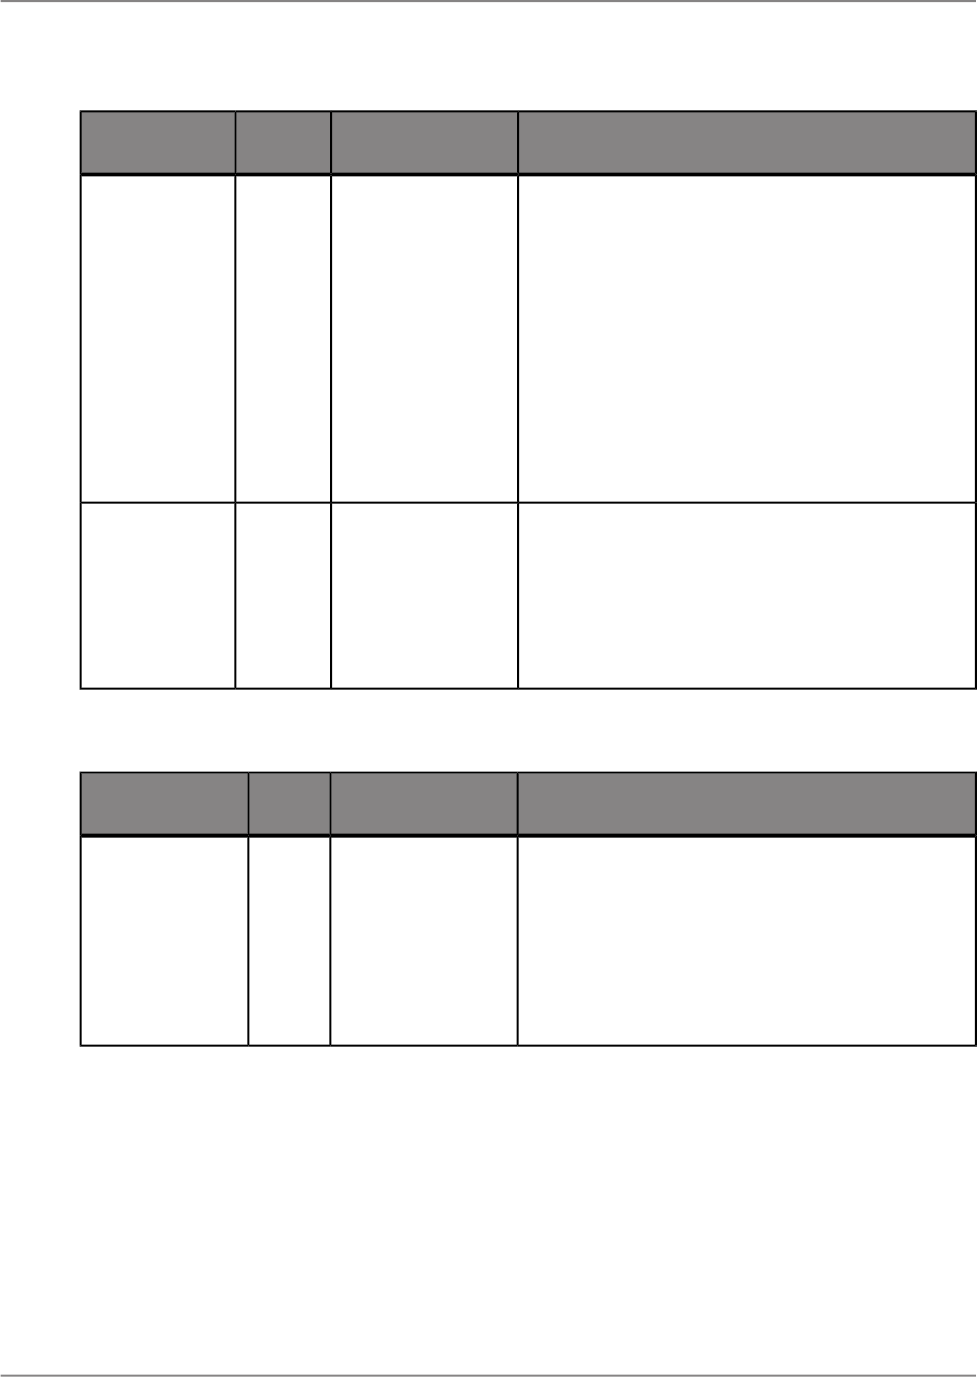
Property Purpose and DescriptionValue
Value
Type
Property Name
Text
The property determines the Crystal Reports col-
umn width in the exported spreadsheet based upon
the Group Header or Group Footer.
Note:
This configuration property will only take effect if
the value of ColumnWidthBaseArea is 3:Group
Header or 5:Group Footer.
• The column width in the exported spreadsheet
will be based on the objects found only in the
Group Header section or Group Footer section
of the report
If >=1 then default
= 1
String
Ex
port.XLS.Colum
nWidthGroup
Number
The property determines whether or not wrap the
text in exported spreadsheet.
• If True: The text will be wrapped in the exported
spreadsheet.
• If False: The text will not be wrapped in the ex-
ported spreadsheet.
True
False
String
Export.XLS.Ex
celExporterAl
waysWrapMulti
ParagraphTex
tObjects
Table 11-3: Microsoft Excel Workbook Data-Only
Property Purpose and DescriptionValue
Value
Type
Property Name
Text
The property determines whether or not to include
Page Headers and Page Footers in the exported
file.
• If True: The header appears once at the top of
your spreadsheet and the footer appears once
at the bottom.
• If False: The header and footer do not appear.
True
False
String
Export.XLSX-
DATAONLY.Ex
portPageHeader
Footer
2011-05-06195
Saving, Exporting, Printing, and Viewing Reports
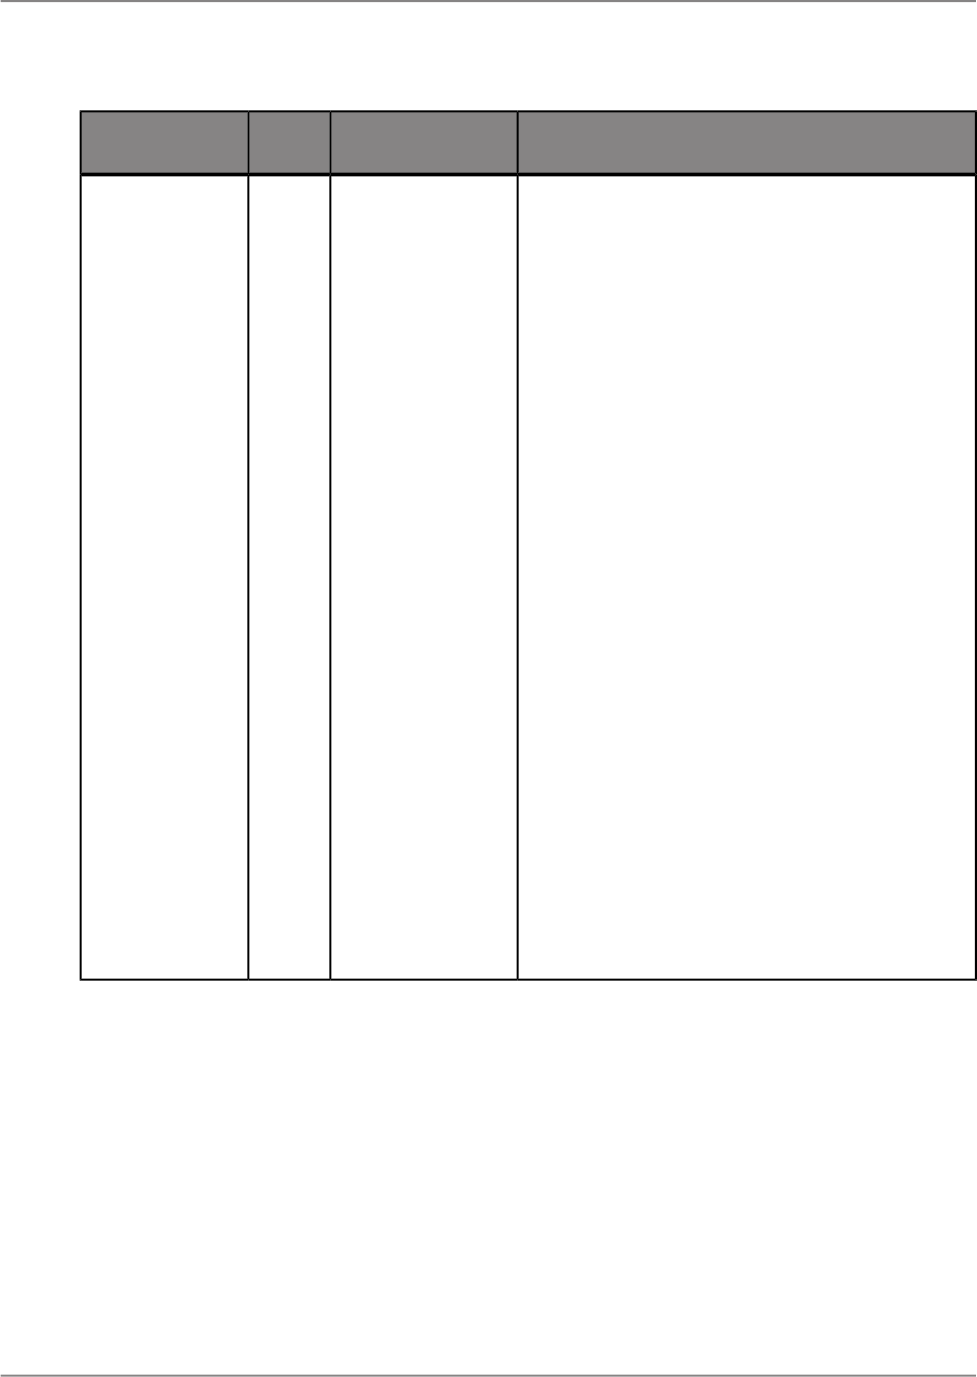
Property Purpose and DescriptionValue
Value
Type
Property Name
Text
The property determines the Crystal Reports col-
umn width in the exported spreadsheet to be based
on specified report objects.
• Whole Report: The column width in the exported
spreadsheet is based on objects found in any
section of your report.
Note:
The export spreadsheet layout is likely not to
be consistent with the layout in Crystal Reports.
• Report Header: The column width in the export-
ed spreadsheet is based on objects found in
the Report Header section only.
• Page Header: The column width in exported
spreadsheet is based on objects found in the
Page Header section only.
• Group Header: The column width in the export-
ed spreadsheet is based on objects found in
the Group Header section only.
• Body: The column width in the exported
spreadsheet is based on objects found in the
Body section only.
• Group Footer: The column width in the exported
spreadsheet is based on objects found in the
Group Header section only.
• Page Footer: The column width in the exported
spreadsheet is based on objects found in the
Page Footer section only.
• Report Footer: The column width in the export-
ed spreadsheet is based on objects found in
the Report Footer section only.
255: Whole report
1: Report Header
2: Page Header
3: Group Header
Note:
If ColumnWidth-
GroupNumber is
<= 0, than Column-
WidthGroupNum-
ber will be set to 1.
4: Body
5: Group Footer
Note:
If ColumnWidth-
GroupNumber is
<= 0, than Column-
WidthGroupNum-
ber will be set to 1.
7: Page Footer
8: Report Footer
String
Export.XLSX-
DATAON
LY.ColumnWidth
BaseArea
2011-05-06196
Saving, Exporting, Printing, and Viewing Reports

Property Purpose and DescriptionValue
Value
Type
Property Name
Text
The property determines the Crystal Reports col-
umn width in the exported spreadsheet based upon
the Group Header or Group Footer.
Note:
This configuration property will only take effect if
the value of ColumnWidthBaseArea is 3:Group
Header or 5:Group Footer.
• The column width in the exported spreadsheet
will be based on the objects found only in the
Group Header section or Group Footer section
of the report.
If >=1 then default
= 1
String
Export.XLSX-
DATAON
LY.ColumnWidth
GroupNumber
The property determines whether or not to export
any images that are present in your report.
• If True: The images present in the report will be
exported to the spreadsheet.
• If False: The images present in the report will
not be exported to the spreadsheet.
True
False
String
Export.XLSX-
DATAONLY.Ex
portImagesIn
DataOnly
The property determines whether or not to maintain
the relative position of the result objects in the ex-
ported spreadsheet.
• If True: The relative position of the result objects
are maintained in the spreadsheet.
• If False: The relative position of the result ob-
jects are not maintained in the spreadsheet.
True
False
String
Export.XLSX-
DATAON
LY.MaintainRela
tiveObjectPosi
tion
(Deprecated)
2011-05-06197
Saving, Exporting, Printing, and Viewing Reports
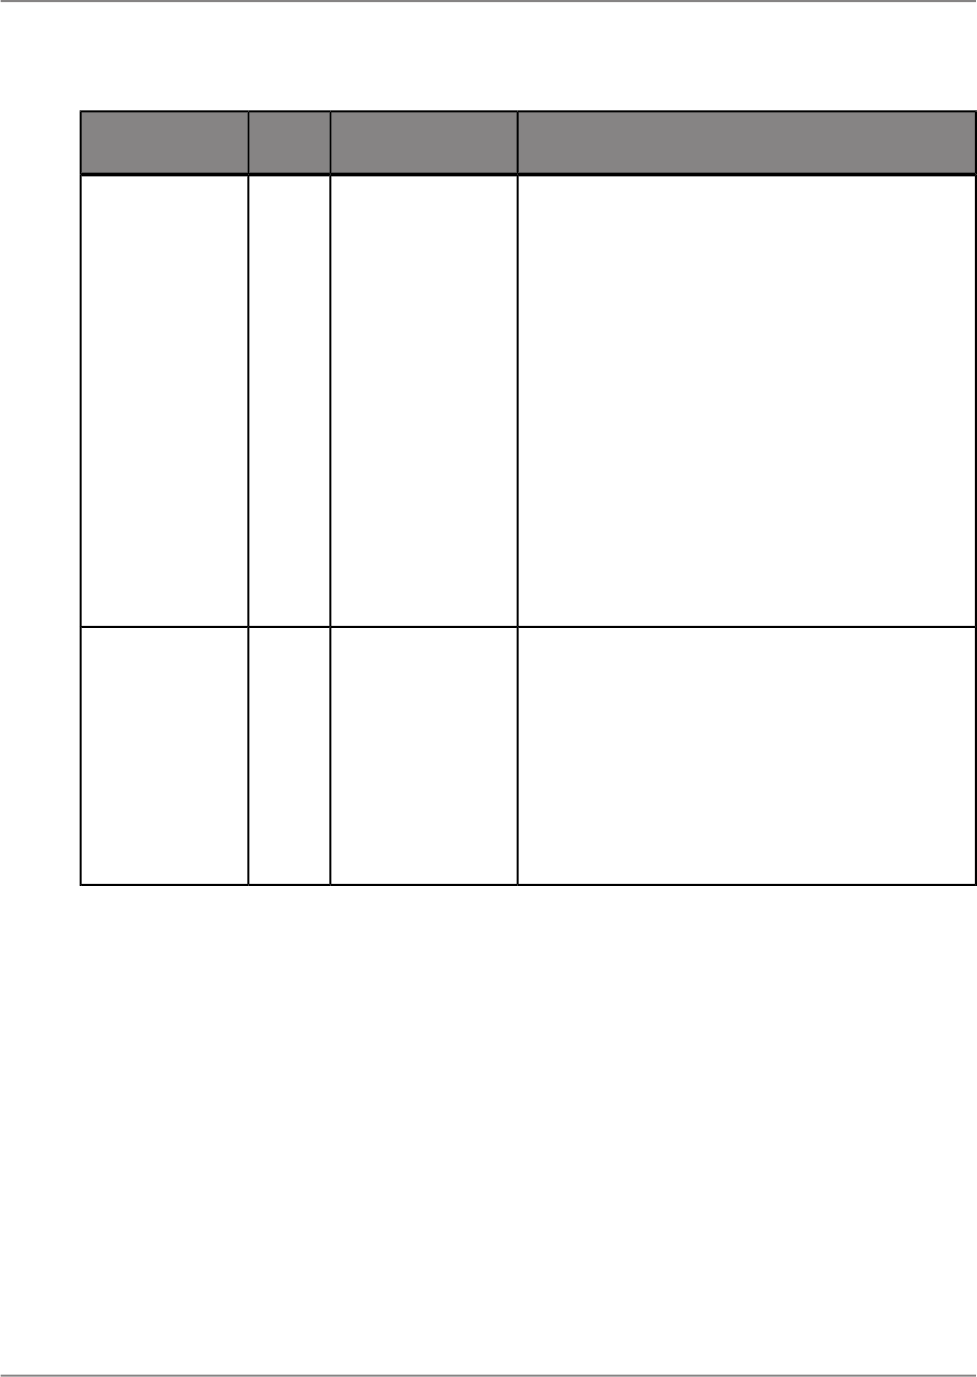
Property Purpose and DescriptionValue
Value
Type
Property Name
Text
The property determines whether or not to align
objects and corresponding totals in the same Excel
column.
Note:
This configuration property effects only when
"Maintain Relative Object Position" is true.
• If True: The objects and their corresponding
totals are forced to align in the exported
spreadsheet.
Note:
The column width of the object and total will be
10.
• If False: The objects and their corresponding
totals will be placed freely and it is likely that
they will be placed into different columns.
True
False
String
Export.XLSX-
DATAON
LY.Maintain
ColumnAlign
ment
The property determines whether or not to maintain
the formatting information applied on the report
objects.
• If True: The formatting information applied on
the report objects will be kept in the exported
spreadsheet.
• If False: The formatting information applied on
the report objects will not be kept in the export-
ed spreadsheet.
True
False
String
Export.XLSX-
DATAONLY.Use
FormatInDataOn
ly
2011-05-06198
Saving, Exporting, Printing, and Viewing Reports
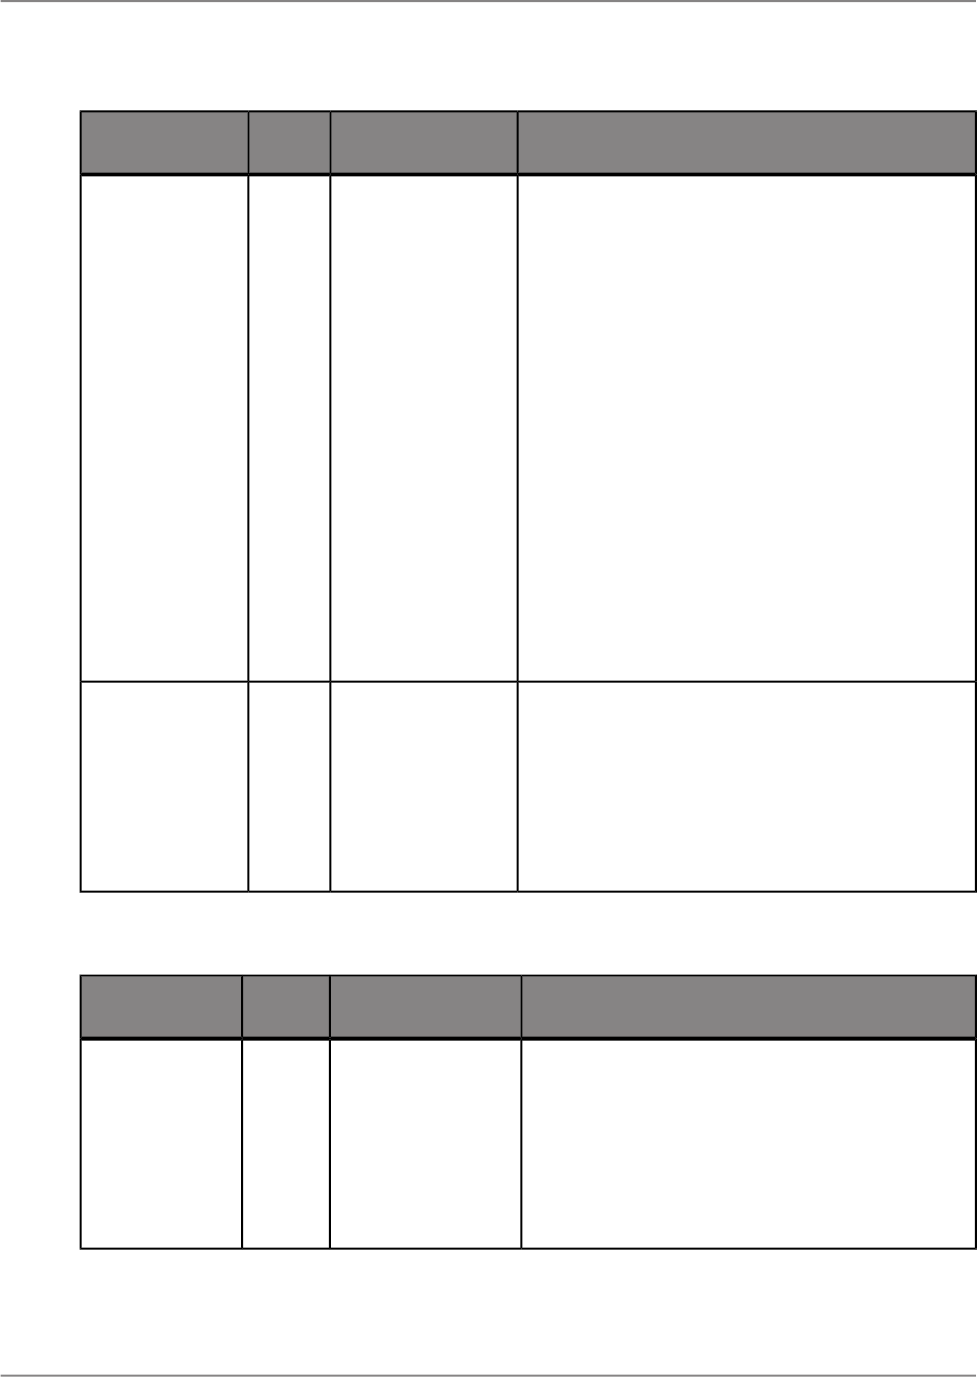
Property Purpose and DescriptionValue
Value
Type
Property Name
Text
The property determines whether or not to wrap
the text in the exported spreadsheet.
Note:
This configuration property will only effect under
the following conditions:
1.
String Field Object: The configuration property
will effect when "export element formatting" is
true.
2.
Text Object: The configuration property will ef-
fect when "export element formatting" is true
and "maintain relative object position" is true.
Otherwise, the default behavior will always wrap
the text.
• If True: The text will be wrapped in the exported
spreadsheet.
• If False: The text will not be wrapped in the ex-
ported spreadsheet.
True
False
String
Export.XLSX-
DATAON
LY.WrapTextIn
DataOnly
The property determines whether or not to simplify
the report Page Header in the exported spread-
sheet.
• If True: The Page Header in the exported
spreadsheet will be simplified.
• If False: The Page Header in the exported
spreadsheet will not be simplified.
True
False
String
Export.XLSX-
DATAONLY.Sim
plifyPageHeader
Table 11-4: Microsoft Word (97-2003) - Editable
Property Purpose and DescriptionValue
Value
Type
Property Name
Text
The property determines whether or not to elimi-
nate blank lines when the “insert page break” op-
tion is selected.
• If True: The blank lines will be eliminated in the
exported document.
• If False: The blank lines will not be eliminated
in the exported document.
True
False
String
Export.RTFED
ITABLE.Elimi
nate
BlankLinesToFit
Pagee
2011-05-06199
Saving, Exporting, Printing, and Viewing Reports
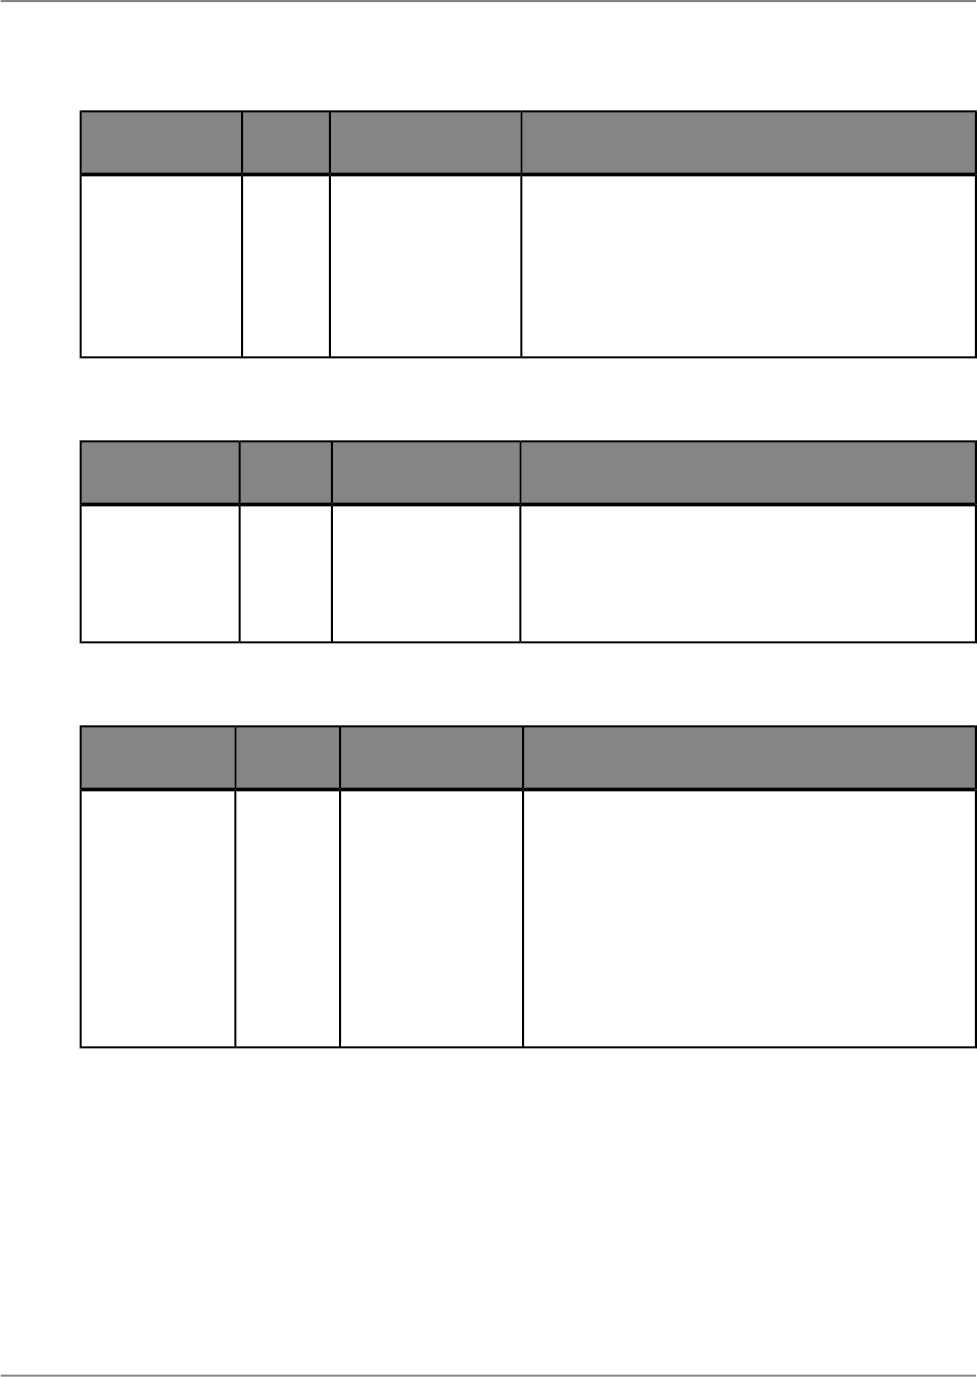
Property Purpose and DescriptionValue
Value
Type
Property Name
Text
The number is used to calculate how many blank
lines need to be eliminated. This configuration
property effect only when "Eliminate Blank Lines
to fit Page" is true.
• Type a number to determine the number of
lines in one page. The default setting is 300.
A number between
300 and 1440.
String
Export.RTFED
ITABLE.Page
HeightErrorFac
tor
Table 11-5: Microsoft Word (97-2003) - Rich Text Format (RTF)
Property Purpose and DescriptionValue
Value
Type
Property Name
Text
The property determines whether or not to ignore
the left or right indent in RTF non-editable mode.
• If True: The export result will respect the indent.
• If False: The export result will ignore the indent.
True
False
String
Ex
port.RTF.Use
LeftRightInden
tExactMode
Table 11-6: Separated Values (CSV)
Property Purpose and DescriptionValue
Value
Type
Property Name
Text
The property determines whether or not to have
the BOM characters (0xEFBBBF) in your exported
CSV file. The characters are invisible in normal
text view, but appear in hexadecimal view. This
option is for the standard CSV exporting.
• If True: The export result will include the UTF8
BOM.
• If False: The export result will not include the
UTF8 BOM.
True
False
String
Export.CSV.In
cludeUTF8BOM
2011-05-06200
Saving, Exporting, Printing, and Viewing Reports
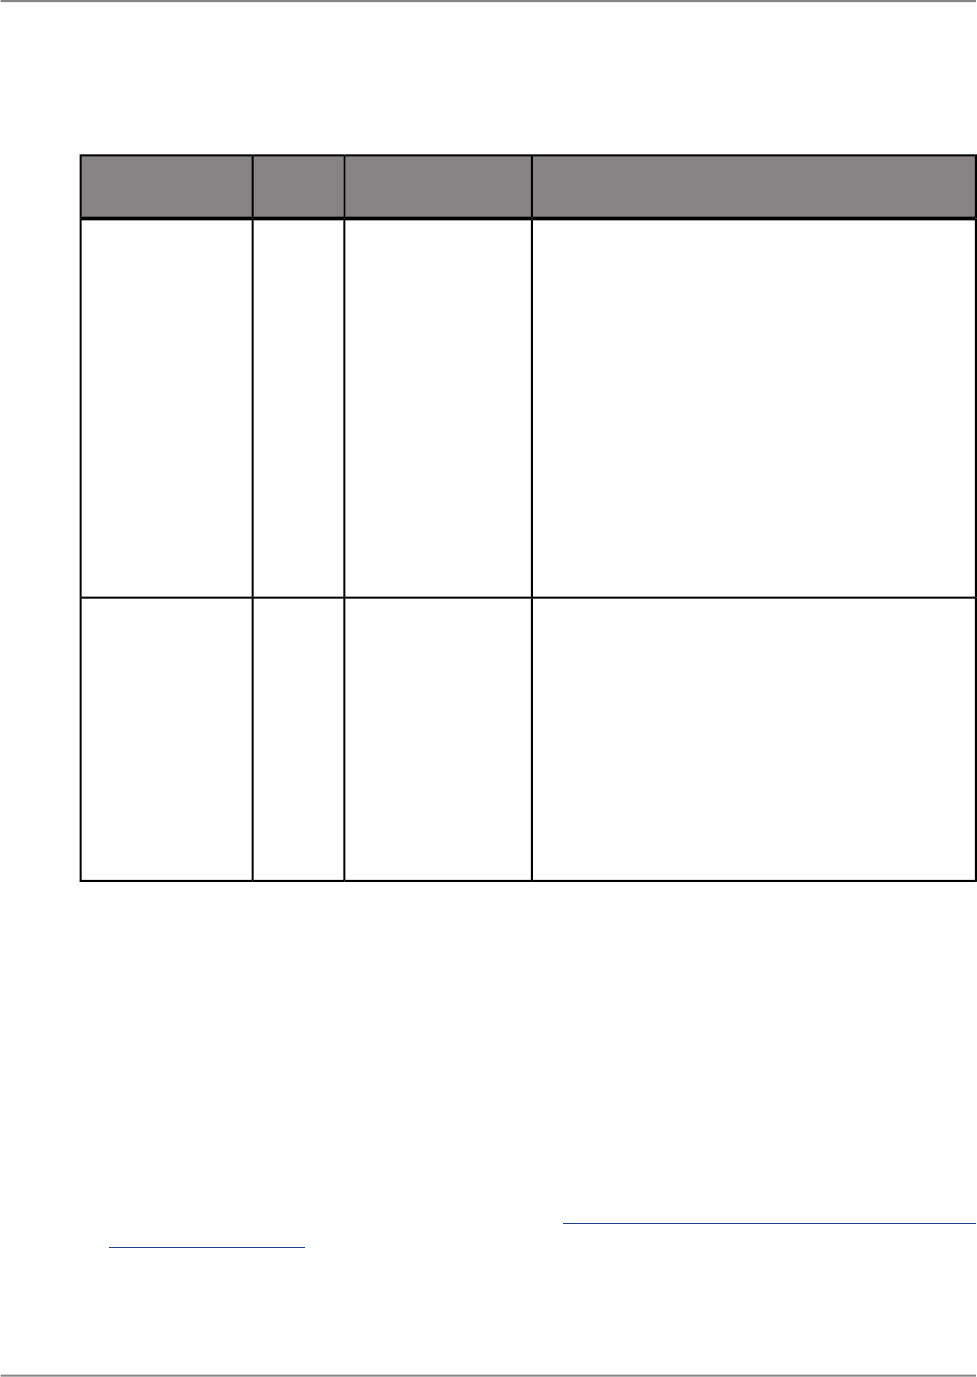
Table 11-7: PDF
Property Purpose and DescriptionValue
Value
Type
Property Name
The property determines whether or not to export
the flash with data binding.
Note:
Only in Acrobat Reader 9.0 can you see the result
of the exported flash with data binding.
• If 0: In the export result, the flash object will
not be exported with data binding as a backup
image.
• If 1: In the export result, the flash object will
be exported with data binding. It can be suc-
cessfully shown in Acrobat Reader 9.0, and
in Acrobat earlier versions, the flash object
will be shown as a backup image.
0: Disable
1: Enable
String
Export.PDF.En
ableFlash
DataBindingFor
PDF
The property determines whether or not to invoke
custom encoding in the exported result.
Note:
Custom encoding is required in order to have the
exported PDF open correctly in BlackBerry.
• If 0: The export result will not have custom
encoding.
• If 1: The export result will have custom encod-
ing.
0: Disable
Others: Enable
String
Export.PDF.Use
CustomEncoding
11.2.3.3.1 To set configuration properties in SAP Crystal Reports for Enterprise
1.
Click Edit > Preferences.
The "Preferences" dialog box appears.
2.
Click "General Settings".
3.
Click "Add New".
The "Add New General Setting" dialog box appears.
4.
Type the "Property Name".
Note:
Property values for each export option are found in Export configuration properties in SAP Crystal
Reports for Enterprise.
5.
Select a "Value Type" from the list.
2011-05-06201
Saving, Exporting, Printing, and Viewing Reports

6.
Type a "Value".
7.
Click "OK".
8.
Click "OK".
Configuration properties are set.
11.2.3.4 Export configuration properties in SAP BusinessObjects Business
Intelligence platform
You can specify export configuration properties in SAP BusinessObjects Business Intelligence platform.
Specifications include setting a "Property Name", "Value Type", and "Value".
The following tables include available export configuration properties:
Table 11-8: Separated Values (CSV)
Property Purpose and DescriptionValuePropertyCategory
The property determines whether or not to have
the BOM characters (0xEFBBBF) in your exported
CSV file. The characters are invisible in normal
text view, but appear in hexadecimal view. This
option is for the standard CSV exporting.
• If True: The export result will include the UTF8
BOM.
• If False: The export result will not include the
UTF8 BOM.
True
False
IncludeUTF8BOMCSV
2011-05-06202
Saving, Exporting, Printing, and Viewing Reports
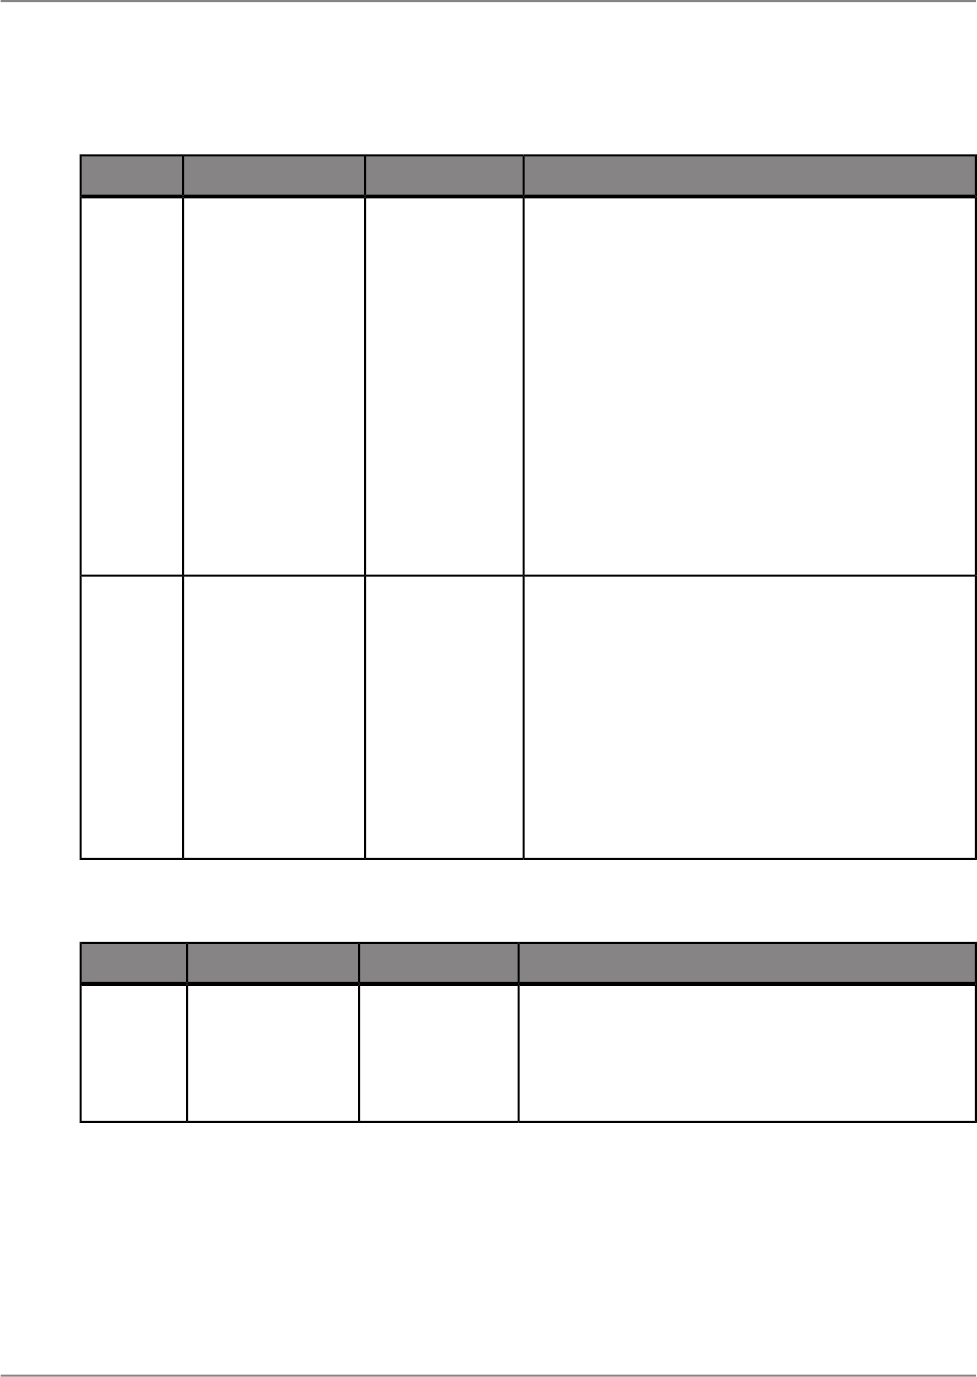
Table 11-9: PDF
Property Purpose and DescriptionValuePropertyCategory
The property determines whether or not to export
the flash with data binding.
Note:
Only in Acrobat Reader 9.0 can you see the result
of the exported flash with data binding.
• If 0: In the export result, the flash object will
not be exported with data binding as a backup
image.
• If 1: In the export result, the flash object will be
exported with data binding. It can be success-
fully shown in Acrobat Reader 9.0, and in Ac-
robat earlier versions, the flash object will be
shown as a backup image.
0
1
EnableFlash
DataBindingFor
PDF
PDF
The property determines whether or not to invoke
custom encoding in the exported result.
Note:
Custom encoding is required in order to have the
exported PDF open correctly in BlackBerry.
• If 0: The export result will not have custom
encoding.
• If 1: The export result will have custom encod-
ing.
0: Disable
Others: Enable
Note:
Enabled is the
default setting
without configu-
ration proper-
ties.
UseCustomEncod
ing
PDF
Table 11-10: Microsoft Word (97-2003) - Rich Text Format (RTF)
Property Purpose and DescriptionValuePropertyCategory
The property determines whether or not to ignore
the left or right indent in RTF non-editable mode.
• If True: The export result will respect the indent.
• If False: The export result will ignore the indent.
True
False
UseLeftRightIn
dentExactMode
RTF
2011-05-06203
Saving, Exporting, Printing, and Viewing Reports
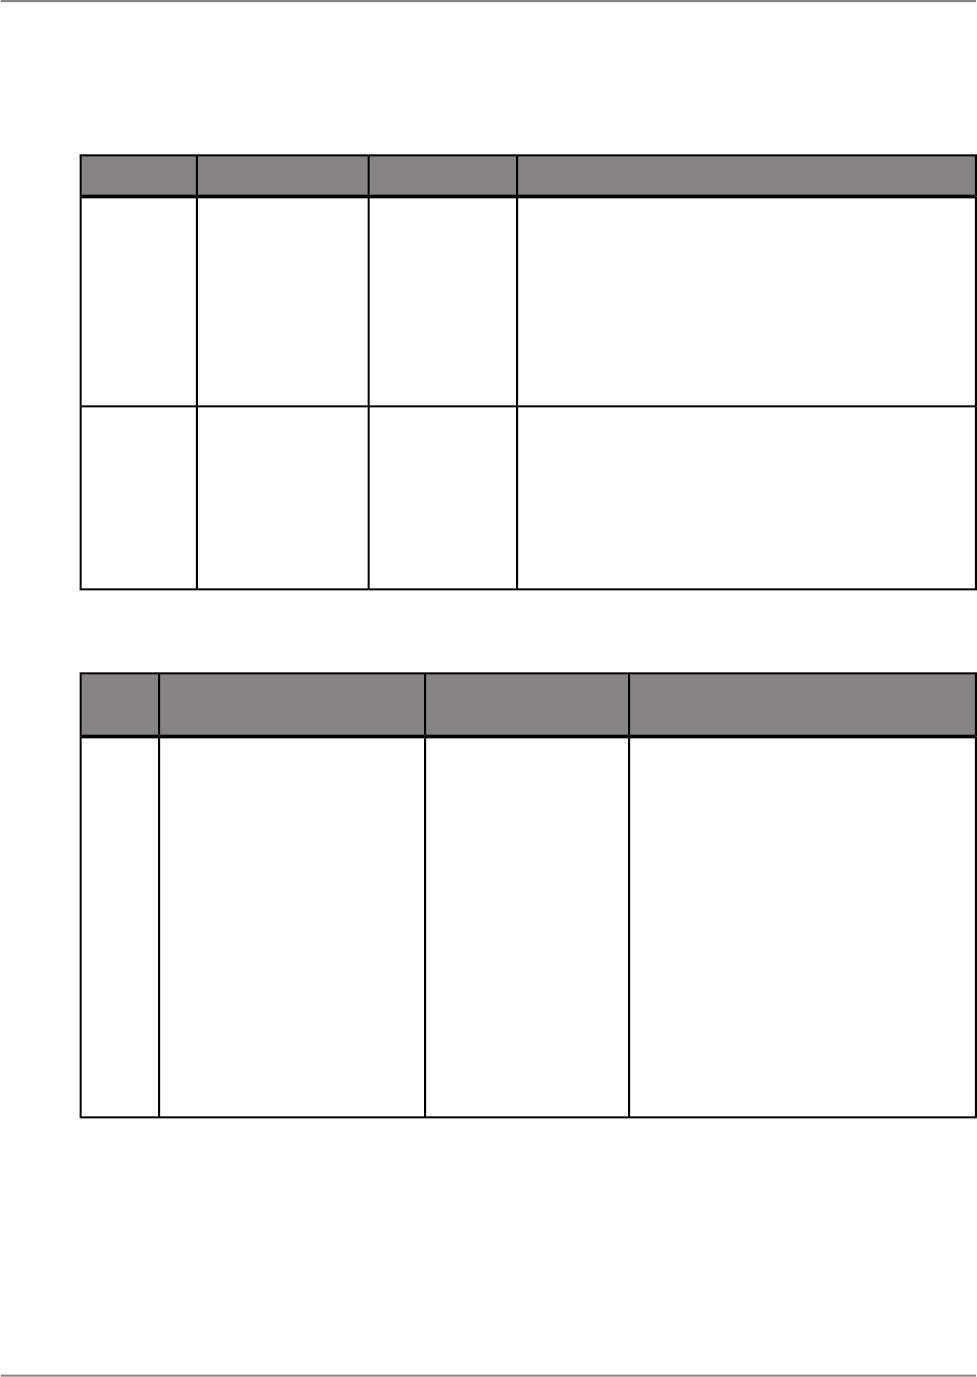
Table 11-11: Microsoft Word (97-2003) - Editable
Property Purpose and DescriptionValuePropertyCategory
The property determines whether or not to elimi-
nate blank lines when the “insert page break” op-
tion is selected.
• If True: The blank lines will be eliminated in the
exported document.
• If False: The blank lines will not be eliminated
in the exported document.
True
False
Eliminate
BlankLinesToFit
Page
RTF Ed-
itable
The number is used to calculate how many blank
lines need to be eliminated. This configuration
property effect only when "Eliminate Blank Lines
to fit Page" is true.
• Type a number to determine the number of lines
in one page. The default setting is 300.
A number be-
tween 300 and
1440.
PageHeightError
Factor
RTF Ed-
itable
Table 11-12: Microsoft Excel (97-2003)
Property Purpose and DescriptionValueProperty
Cate
gory
The property determines whether or
not to export the Page Header and
Page Footer sections of your report.
• If None: The report page header
and footer do not appear.
• If Once per report: The report page
header appears once at the top of
your spreadsheet and the footer
appears once at the bottom.
• If On each page: The report page
header and footer appear repeat-
edly throughout the spreadsheet
in relation to the pagination of the
data in your report.
1: None
2: Once per report
3: On each page
ExportPageHeaderFooterXLS
2011-05-06204
Saving, Exporting, Printing, and Viewing Reports
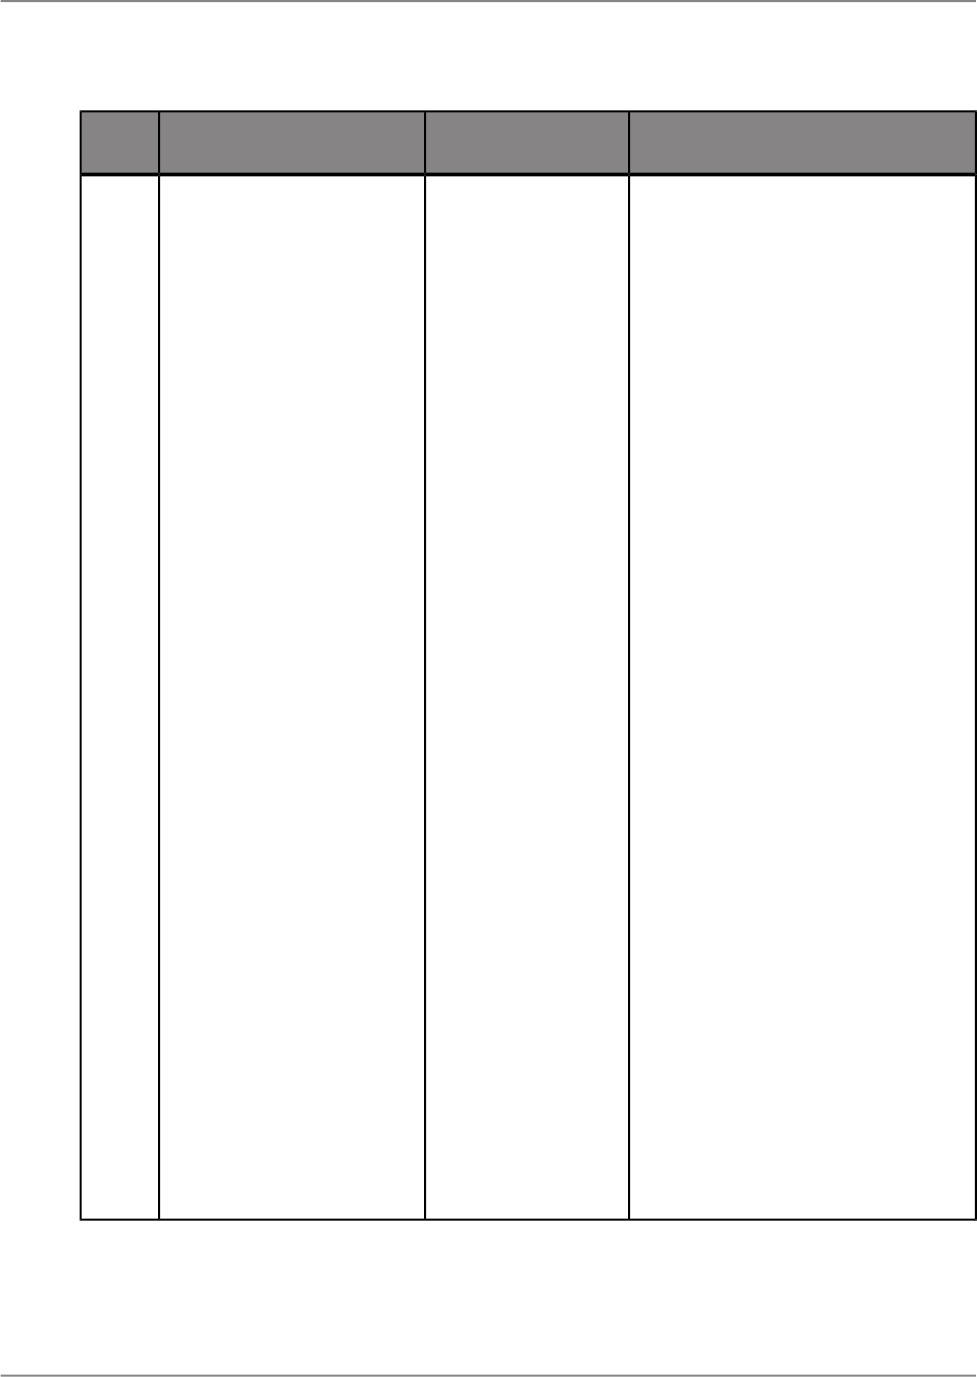
Property Purpose and DescriptionValueProperty
Cate
gory
The property determines the report
column width in the exported spread-
sheet to be based on specified report
objects.
• Whole Report: The column width
in the exported spreadsheet is
based on objects found in any
section of your report.
Note:
The export spreadsheet layout is
likely not to be consistent with the
layout in Crystal Reports.
• Report Header: The column width
in the exported spreadsheet is
based on objects found in the Re-
port Header section only.
• Page Header: The column width
in exported spreadsheet is based
on objects found in the Page
Header section only.
• Group Header: The column width
in the exported spreadsheet is
based on objects found in the
Group Header section only.
• Body: The column width in the ex-
ported spreadsheet is based on
objects found in the Body section
only.
• Group Footer: The column width
in the exported spreadsheet is
based on objects found in the
Group Header section only.
• Page Footer: The column width in
the exported spreadsheet is based
on objects found in the Page
Footer section only.
• Report Footer: The column width
in the exported spreadsheet is
based on objects found in the Re-
port Footer section only.
255: Whole report
1: Report Header
2: Page Header
3: Group Header
Note:
If ColumnWidth-
GroupNumber is <=
0, than ColumnWidth-
GroupNumber will be
set to 1.
4: Body
5: Group Footer
Note:
If ColumnWidth-
GroupNumber is <=
0, than ColumnWidth-
GroupNumber will be
set to 1.
7: Page Footer
8: Report Footer
ColumnWidthBaseAreaXLS
2011-05-06205
Saving, Exporting, Printing, and Viewing Reports
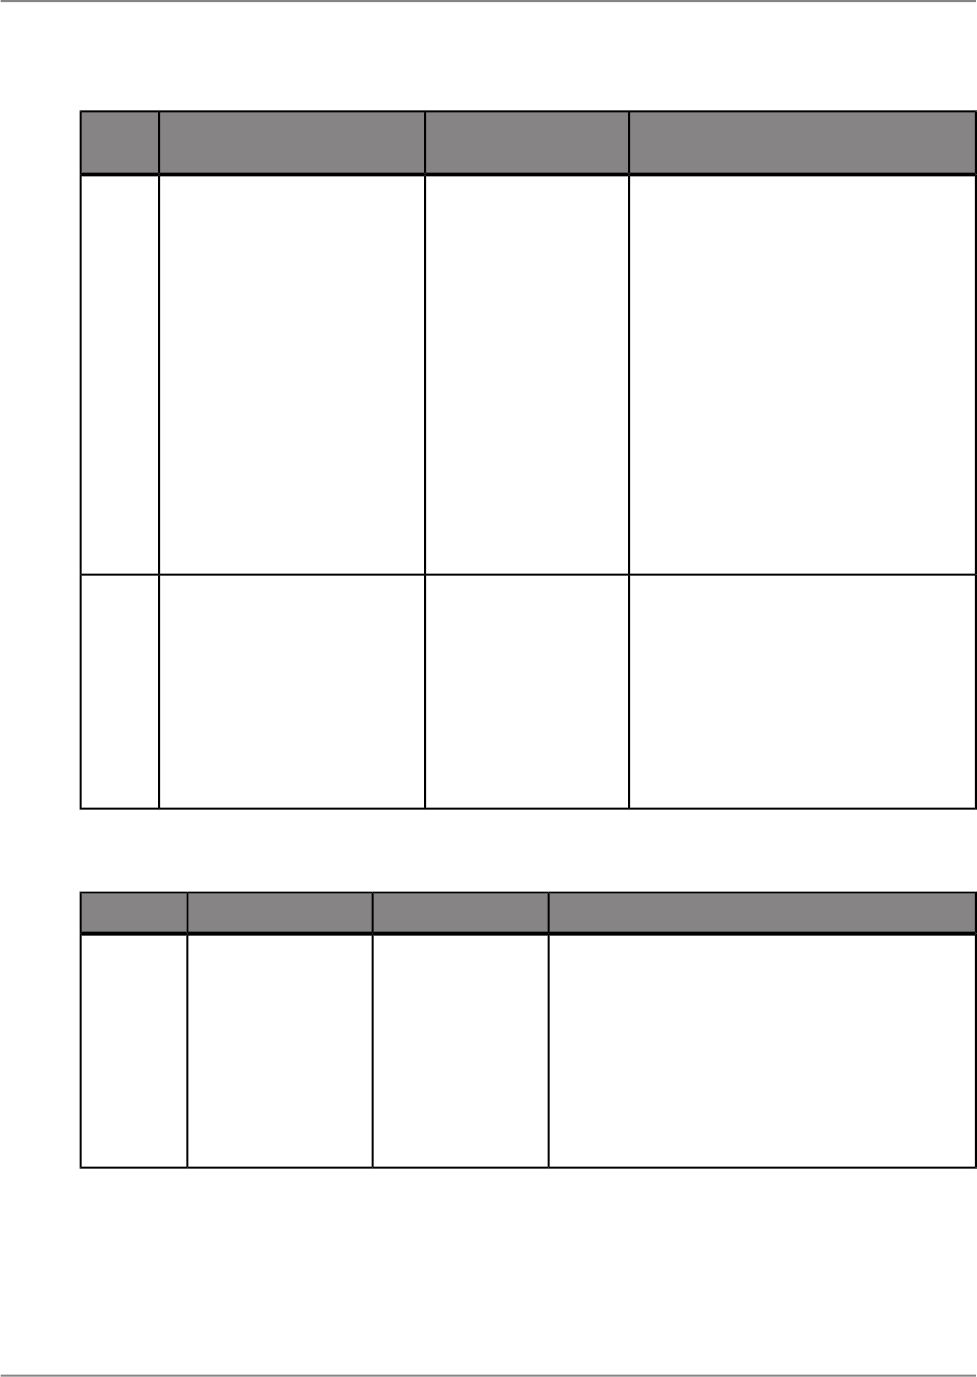
Property Purpose and DescriptionValueProperty
Cate
gory
The property determines the Crystal
Reports column width in the exported
spreadsheet based upon the Group
Header or Group Footer.
Note:
This configuration property will only
take effect if the value of Column-
WidthBaseArea is 3:Group Header or
5:Group Footer.
• The column width in the exported
spreadsheet will be based on the
objects found only in the Group
Header section or Group Footer
section of the report
If >=1 then default =
1
ColumnWidthGroupNumberXLS
The property determines whether or
not wrap the text in exported spread-
sheet.
• If True: The text will be wrapped
in the exported spreadsheet.
• If False: The text will not be
wrapped in the exported spread-
sheet.
True
False
ExcelExporterAlwaysWrap
MultiParagraphTextObjects
XLS
Table 11-13: Microsoft Excel (97-2003) Data-Only
Property Purpose and Value DescriptionValuePropertyCategory
The property determines whether or not to in-
clude Page Headers and Page Footers in the
exported file.
• If True: The header appears once at the top
of your spreadsheet and the footer appears
once at the bottom.
• If False: The header and footer do not ap-
pear.
True
False
ExportPageHeader
Footer
XLS-
DataOnly
2011-05-06206
Saving, Exporting, Printing, and Viewing Reports
Property Purpose and Value DescriptionValuePropertyCategory
The property determines the Crystal Reports
column width in the exported spreadsheet to
be based on specified report objects.
• Whole Report: The column width in the ex-
ported spreadsheet is based on objects
found in any section of your report.
Note:
The export spreadsheet layout is likely not
to be consistent with the layout in Crystal
Reports.
• Report Header: The column width in the
exported spreadsheet is based on objects
found in the Report Header section only.
• Page Header: The column width in exported
spreadsheet is based on objects found in
the Page Header section only.
• Group Header: The column width in the ex-
ported spreadsheet is based on objects
found in the Group Header section only.
• Body: The column width in the exported
spreadsheet is based on objects found in
the Body section only.
• Group Footer: The column width in the ex-
ported spreadsheet is based on objects
found in the Group Header section only.
• Page Footer: The column width in the export-
ed spreadsheet is based on objects found
in the Page Footer section only.
• Report Footer: The column width in the ex-
ported spreadsheet is based on objects
found in the Report Footer section only.
255: Whole report
1: Report Header
2: Page Header
3: Group Header
Note:
If ColumnWidth-
GroupNumber is
<= 0, than
ColumnWidth-
GroupNumber will
be set to 1.
4: Body
5: Group Footer
Note:
If ColumnWidth-
GroupNumber is
<= 0, than
ColumnWidth-
GroupNumber will
be set to 1.
7: Page Footer
8: Report Footer
ColumnWidth
BaseArea
XLS-
DataOnly
2011-05-06207
Saving, Exporting, Printing, and Viewing Reports
Property Purpose and Value DescriptionValuePropertyCategory
The property determines the Crystal Reports
column width in the exported spreadsheet
based upon the Group Header or Group Footer.
Note:
This configuration property will only take effect
if the value of ColumnWidthBaseArea is
3:Group Header or 5:Group Footer.
• The column width in the exported spread-
sheet will be based on the objects found
only in the Group Header section or Group
Footer section of the report
If >=1 then de-
fault = 1
ColumnWidth
GroupNumber
XLS-
DataOnly
The property determines whether or not to ex-
port any images that are present in your report.
• If True: The images present in the report
will be exported to the spreadsheet.
• If False: The images present in the report
will not be exported to the spreadsheet.
True
False
ExportImagesIn
DataOnly
XLS-
DataOnly
The property determines whether or not to
maintain the relative position of the result ob-
jects in the exported spreadsheet.
• If True: The relative position of the result
objects are maintained in the spreadsheet.
• If False: The relative position of the result
objects are not maintained in the spread-
sheet.
True
False
MaintainRela-
tiveObjectPosition
(Deprecated)
XLS-
DataOnly
2011-05-06208
Saving, Exporting, Printing, and Viewing Reports
Property Purpose and Value DescriptionValuePropertyCategory
The property determines whether or not to align
objects and corresponding totals in the same
Excel column.
Note:
This configuration property effects only when
"Maintain Relative Object Position" is true.
• If True: The objects and their corresponding
totals are forced to align in the exported
spreadsheet.
Note:
The column width of the object and total will
be 10.
• If False: The objects and their corresponding
totals will be placed freely and it is likely that
they will be placed into different columns.
True
False
MaintainColum
nAlignment
XLS-
DataOnly
The property determines whether or not to
maintain the formatting information applied on
the report objects.
• If True: The formatting information applied
on the report objects will be kept in the ex-
ported spreadsheet.
• If False: The formatting information applied
on the report objects will not be kept in the
exported spreadsheet.
True
False
UseFormatIn
DataOnly
XLS-
DataOnly
2011-05-06209
Saving, Exporting, Printing, and Viewing Reports
Property Purpose and Value DescriptionValuePropertyCategory
The property determines whether or not to wrap
the text in the exported spreadsheet.
Note:
This configuration property will only effect under
the following conditions:
1.
String Field Object: The configuration prop-
erty will effect when "export element format-
ting" is true.
2.
Text Object: The configuration property will
effect when "export element formatting" is
true and "maintain relative object position"
is true.
Otherwise, the default behavior will always wrap
the text.
• If True: The text will be wrapped in the ex-
ported spreadsheet.
• If False: The text will not be wrapped in the
exported spreadsheet.
True
False
WrapTextIn
DataOnly
XLS-
DataOnly
The property determines whether or not to
simplify the report Page Header in the exported
spreadsheet.
• If True: The Page Header in the exported
spreadsheet will be simplified.
• If False: The Page Header in the exported
spreadsheet will not be simplified.
True
False
SimplifyPageHead
er
XLS-
DataOnly
Table 11-14: Microsoft Excel Workbook Data-Only
Property Purpose and DescriptionValueProperty
Cate
gory
The property determines whether or not to in-
clude Page Headers and Page Footers in the
exported file.
• If True: The header appears once at the top
of your spreadsheet and the footer appears
once at the bottom.
• If False: The header and footer do not ap-
pear.
True
False
ExportPageHeader
Footer
XLSX
2011-05-06210
Saving, Exporting, Printing, and Viewing Reports
Property Purpose and DescriptionValueProperty
Cate
gory
The property determines the Crystal Reports
column width in the exported spreadsheet to
be based on specified report objects.
• Whole Report: The column width in the ex-
ported spreadsheet is based on objects
found in any section of your report.
Note:
The export spreadsheet layout is likely not
to be consistent with the layout in Crystal
Reports.
• Report Header: The column width in the
exported spreadsheet is based on objects
found in the Report Header section only.
• Page Header: The column width in exported
spreadsheet is based on objects found in
the Page Header section only.
• Group Header: The column width in the
exported spreadsheet is based on objects
found in the Group Header section only.
• Body: The column width in the exported
spreadsheet is based on objects found in
the Body section only.
• Group Footer: The column width in the ex-
ported spreadsheet is based on objects
found in the Group Header section only.
• Page Footer: The column width in the ex-
ported spreadsheet is based on objects
found in the Page Footer section only.
• Report Footer: The column width in the ex-
ported spreadsheet is based on objects
found in the Report Footer section only.
255: Whole re-
port
1: Report Header
2: Page Header
3: Group Header
Note:
If ColumnWidth-
GroupNumber is
<= 0, than
ColumnWidth-
GroupNumber
will be set to 1.
4: Body
5: Group Footer
Note:
If ColumnWidth-
GroupNumber is
<= 0, than
ColumnWidth-
GroupNumber
will be set to 1.
7: Page Footer
8: Report Footer
ColumnWidth
BaseArea
XLSX
2011-05-06211
Saving, Exporting, Printing, and Viewing Reports

Property Purpose and DescriptionValueProperty
Cate
gory
The property determines the Crystal Reports
column width in the exported spreadsheet
based upon the Group Header or Group Footer.
Note:
This configuration property will only take effect
if the value of ColumnWidthBaseArea is
3:Group Header or 5:Group Footer.
• The column width in the exported spread-
sheet will be based on the objects found
only in the Group Header section or Group
Footer section of the report.
If >=1 then de-
fault = 1
ColumnWidthGroup
Number
XLSX
The property determines whether or not to ex-
port any images that are present in your report.
• If True: The images present in the report
will be exported to the spreadsheet.
• If False: The images present in the report
will not be exported to the spreadsheet.
True
False
ExportImagesIn
DataOnly
XLSX
The property determines whether or not to
maintain the relative position of the result ob-
jects in the exported spreadsheet.
• If True: The relative position of the result
objects are maintained in the spreadsheet.
• If False: The relative position of the result
objects are not maintained in the spread-
sheet.
True
False
MaintainRelativeOb-
jectPosition
(Deprecated)
XLSX
2011-05-06212
Saving, Exporting, Printing, and Viewing Reports

Property Purpose and DescriptionValueProperty
Cate
gory
The property determines whether or not to align
objects and corresponding totals in the same
Excel column.
Note:
This configuration property effects only when
"Maintain Relative Object Position" is true.
• If True: The objects and their corresponding
totals are forced to align in the exported
spreadsheet.
Note:
The column width of the object and total will
be 10.
• If False: The objects and their correspond-
ing totals will be placed freely and it is likely
that they will be placed into different
columns.
True
False
MaintainColumnAlign
ment
XLSX
The property determines whether or not to
maintain the formatting information applied on
the report objects.
• If True: The formatting information applied
on the report objects will be kept in the ex-
ported spreadsheet.
• If False: The formatting information applied
on the report objects will not be kept in the
exported spreadsheet.
True
False
UseFormatInDataOnly
XLSX
2011-05-06213
Saving, Exporting, Printing, and Viewing Reports
Property Purpose and DescriptionValueProperty
Cate
gory
The property determines whether or not to wrap
the text in the exported spreadsheet.
Note:
This configuration property will only effect under
the following conditions:
1.
String Field Object: The configuration
property will effect when "export element
formatting" is true.
2.
Text Object: The configuration property will
effect when "export element formatting" is
true and "maintain relative object position"
is true.
Otherwise, the default behavior will always
wrap the text.
• If True: The text will be wrapped in the ex-
ported spreadsheet.
• If False: The text will not be wrapped in the
exported spreadsheet.
True
False
WrapTextInDataOnlyXLSX
The property determines whether or not to
simplify the report Page Header in the exported
spreadsheet.
• If True: The Page Header in the exported
spreadsheet will be simplified.
• If False: The Page Header in the exported
spreadsheet will not be simplified.
True
False
SimplifyPageHeaderXLSX
11.2.3.4.1 To set configuration properties in SAP BusinessObjects Business Intelligence platform
1.
Start the SAP BusinessObjects Business Intelligence platform Central Management Console.
2.
Log on to the "Central Management Console".
3.
From the "Manage" tab, click Application.
4.
Click Crystal Reports Configuration.
The "Properties: Crystal Reports Configuration" dialog box opens.
5.
Click Add New.
6.
Select a "Category" from the list.
7.
Type the "Property".
8.
Type the "Value".
2011-05-06214
Saving, Exporting, Printing, and Viewing Reports

9.
Click Save & Close.
The configuration properties are set. To make the configuration property change take effect in the BI
platform server, restart the server.
11.2.3.5 Exporting to Separated Values (CSV)
Separated Values (CSV)
The Separated Values format is a record-based, data-exchange format. It exports the report element
contents as a set of values separated by separator and delimiter characters that you specify. (When a
comma (,) is used to separate elements, the format is known as Comma Separated Values (CSV); this
export format is popular among Microsoft Excel users.)
Like record-style formats, the Separated Values format also creates one line of values for each record
in your report. A record contains all of the elements in each section of your report as seen in the Design
view. That is, elements in the "Report Header" section are exported first, followed by the "Page Header"
section, the "Group Header" section, the "Body" section, the "Group Footer" section, the "Report Footer"
section, and finally, the "Page Footer" section.
The Separated Values format cannot be used to export reports with cross-tabs, nor can it be used to
export reports with subreports in "Page Header" or "Page Footer" sections.
Note:
Standard Mode of the "Separated Values" format respects conditional suppression but only for report
content. The data is suppressed, but a row is printed in the report with the field delimiters. For example,
if your field delimiter is a comma and your report has four columns, you will see a blank row that contains
four commas.
11.2.3.6 Exporting to HTML
By exporting reports in HTML format, Crystal Reports provides you with a new option for rapid, convenient
distribution of important company data. Once exported, your reports become accessible with many of
the most popular Web browsers, including Mozilla Firefox and Microsoft Internet Explorer.
HTML export formats are page based. The HTML 4.0 format preserves the structure and formatting of
the report by using DHTML. All of the images in your report are saved externally and a hyperlink is
inserted in the exported HTML output. Therefore, this export format generates more than one file in the
output.
11.2.3.6.1 To export to HTML
1.
Click File > Export and select HTML 4.0 from the list.
2011-05-06215
Saving, Exporting, Printing, and Viewing Reports

Tip:
Another way to do this is to click the Export button on the Standard toolbar.
The Export Options dialog box appears.
2.
Select a Base Directory from the "Base Directory" text box.
3.
Click OK.
The "Export Destination" dialog box opens.
4.
In the "Export Destination" dialog box, do one of the following:
• Click To File and enter the report title to save the exported report in the "Export Report" dialog
box.
• Click To Application to open the report in the selected application without saving it.
When exported to HTML format, a report is saved as a single HTML file. If you prefer, select the
"Separate HTML pages" check box to have the entire report divided into separate pages. The initial
HTML page will be saved as <report name>.html. This is the file you open if you want to view
your report through your Web browser.
Note:
When you are exporting to a single file (that is, you have cleared the "Separate HTML Pages" check
box) all blank space in headers and footers, as well as top and bottom page margins, is included.
If you don't want to see blank spaces in your HTML file, suppress empty header and footer sections
and set the top and bottom page margins to zero in the Page Setup dialog box.
11.2.4 Printing a report
Crystal Reports lets you print a single section of a report or print the full report. The printed report will
contain the same information and structure as shown in the "Page" mode.
11.2.4.1 To print a report
1.
Click File > Print.
Note:
You can also click the print icon on the icon tray in the upper left corner, or press CTRL+P.
The "Print Options" dialog box appears.
2.
Choose the appropriate settings, and then click Print.
Your report prints.
2011-05-06216
Saving, Exporting, Printing, and Viewing Reports

11.2.4.2 To print a section of a report
1.
Click File > Print.
Note:
You can also click the print icon on the icon tray in the upper left corner, or press CTRL+P.
The "Print" dialog box appears.
2.
In the "Print" dialog box, use the Print: section to specify the section of the report you want to print.
3.
Click Print.
The selected section of your report prints.
11.3 Viewing reports
This section provides you with information on opening and viewing reports in Crystal Reports.
11.3.1 Opening reports
This section provides you with information about opening reports in Crystal Reports. You can open a
report from your local computer or from the BI platform.
11.3.1.1 To open a report from your local computer
1.
The process for opening a report from your local computer is different if you are logged in to SAP
BusinessObjects Business Intelligence platform.
• If you are not logged in to the BI platform, click File > Open.
• If you are logged in to the BI platform, click File > Open a Local File.
2.
In the "Open" dialog box, browse for the report you want to open.
3.
Select the file that you want to open and click Open.
Crystal Reports displays your report. To open additional reports, repeat steps 1 to 3. You can navigate
between the reports using the Windows taskbar at the bottom of your screen.
2011-05-06217
Saving, Exporting, Printing, and Viewing Reports

Note:
You can also open a report by dragging a report (.rpt file) from Windows Explorer into Crystal Reports,
or by double-clicking a report on your local drive.
11.3.1.2 To open a report from SAP BusinessObjects Business Intelligence platform
1.
If you are not already logged on to the BI platform, click File > Log On to SAP BusinessObjects
Enterprise, enter your server information, and click OK.
A progress indicator appears as the program logs you on to SAP BusinessObjects Enterprise.
2.
Click File > Open.
3.
In the "Open Report from [Server Name]" dialog box, navigate to the report you want to open.
Note:
In these steps, [Server Name] represents the name of your BI platform server.
4.
When you have selected a report, click Open.
A progress indicator appears while the report is opening.
11.3.1.3 Recently Opened Reports
If you want to open a report that you have recently opened in Crystal Reports, there are two ways to
do so.
• On the Start Page, your recently opened reports are listed underneath Open. Click a report to open
it.
• On the File menu, your recently opened reports are listed at the bottom of the menu. Click a report
to open it.
2011-05-06218
Saving, Exporting, Printing, and Viewing Reports

Parameters and Prompts
This section explains what parameters are and how they can be applied to create a single report that
can change according to the needs of the viewers of the report.
12.1 Parameter and prompt overview
Parameters
Parameters generate prompts that require the user of a report to enter information before Crystal Reports
can generate reports. Think of a parameter as a question that the user needs to answer before the
report is generated. The information users enter, or the way they respond, determines what appears
in the report. For example, in a report used by salespeople, there might be a parameter that asks the
user to choose a country. The report would return the results for the specific country, instead of returning
the results for all countries.
By using parameters in formulas, selection formulas, and in the report itself, you can create a single
report that can change according to the needs of the viewers of the report. Parameters can also be
used in subreports.
Note:
Parameters created within Crystal Reports can only be used in filters which filter data after it is retrieved
from the database. Parameters do not affect the database query itself. Parameters allow users to guide
their analysis without running a new database query. To edit the database query, use the Query Panel.
List of Values
List of values (LOVs) provide the suggested values for prompts in the prompting dialog box:
• LOVs can be either static (the values are contained in the report), or dynamic (the values are supplied
by the data source).
• LOVs are used for both single-level dynamic prompts, and multi-level cascading prompts.
For example, a list of countries could have a dynamic LOV, which provides a list of countries, while
a Cascading Parameter Group could contain three parameters with three different dynamic LOVs,
which provide lists of countries, regions, and cities.
Parameter Groups
Parameter groups are used to show parameters which have a dependency relationship, such as
Cascading parameters.
2011-05-06219
Parameters and Prompts

Cascading parameter groups allow you to arrange two or more parameters into groups. They allow the
final value for a parameter to be determined through a sequence of choices. For example, users might
first be prompted to pick a country before the choices for region appear. The users might then need to
pick a region before the choices for city appear, and so on. The LOVs for each parameter in the group
can contain values which can be used to filter the LOVs for subsequent parameters in the group.
Inherited Parameters
Parameters can be created in the Universe or the Query Panel, then used in a query or by an object.
These parameters can be inherited into Crystal Reports, where they appear in the "Data Explorer".
Inherited parameters can be dropped into a report or included in a formula, but they cannot be edited
in Crystal Reports. Parameters can only be edited where they were created, so inherited parameters
are edited in the universe or the query panel.
Prompts
A Parameter defines an answer which is needed in order to generate a report. A Prompt is the user
interface which allows users to provide the answer.
Related Topics
• Data Source Connections
12.1.1 Parameter considerations
There are a number of things to keep in mind when working with parameters:
• Parameters support the following data types:
• Boolean: Requires a true/false answer.
Example: Include planned budget numbers in the summary?
• Currency: Requires a dollar amount.
Example: Display customers with sales over XXXXX.
• Date: Requires an answer in a date format.
Example: Enter the start and end dates of the quarter.
• DateTime: Requires both date and time.
Example: Enter the expiry date and time.
• Number: Requires a numeric value.
Example: Enter the customer identification number.
• String: Requires a text answer.
Example: Enter the region.
2011-05-06220
Parameters and Prompts
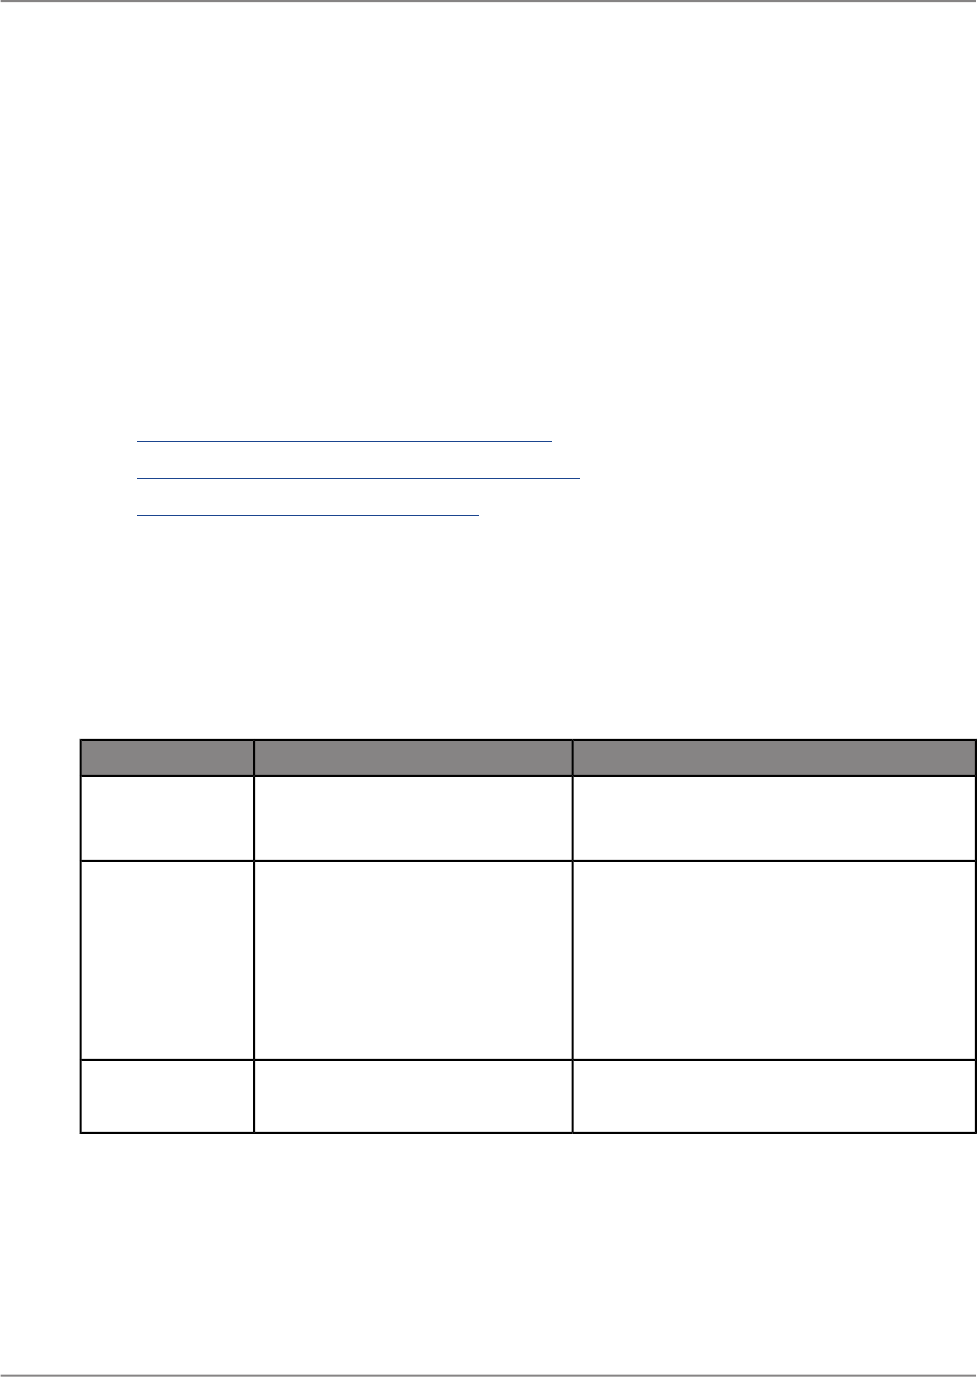
• Time: Requires an answer using a time format.
Example: Display opening and closing times.
• You can create a list of values from which users can choose the parameter value rather than having
them enter it manually.
• A parameter does not have to be placed in a report in order to be used in a formula. Parameters
can be used in a Formula in the same way as any other object and can be created inside the Formula
Workshop, when needed.
• Parameters can make use of static or dynamic lists of values. These provide a list of choices when
prompting. In addition, parameters can be arranged in groups to form a cascade of filtered choices,
which is called a cascading parameter group. For a description of each option, see these topics:
• Creating a parameter with a static list of values.
• Creating a parameter with a dynamic list of values.
• Creating a cascading parameter group.
12.1.2 List of values types
There are three different types of list of values (LOV) objects:
When to UseDescriptionType
• Using data that does not change.
Provides a simple list based on the
values you add or import in the re-
port.
Static LOVs
• Filtering data after it has been retrieved
from the database.
• Filtering report data Interactively without
accessing the database.
• Creating an LOV where it doesn't already
exist in the data source, such as in a Uni-
verse or a BeX Query.
Provides a dynamic list from the
Data Source
Dynamic LOVs
based on report
data
• Creating reusable lists of values that are
managed by the Universe administrator.
Provides a list that is created and
maintained in the Universe.
Universe LOVs
12.1.3 Optional parameters
2011-05-06221
Parameters and Prompts

Crystal Reports supports optional parameters.
An optional parameters is a parameter that does not require a value.
Report designers should provide some guidance to the end user that a parameter is optional by adding
this information to the prompt text.
Handling a parameter with no value
When the report engine evaluates any formula which references an optional parameter that does not
have a value, it generates a runtime error. All formulas that reference an optional parameter should
first use the HasValue() function to check if that parameter has a value before evaluating it.
12.1.4 Prompt types
The user has two prompt options when creating a parameter:
Prompt to User will create a prompt for the user to supply the value for the parameter.
Hidden Prompt is a parameter that has its value supplied by an initial value or initial value formula.
The value is not supplied by the user.
12.2 Creating a parameter
Use the following steps to create a parameter.
12.2.1 To create a parameter
1.
In the "Data Explorer" view, right-click within the "Parameters" area, and then select New > New
Parameter.
The "Create Parameter" dialog box appears.
2.
Enter a name for the parameter (up to 255 alphanumeric characters).
In the dialog box, you can change the name and type of the parameter along with other properties.
3.
Select the appropriate Data Type from the list.
You can choose types such as String, Number, or Date, among others.
4.
In the Prompt Text box, enter the desired prompting text (up to 255 alphanumeric characters).
2011-05-06222
Parameters and Prompts

For example, you might enter text such as "Select a Country".
This text will appear in the prompting dialog box when you preview the report, or when you refresh
the data on the Page area.
5.
To create a list of values, click the “Edit List of Values” button.
The "Edit List of Values" dialog box appears.
6.
Enter the values that you want to see when you are prompted.
For example, you might add a list of countries for a String type, or a list of values for a Number type.
7.
When you are finished entering values, click OK.
You return to the "Create Parameter" dialog.
8.
Click OK again.
9.
Drag and drop the parameter into your report.
12.3 Working with interactive filters
Interactive filters allow you to limit the records that are returned in your report based on the selected
result object, operator, and parameter.
12.3.1 To create an interactive filter
1.
Click Data > Interactive Filter.
The "Interactive Filter" dialog box appears.
2.
Click the Add Filter button.
3.
From the first list, select the result object to filter.
Tip:
Search for the result object in the <search> field.
4.
From the second list, select the operator.
Note:
The available operators depend on the selected result object type.
5.
From the last list, select New Parameter.
Note:
You can select existing parameters if they have already been created.
The "Create Parameter" dialog box appears.
2011-05-06223
Parameters and Prompts

6.
Enter a name for the parameter (up to 255 alphanumeric characters).
7.
Select the appropriate Data Type from the list.
8.
In the Prompt Text box, enter the desired prompting text.
9.
To create a list of values, click the “Edit List of Values” button.
The "Edit List of Values" dialog box appears.
10.
Enter the values that you want to see when you are prompted.
11.
When you are finished entering values, click OK.
You return to the "Create Parameter" dialog.
12.
Click OK.
You return to the "Interactive Filter" dialog.
13.
Click OK.
The "Record Filter has been changed" dialog box appears.
14.
Choose Saved Data or Refresh Data.
The report now displays only the filtered data.
Related Topics
• Parameter considerations
• Quick reference to query filter operators
12.3.2 To add additional interactive filters
1.
Click Data > Interactive Filter.
The "Interactive Filter" dialog box appears.
2.
Click the Add Filter button.
The new filter is connected to the previous filters by an And operator.
3.
Double-click the operator button to switch between the And and Or operators.
4.
Drag and drop filters within this area to nest filters.
12.3.3 To delete an interactive filter
Filters are deleted one at a time.
1.
Click Data > Interactive Filter.
The "Interactive Filter" dialog box appears.
2011-05-06224
Parameters and Prompts

2.
Select the filter that you want to delete.
3.
Click Delete.
12.4 Working with lists of values
You can prompt your users with a list of values that they use to make their selection.
12.4.1 Creating a parameter with a static list of values
A static list of values (LOV) always contains the same values. For example, if your parameter prompts
for a country value, you could create a static LOV because the country list represents a set of values
that does not change often.
Use the following steps to create a parameter with a static LOV that lets users see a list of customers
that they can select a specific country from.
12.4.1.1 To create a parameter with a static list of values
This example requires a report that uses a Country object.
1.
Open your report and enter Page mode.
2.
On the "Data Explorer" panel, right-click within Parameters and select New Parameter.
The "Create Parameter" dialog box appears.
3.
Enter a name for the parameter in the Name object (up to 255 alphanumeric characters).
This example uses Country.
4.
Select the appropriate Data Type from the list.
This example uses String.
5.
To create a list of values, click the “Edit List of Values” button.
The "Edit List of Values" dialog box appears.
6.
Click New and manually enter the countries that you would like the user to choose from.
Note:
To work with existing static lists, click Import From File or Import From Data Source and choose
the data.
2011-05-06225
Parameters and Prompts

7.
Click OK to close the dialog box.
8.
In the Prompt Text object, enter the desired prompting text (up to 255 alphanumeric characters)
for this parameter.
This is the text that appears in the prompting dialog and interactive panel. The default value is Enter
(ParameterName).
9.
Click OK.
10.
Drag the Country parameter into your report.
The "Change Current Data Set" dialog box appears.
11.
Enter a value and click OK.
12.4.2 Creating a parameter with a dynamic list of values
A dynamic list of values (LOV) is retrieved from the data source. For example, if you are prompting for
customer name, you could create a dynamic LOV because the names in your customer database
probably change frequently.
Use the following steps to create a parameter that prompts with a dynamic LOV.
12.4.2.1 To create a parameter with a dynamic list of values
This example requires a report that uses a Customer Name object. You must have a data source
connection to create a dynamic list of values (LOV).
1.
Open your report.
2.
On the "Data Explorer" panel, right-click within Parameters and select New Parameter.
The "Create Parameter" dialog box appears.
3.
Enter a name for the parameter in the Name object (up to 255 alphanumeric characters).
This example uses Customer Name.
4.
To create a list of values, click the “Edit List of Values” button.
The "Edit List of Values" dialog box appears.
5.
In the Type of List area, select Dynamic.
6.
In the Value combo box, select Customer Name from the list.
You can sort the LOV in Ascending or Descending order.
7.
Click OK.
2011-05-06226
Parameters and Prompts

8.
In the Prompt Text object, enter the desired prompting text (up to 255 alphanumeric characters).
This is the text that appears in the prompting dialog and interactive panel. The default is “Enter
(ParameterName)”.
9.
Click OK.
10.
Drag the Customer Name parameter into your report.
12.4.3 Creating a cascading parameter group
You can use a cascading parameter group to arrange your parameters into groups, which provides a
cascade of filtered choices. For example, if you are prompting for a city value, but you also need to
know which country and region that city comes from, you could create a cascading parameter group.
In this case, you first prompt for a country, and when that value has been selected, the program prompts
for a region by showing only the regions that apply to the selected country. Finally, when a region value
has been selected, the program prompts for a city by showing only the cities that apply to the selected
region. In this way, you can provide your user with a manageable list of cities and be sure that your
user picks the correct city (for instance, Vancouver, Washington, USA rather than Vancouver, British
Columbia, Canada).
Use the following steps to create a cascading parameter group.
12.4.3.1 To create a cascading parameter group
This example requires a report that uses Country, Region, and City objects.
1.
Open your report.
2.
On the "Data Explorer" panel, right-click within Parameters and select New > New Cascading
Parameter Group.
The "Create A Parameter Group" dialog box appears.
3.
Enter a name for the parameter group in the Name object (up to 255 alphanumeric characters).
This example uses “Supplier City”.
4.
Enter prompting text for your prompt group in the Prompt Text object.
This example uses “Choose the City that your supplier is located in.”
5.
Click the first blank object in the Value column.
The program automatically expands the Value list. You use this area to define the objects that make
up your cascading list of values. This example uses a cascade of Country, Region, and City.
6.
From the Value column, select Country.
2011-05-06227
Parameters and Prompts

7.
Click the blank object below Country and select Region.
8.
Click the blank object below Region and select City.
New parameters are automatically generated for each value.
9.
Click OK.
10.
Drag the City parameter into your report.
12.4.4 Using separate value and description objects
It is common in relational databases to make use of code objects that represent values. These codes
are often numeric or text strings that cannot be read by your users. For such cases, you can create
separate value and description objects in your list of values definition. You set the value object to the
parameter; the description object appears in the prompting dialog box. How the description object
appears in the prompting dialog box is controlled by the prompt option "Prompt with Description Only".
When set to True, only the descriptions are visible; when set to False, both the values and descriptions
are visible.
12.4.4.1 To set separate value and description objects
1.
Create a report with a Customer ID and a Customer Name result object.
2.
In the Data Explorer, select Parameters and then select New > New Parameter.
The "Create Parameter" dialog box appears.
3.
Enter a name for the parameter in the Name object.
This example uses Customer Name.
4.
To create a list of values, click the “Edit List of Values” button.
The "Edit List of Values" dialog box appears.
5.
In the Type of List area, select Dynamic.
6.
In the Value combo box, select Customer ID.
7.
In the Description combo box, select Customer Name.
8.
Click OK.
9.
Set Prompt with Description Only to True.
10.
Click OK.
When your users see this prompt in the prompting dialog box, they do not see values from the Customer
ID object (the object on which the parameter is based), but rather, they see a list of customer names.
2011-05-06228
Parameters and Prompts

12.5 To delete a parameter
Use the following steps to delete a parameter:
1.
In the "Data Explorer" view, expand Parameters, and then right-click the parameter you want to
delete.
2.
Choose Delete.
If the parameter is used with an interactive filter or a formula, make the appropriate changes to eliminate
any errors that occur.
12.6 Advanced parameter features
There are a variety of ways that parameters can be used within a report. This section covers some of
the advanced methods of using parameters.
12.6.1 To create a parameter that allows multiple values
1.
In the "Data Explorer" view, right-click Parameters, and then select New > New Parameter.
2.
In the "Create Parameter" dialog box, enter a name for the parameter.
3.
Select the appropriate Data Type from the list, and enter prompting text.
4.
Set Allow Multiple Values to True.
Now, when prompting, you can specify multiple values to be entered for the parameter.
12.6.2 To enable Select Values Only From List
1.
In the "Data Explorer" view, right-click Parameters, and then select New > New Parameter.
2.
In the "Create Parameter" dialog box, enter a name for the parameter.
3.
Select the appropriate Data Type from the list, and enter prompting text.
4.
To create a list of values, click the “Edit List of Values” button.
Note:
For more information on creating an list of values (LOV), see these topics:
2011-05-06229
Parameters and Prompts

• To create a parameter with a static list of values
• To create a parameter with a dynamic list of values
5.
Check Select Values Only From List.
Note:
This property is automatically disabled unless you have specified an LOV. When you specify an
LOV, you can choose to only allow values from the list by checking the box.
12.6.3 Creating a parameter that allows a discrete value or a range of values
You can create parameters that require users to enter a discrete value, or a range of values. If you then
include these parameters in your report's Interactive Parameters, you can help users find specific
information. For example, in the case of an interactive parameter that uses a discrete value, a user
might enter a single country name to see sales figures for only that country. In the case of an Interactive
Parameter that uses a range of values, a user might enter a range of dates (for example, between
January 1 and January 31, 2010) to see sales figures in this range.
12.6.3.1 To specify discrete or range values
1.
In the "Data Explorer" view, right-click Parameters, and then select New > New Parameter.
2.
Enter a name for the parameter.
3.
In the "Create Parameter" dialog box, select the appropriate Data Type from the list, and enter
prompting text.
4.
For the type of value range, choose Discrete or Range.
• If you select Discrete, the parameter will accept discrete values (rather than ranges of values).
• If you select Range, when you are prompted for parameter values, you can enter a start value
and an end value. For example, if you enter the values "5" and "10", the range is 5-10, and a
report that uses this parameter for filtering will display all records with values between 5 and 10.
This also works for string parameters. With a start value of "A" and an end value of "E", a report
that uses this parameter for filtering will display all records within an alphabetical range of A-E.
Note:
If the Allow Multiple Values and the Discrete options are selected, the parameter will accept
multiple discrete values. In this case, you can enter more than one value, but these values will be
evaluated individually and will not be interpreted as a range. If the Allow Multiple Values and Range
options are selected, the parameter will accept multiple ranges.
2011-05-06230
Parameters and Prompts

12.6.3.2 To specify maximum or minimum values
1.
In the "Data Explorer" view, right-click Parameters, and then select New > New Parameter.
2.
Enter a name for the parameter.
3.
In the "Create Parameter" dialog box, select the appropriate Data Type from the list, and enter
prompting text.
4.
Enter values to designate the length of the object.
Note:
Leave these values blank to indicate no restrictions.
• For a String data type, options for entering the Minimum Length and Maximum Length appear.
The allowed length of string of the parameter value will be limited to these values.
• For a Number data type, options for entering the Min Value and Max Value appear. The allowed
parameter value will be limited to this range.
• For a Date, Time, or Date Time data type, options for entering the Start and End appear. The
allowed parameter value will be limited to this range.
• For a Boolean data type, no options are available.
12.6.4 To create a parameter with a hidden prompt
1.
In the "Data Explorer" view, right-click within the "Parameters" area, and then select New > New
Parameter.
The "Create Parameter" dialog box appears.
2.
In the "Create Parameter" dialog box, enter a name for the parameter.
3.
Select the appropriate Data Type from the list.
4.
Select Hidden Prompt.
5.
Click the ellipsis button beside the Initial Values object.
The "Select Initial Values" dialog box appears.
6.
Enter the initial value and click Add.
Note:
Select Allow Multiple Values to enter more than one initial value.
7.
If necessary, click Function to create an Initial Values Function.
Note:
For more information, see "Functions".
2011-05-06231
Parameters and Prompts

8.
Click OK to finish.
12.6.5 Creating a list of values filter
List of values (LOV) filters allow you to limit the values that appear in your parameter LOV. You can
create a filter using a simple LOV or you can filter using another parameter in the "Formula Workshop".
For example, you can filter the Country values that appear in a prompt by Region, so only countries in
North America appear.
12.6.5.1 To create a list of values filter
Before adding a list of values (LOV) filter, you must create a new parameter with a dynamic LOV.
1.
In the "Data Explorer" view, right-click the parameter you want to filter and select Edit Parameter.
The "Edit Parameter" dialog box appears.
2.
In the "List of Values" area, click the ellipsis button.
The "Edit List of Values" dialog box appears with Dynamic selected in the "Type of List" area.
3.
In the Value combo box, select City from the list.
4.
Click the Filter button.
The "Edit the List of Values Filter" dialog box appears.
5.
Click the Add Filter button.
6.
From the first list, select Country.
7.
From the second list, select In List.
8.
From the last list, click Choose Values.
The Edit Values dialog box appears.
9.
Click New and select the countries to filter on.
For example, to create a North American filter, select Canada, United States, and Mexico.
10.
Click OK.
Note:
For more advanced options, you can edit your LOV filter in the "Formula Workshop".
Related Topics
• To create a parameter with a dynamic list of values
• Working with the Formula Workshop
2011-05-06232
Parameters and Prompts

12.6.6 To incorporate a parameter into a formula
1.
Open the formula workshop.
2.
Click New > New Formula from the toolbar to create a formula.
3.
Enter a name for the formula, and then click OK.
4.
Choose an existing parameter from the Objects view or create a new parameter by clicking New >
New Parameter to create a parameter.
For more information, see Creating a parameter.
5.
Create a formula using the parameter as you would any constant value.
For example, rather than creating a formula that hard-codes the country name:
{customer.COUNTRY} = "USA"
Use a parameter instead of "USA".
{customer.COUNTRY} = {?Country}
Tip:
Identify parameters easily by looking for (?).
6.
Close the "Formula Workshop".
12.6.7 Defining entry type and format using the Edit Mask
You can choose to enter an Edit Mask for a parameter with a string type. An Edit Mask can be any of
a set of masking characters used to restrict the values you can enter as parameter values (the Edit
Mask also limits the values you can enter as default prompting values).
You can enter any of the following masking characters, or any combination of them:
• "A" (allows an alphanumeric character and requires the entry of a character in the parameter value).
• "a" (allows an alphanumeric character and does not require the entry of a character in the parameter
value).
• "0" (allows a digit [0 to 9] and requires the entry of a character in the parameter value).
• "9" (allows a digit or a space, and does not require the entry of a character in the parameter value).
• "#" (allows a digit, space, or plus/minus sign, and does not require the entry of a character in the
parameter value).
• "L" (allows a letter [A to Z], and requires the entry of a character in the parameter value).
• "?" (allows a letter, and does not require the entry of a character in the parameter value).
2011-05-06233
Parameters and Prompts

• "&" (allows any character or space, and requires the entry of a character in the parameter value).
• "C" (allows any character or space, and does not require the entry of a character in the parameter
value).
• ". , : ; - /" (separator characters). Inserting separator characters into an Edit Mask is something like
hard coding the formatting for the parameter. When the object is placed on the report, the separator
character will appear in the data element frame, like this: LLLL/0000. This example depicts an edit
mask that requires four letters followed by four numbers.
• "<" (causes subsequent characters to be converted to lowercase).
• ">" (causes subsequent characters to be converted to uppercase).
• "\" (causes the subsequent character to be displayed as a literal). For example, the Edit Mask "\A"
would display a parameter value of "A". If the Edit Mask is "00\A00," then a valid parameter value
would consist of two digits, the letter "A," and then two additional digits.
• "Password". Allows you to set the Edit Mask to "Password," you can create conditional formulas
specifying that certain sections of the report become visible only when certain user passwords are
entered.
Note:
Some of the Edit Mask characters require that you enter a character in their place (when entering a
parameter value), while others allow you to leave a space, if needed. For example, if the Edit Mask is
000099, you can enter a parameter value with four digits, five digits, or six digits, since the '9' Edit Mask
character does not require the entry of a character. However, since '0' does require such an entry, you
could not enter a parameter value with less than four digits.
12.6.8 Null handling
If a parameter allows null values, there will be a separate option that allows users to choose the null
values while prompting. You can test for this functionality in the Crystal Reports formula language with
the IsNull function.
For more information, see "IsNull (fld)" in the online help.
2011-05-06234
Parameters and Prompts

Formulas
This section provides information on creating and using formulas within Crystal Reports.
13.1 Formulas overview
Usually when you create a report, the data needed already exists in the database folder objects. For
example, to prepare an order list you would place the appropriate objects on the report.
Sometimes, however, you need data that does not exist in any of the data objects. In such cases, you
need to create a formula. For example, to calculate the number of days it takes to process each order,
you need a formula that determines the number of days between the order date and the ship date.
Crystal Reports makes it easy for you to create such a formula.
13.1.1 Typical uses for formulas
There are many uses for formulas. If you have a need for specialized data manipulation, you can do it
with a formula.
Adding calculated objects to your report
To calculate a price discounted 15%:
Crystal syntax example:
{Orders_Detail.Unit Price}*.85
Formatting text on a report
To change all the values in the CUSTOMER_NAME object to uppercase:
Crystal syntax example:
UpperCase ({Customer.CUSTOMER_NAME})
Pulling out portions of a text string
To extract the first letter of the customer name:
2011-05-06235
Formulas

Crystal syntax example:
{Customer.CUSTOMER_NAME} [1]
Extracting parts of a date
To determine what month an order was placed:
Crystal syntax example:
Month ({Orders.Order Date})
Using a custom function
To convert $500 from U.S. currency to Canadian:
Crystal syntax example:
cdConvertUSToCanadian (500)
13.2 Formula components
Formulas contain two critical parts: the syntax and the components. The syntax is the rules that you
follow to organize the components. For more information on syntax, see Crystal syntax fundamentals.
The components are the pieces that you add to create a formula. You can use any of the following
components in your formula.
Objects
Example: {CUSTOMER.CUSTOMER LAST NAME}, {CUSTOMER.LAST_YEARS_SALES}
Numbers
Example: 1, 2, 3.1416
Text
Example: "Quantity", ":", "your text"
Operators
Example: + (add), / (divide), -x (negate)
Operators are actions you can use in your formulas.
Functions
Example: Round (x), Trim (x)
Functions perform calculations such as average, sum, and count. All functions available are listed with
their arguments and are arranged by their use.
2011-05-06236
Formulas

Custom functions
Example: cdFirstDayofMonth, cdStatutoryHolidays
Custom functions provide a way to share and reuse formula logic. Once in the report, custom functions
can be used when creating formulas.
Control Structures
Example: "If" and "Select", "For" loops
Group object values
Example: Average (fld, condFld), Sum (fld, condFld, "condition")
Group object values summarize a group. For example, you could use group object values to find the
percentage of the grand total contributed by each group.
Other formulas
Example: {@GrossProfit}, {@QUOTA}
13.3 Specifying formulas
Crystal Reports has many types of formulas, including report and running total condition formulas.
The majority of formulas in a report are report formulas and conditional formatting formulas.
Report formulas
Report formulas are formulas that you create to stand alone in a report. For example, a formula that
calculates the days between the order date and the shipping date is a report formula.
Conditional formatting formulas
Conditional formulas let you define conditions upon which your formatting will be applied. For example,
you could highlight customers with unpaid accounts by setting the font to red.
13.4 Working with the Formula Workshop
You can create different kinds of formulas in the Formula Workshop. The workshop consists of:
• a toolbar.
• a "navigation panel" which lists the types of formulas you can create or modify.
• an "objects panel" which contains components for formulas.
• an area for defining the formula itself.
• a "Problems" panel, where errors in the formula are displayed.
2011-05-06237
Formulas

13.4.1 Accessing the Formula Workshop
There are many ways to access the Formula Workshop. You see it when you add new formula objects,
when you define selection formulas, when you work with custom functions, and so on.
You can open the Formula Workshop by itself before you begin adding specific kinds of formulas.
13.4.1.1 To access the Formula Workshop
• On the Data menu, click Formulas.
Tip:
Another way to do this is to click the Formulas tab on the Data toolbar.
The Formula Workshop appears.
13.4.2 Navigation panel (Formula Workshop)
The Navigation panel contains folders for each type of formula you can create in Crystal Reports. It
also contains folders for custom functions.
If the workshop appears as the result of using a specific command, it will launch with the appropriate
folder and formula section selected.
Expand any folder in the tree to see existing formulas. New formulas can be added, and existing formulas
can be edited or deleted.
13.4.3 Objects panel (Formula Workshop)
The Objects panel contains the primary components to create a formula:
2011-05-06238
Formulas
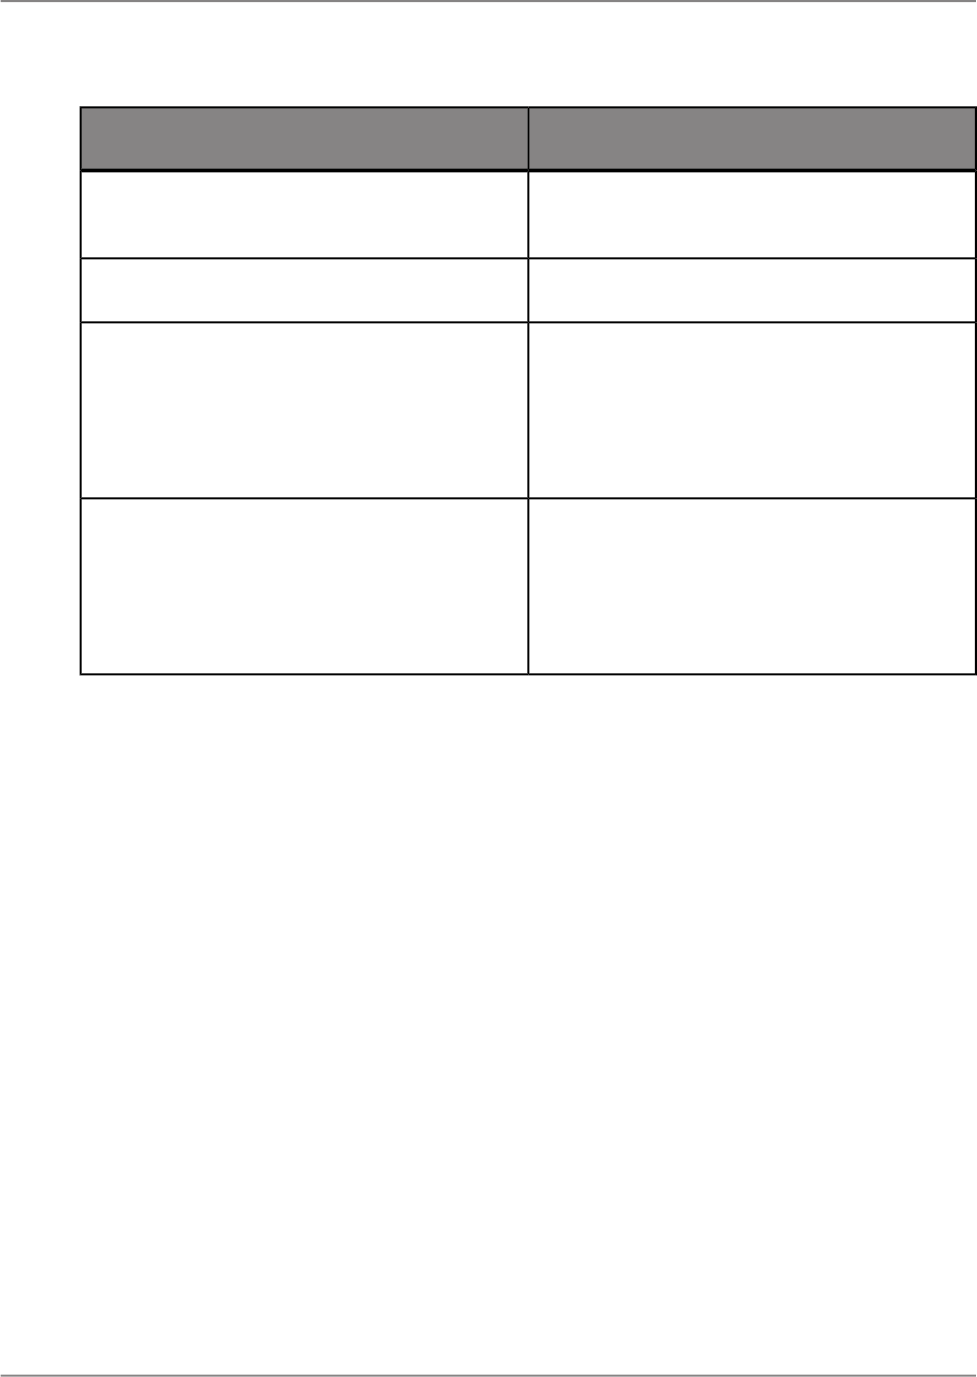
Description of contentsComponent
The Data Explorer contains any formulas or
groups already created for the report.
Data Explorer
All result objects accessible for your report.Result Objects
Functions are prebuilt procedures that return val-
ues. Custom functions are also listed in this win-
dow.
Examples of functions include the following: aver-
age, sum, count, sin, trim, and uppercase.
Functions
Operators are the "action verbs" you use in formu-
las. They describe an operation or an action to
take place between two or more values.
Examples of operators include the following: add,
subtract, less than, and greater than.
Operators
Drag any component from these trees to add it to your formula text.
13.4.4 Formula text window
The Formulas window is where you create and modify formulas. It displays multiple formulas at once,
and you can move between these formulas using the Navigation Panel on the side.
At the bottom of the code window, there are options to Save and Close, Save, or Cancel. If you cancel
out of the dialog, all changes made will be reverted.
13.4.5 Formula Workshop buttons
In the Formula Workshop, individual buttons are available or unavailable based on the task you are
undertaking. The workshop buttons perform the following functions:
2011-05-06239
Formulas
DescriptionActionButton
Changes which formulas are
currently shown in the Formulas
text window.
Filter Formulas
Sorts all formulas and functions
by type or by name.
Sort Formulas
Deletes the selected formula or
custom function.
Delete
Creates a new formula of the
type selected from the list. Also
used to create a new custom
function or parameter.
Create a new formula, function,
or parameter.
Comments out the highlighted
selection of a formula. Comment-
ed lines are not evaluated as
part of the formula.
Toggle Comment (Ctrl+/)
Undoes the last action per-
formed.
Undo
Redoes the last action.
Redo
Browses the values in a report
object.
Browse Data
Opens online help for the Formu-
la Workshop dialog box.
Help (F1)
Closes the Formula Workshop
after prompting you to save
changes. If you save changes,
your formula is checked for er-
rors.
Save and Close
Save and Close
Saves the formula or custom
function and updates the report.
Save
Save
2011-05-06240
Formulas

DescriptionActionButton
Closes the Formula Workshop
and discards unsaved changes.
Cancel
Cancel
13.5 Creating and modifying formulas
You can create formulas, add them to your reports, delete them, or search the text in a formula and
replace it.
13.5.1 Creating a formula
You can create several formulas at one time to handle different criteria, and then insert them in the
report.
13.5.1.1 To create a formula
1.
In the "Data Explorer" view, right-click within the Formulas box and then click New.
The Formula Workshop automatically opens with the new formula selected.
2.
Right-click the formula name, select Rename and type the name you want to use to identify the
formula.
Tip:
You can also change the name in the field explorer.
3.
Create the formula by typing in the components.
Tip:
• Ctrl+Space will bring up a list of result objects, functions, and parameters.
• Syntax errors are underlined in red and marked with a red "X" in the margin. Hover your mouse
over the error to view the error message.
• Use the Problems view to identify syntax errors in your formula.
2011-05-06241
Formulas

13.5.1.2 To insert a formula into a report
1.
In the "Data Explorer" view, select a formula and drag it to where you want it to appear on your
report.
Note:
A formula that is placed on a report is indicated by @ (for example, @ProcessTime).
2.
From the File menu, click Save to save the changes to the report.
13.5.2 To edit formulas
1.
In the "Data Explorer" view, double-click the formula you want to edit.
The formula is displayed on the Formula Workshop.
2.
Edit the formula.
13.5.3 To search and replace text
1.
In the "Data Explorer" view, right-click the formula you want to edit and choose Edit.
The formula is displayed in the Formula Workshop.
2.
Click Find And Replace to open a Find dialog box.
From this dialog box, you can search and replace text within the Formula text box.
3.
Click the Replace button to replace one occurrence, or click the Replace All button to replace all
occurrences of the search text with the contents of the 'Replace With' text box.
13.5.4 Deleting formulas
When a formula is created and added to a report, the Crystal Reports Designer does the following:
• Stores the specification for creating the formula, using the name you assigned to it.
2011-05-06242
Formulas

• Places a working copy of that formula at the point you specify in the report. A working copy is any
occurrence of the formula in the report.
In order to completely delete formulas, you must delete the specification and all working copies of the
formula.
13.5.4.1 To remove the working formula from your report
1.
Right-click the formula you want to delete from the report.
2.
Click Delete.
Note:
Even after the working copies of a formula have been deleted from the report, the formula specification
remains unchanged. The specification is listed in the "Data Explorer" view. It is available if you wish to
enter the formula in the report again.
13.5.4.2 To delete the formula specification
• In the "Data Explorer" view, right-click the formula you want to delete and click Delete.
13.6 Debugging formulas tutorial
Formulas (both formulas and conditional formatting formulas) that contain compile errors will have an
error icon. An error message will also be displayed in the "Problems" view. The "Problems" view is
automatically visible at the bottom of the Formula Workshop pane.
Use the following example to learn the necessary steps for debugging a formula. After completing this
exercise, use the same principles to debug your own formulas.
13.6.1 About this tutorial
• This tutorial uses the Xtreme sample database.
• This tutorial uses Crystal syntax.
2011-05-06243
Formulas

• The following formula is the formula you will test for errors:
If ({CUSTOMER.CUSTOMER_NAME} [1 to 2 = "Bi" and
ToText({customer,CUSTOMER ID}) [1] = "6") Or
({CUSTOMER.CUSTOMER_NAME} [1 to 2] = 'Ro" and
ToText({CUSTOMER.CUSTOMER ID}) [1] = "5")
"PREFERRED CUSTOMER"
Else
"DOES NOT FIT CRITERIA"
If correct, this formula should pick out all customers whose names begin with "Bi" and whose customer
IDs begin with “6” as well as those companies whose names begin with "Ro" and whose customer IDs
begin with “5”. When printing the object, those selections will read “PREFERRED CUSTOMER”, while
the rest will read “DOES NOT FIT CRITERIA”.
You will now break down the formula to check and see that each condition of the formula is working
individually.
13.6.1.1 Formula1
1.
To get started, create a report using the Customer folder in the Xtreme database and place the
following objects in the Body section:
{CUSTOMER.CUSTOMER_ID}
{CUSTOMER.CUSTOMER_NAME}
To test each portion of the formula, you will place a new formula next to these two objects in the
report.
2.
Create a new formula called Formula1.
3.
Select Formulas in the Data tab in the Crystal Reports Designer and type the following formula:
If {CUSTOMER.CUSTOMER_NAME} [1 to 2 = "Bi" Then
"TRUE"
Else
"FALSE"
There is an X in the margin. When you move the pointer over the X, you will see the following error
message:
The ] is missing.
4.
Correct the formula by inserting the missing " ] " after the 2.
When the formula is correct, the X will no longer be displayed.
5.
Click Save and Close.
6.
Select the Structure tab in the Crystal Reports Designer.
7.
Insert the corrected formula adjacent to the two data objects in the Body section of your report.
8.
Click the Page tab.
9.
Check the values in the report and compare the objects to see if the object values returned by
@Formula1 are correct.
2011-05-06244
Formulas

You will find "TRUE" listed next to the customer names that begin with "Bi" and "FALSE" next to all
the others.
Now you will check the other portions of the formula. Create Formula2, Formula3, and Formula4, using
the formulas specified for each.
Insert each formula on the same line of the Body section for easy comparison. Check each one for
errors, fix as needed, and make sure the values returned are correct before moving on to the next
formula.
Proceed to Formula2.
13.6.1.2 Formula2
1.
Create a new formula called Formula2.
2.
Select the Formula tab in the Crystal Reports Designer and type the following formula:
If ToText({customer,CUSTOMER ID}) [1] = "6" Then
"TRUE"
Else
"FALSE"
There is an X in the margin. When you move the pointer over the X, you will see the following error
message:
This object name is not known.
3.
Correct the formula by replacing the comma (,) in the object name with a period (.).
When the formula is correct, the X will no longer be displayed.
4.
Place the formula beside the @Formula1 object.
5.
Click the Page tab.
6.
Check the values in the report and compare the objects to see if the object values returned by
@Formula2 are correct.
You should see "TRUE" next to all customer numbers that begin with 6 and "FALSE" next to all
customer numbers that do not begin with 6.
Proceed to Formula3.
13.6.1.3 Formula3
1.
Create a new formula called Formula3.
2011-05-06245
Formulas

2.
Select the Formula tab in the Crystal Reports Designer and type the following formula:
If {CUSTOMER.CUSTOMER_NAME} [1 to 2] = 'Ro" Then
"TRUE"
Else
"FALSE"
There is an X in the margin. When you move the pointer over the X, you will see the following error
message:
The matching ' for this string is missing.
3.
Correct the formula by changing the single quote (') before Ro to a double quote (").
When the formula is correct, the X will no longer be displayed.
4.
Place the formula adjacent to the @Formula2 object.
5.
Click the Page tab.
6.
Check the values in the report and compare the objects to see if the object values returned by
@Formula3 are correct.
You should see "TRUE" next to all Customer names that begin with "Ro" and "FALSE" next to all
Customer names that do not begin with "Ro".
Proceed to Formula4.
13.6.1.4 Formula4
1.
Create a new formula called Formula4.
2.
Select the Formula tab in the Crystal Reports Designer and type the following formula:
If ToText({CUSTOMER.CUSTOMER ID}) [1] = "5"
"TRUE"
Else
"FALSE"
There is an X in the margin. When you move the pointer over the X, you will see the following error
message:
The keyword 'then' is missing.
3.
Correct the formula by typing in the word "Then" at the end of the first line after "5".
When the formula is correct, the X will no longer be displayed.
4.
Place the formula adjacent to the @Formula3 object.
5.
Click the Page tab.
6.
Check the values in the report and compare the objects to see if the object values returned by
@Formula4 are correct.
2011-05-06246
Formulas

You should see "TRUE" next to all Customer IDs that begin with 5 and "FALSE" next to all Customer
IDs that do not begin with 5.
Now that the formulas are error-free and the object values returned are correct, you will create a formula
that links the separate components together. You will begin by linking the first two formulas (@Formula1
and @Formula2) and then you will add @Formula3 and @Formula4 to create the final formula
@FinalFormula.
Go on to Formula1+2.
13.6.1.5 Formula1+2
1.
Create a new formula called Formula1+2.
2.
Select the Formula tab in the Crystal Reports Designer and type the following formula:
If {CUSTOMER.CUSTOMER_NAME} [1 to 2] = "Bi" and
ToText({CUSTOMER.CUSTOMER ID}) [1] = "6" Then
"TRUE"
Else
"FALSE"
3.
Place the formula to the right of the @Formula4 object.
4.
Click the Page tab.
5.
Check the values in the report and compare the objects to see if the object values returned by
@Formula1+2 are correct.
You should see "TRUE" next to each customer whose name begins with Bi and Id begins with 6,
and "FALSE" next to all Customer IDs that do not meet this criteria.
If this formula is working correctly, you can create one last formula adding the code from @Formula3
and @Formula4.
Go on to the FinalFormula.
13.6.1.6 FinalFormula
1.
Create a new formula called FinalFormula.
2.
Select the Formula tab in the Crystal Reports Designer and type the following formula:
If ({CUSTOMER.CUSTOMER_NAME} [1 to 2] = "Bi" and
ToText({CUSTOMER.CUSTOMER ID}) [1] = "6") or
({CUSTOMER.CUSTOMER_NAME} [1 to 2] = "Ro" and
ToText({CUSTOMER.CUSTOMER ID}) [1] = "5") Then
"PREFERRED CUSTOMER"
2011-05-06247
Formulas

Else
"DOES NOT FIT CRITERIA"
3.
Place the formula where you want it to appear in the Body section of the report. You can now delete
all other formulas from the report. For more information, see Deleting formulas.
4.
Save the report.
5.
Click the Page tab.
6.
Check the values in the report and compare the objects to see if the object values returned by
@FinalFormula are correct.
You should see "PREFERRED CUSTOMER" next to the customers whose names begin with "Bi"
and IDs begin with 6, or the customers whose names begin with "Ro" and IDs begin with 5. You
should see "DOES NOT FIT CRITERIA" next to all the Customer IDs that do not meet this criteria.
You can use this same process of condition-by-condition testing for any formulas as a means of
systematically checking them.
13.7 Error Messages and Formula Compiler Warnings
A ) is missing.
Parentheses must be used in pairs; each opening parenthesis must be matched with a closing
parenthesis. One of your opening parentheses is not matched by a closing parenthesis. Insert the
missing parenthesis and recheck.
A ] is missing.
Brackets must be used in pairs; each opening bracket must be matched with a closing bracket. One of
your opening brackets is not matched by a closing bracket. Insert the missing bracket and recheck.
A Boolean range variable is not allowed.
You have entered a Boolean range variable. Range variables are allowed in all data types other than
Boolean. Either change the data type to something other than Boolean, or enter a Boolean item variable
to replace the Boolean range variable.
A day number must be between 1 and the number of days in the month.
You have entered a day number that does not fit the month. The Formula Checker displays this warning
if, for the month of January, for example, you enter a day number of zero (0) or a number 32 or greater.
Change the day number to fit the month and recheck.
An object is required here.
You have entered something in your formula other than an object at a position where an object is
expected. Correct the problem and recheck.
2011-05-06248
Formulas

A formula cannot refer to itself, either directly or indirectly.
You cannot enter a formula that refers to itself. For example, in creating the formula @Profit, you cannot
use @Profit as the argument to a function. Remove the reference and recheck.
A function is required here.
The Formula Editor is expecting a function but none was entered. Review your formula and enter the
required function or correct the formula if it is in error.
A month number must be between 1 and 12.
You have entered a month number that falls outside the allowable range. Enter a month number between
1 and 12 and recheck.
A string can be at most 65534 characters long.
The program allows strings in formulas to be up to 65534 characters long. You have entered a string
that exceeds that limit. Reduce the length of the string and recheck.
A subscript must be between 1 and the length of the string.
You have entered a subscript number that specifies a character that does not exist. If you enter a
subscript that references the 6th or the 8th character in a five character string, for example, you will get
this warning. Change the subscript to a value that exists and recheck.
A subscript must be between 1 and the size of the array.
You have entered a subscript that specifies an array item that does not exist. If you enter a subscript
that references the 6th or 8th item in a five item array, for example, you will get this warning. Change
the subscript to a value that exists and recheck.
A subtotal condition is not allowed here.
You have entered a subtotal condition for a subtotal that uses something other than a date or Boolean
object as the sort and group by object. Your subtotal does not require a condition. Delete the condition
and continue.
A subtotal condition must be a string.
You have entered a subtotal condition that is not in string format. Make certain when you enter the
condition in the formula that it is surrounded by single or double quotation marks.
A variable cannot be redeclared with a different type.
You have declared a variable with the same name but a different data type than a variable already
declared. This is not allowed. Either change the name of the variable or change the data type so it
conforms with the original data type.
A variable is required here.
You have used the assignment operator (:=) in a formula without preceding it with a variable. The
program expects to see a variable immediately before (to the left of) the assignment operator. Enter a
variable and try again.
2011-05-06249
Formulas

A variable name is expected here.
You have declared a variable data type without declaring a variable name. You must enter a variable
name to complete the declaration. Enter the variable name and continue.
Access denied.
DOS will not allow access to a file specified. Make certain the file is not in use by another program (or
another user on a network), and/or make certain you have the right network permissions and try again.
An error occurred when calling the custom function 'sampleFunction'.
An error occurred in your report when it tried to call the custom function specified.
Cannot allocate memory.
This message typically indicates that there is not enough memory available. Close any reports that are
not needed, and exit any programs that are not essential. Then try again.
Cannot reallocate memory.
This message typically indicates that there is not enough memory available. Close any reports that are
not needed, and exit any programs that are not essential. Then try again.
custom function, a return value must be specified by assigning a value to the function name.
You must assign a return value to the function.
Dates must be between year 1 and year 9999.
You have entered a date that falls outside the allowable range. Enter a date that falls within the range
of years 1 to 9999 (including the end values), and then recheck.
Disk full.
You have attempted to save a report to a disk that is full. Either save to a different disk, or delete
unnecessary files from the current disk and try again.
Division by zero.
You have entered a formula that attempts a division by zero. The program does not allow such a division.
Edit the formula so it does not attempt to divide by zero, and then recheck.
To avoid this type of problem, you can use a test such as this:
If {file.FORECAST} = 0 Then
0
Else
{file.SALES} / {file.FORECAST}
Error in formula code. Please contact Business Objects, Information Management Group.
There is something unusual about the formula that was not foreseen. Please save the formula text that
produced this warning and contact the company.
Error in parse tree. Please contact Business Objects, Information Management Group.
In parsing your formula, the program encountered a situation that the parse tree could not process.
Please save the formula text that produced this warning and contact the company.
2011-05-06250
Formulas

Object still in use.
The object you are requesting is currently in use. Try again once the object becomes available.
Objects cannot be used within a custom function.
You have tried to use an object within a custom function. Objects cannot be used in custom functions.
File name already in use. Please close the window for xxx before saving under this name.
You have tried to save a file under the name of a file already in use in an open report. Close that report
first, and then try again.
File not found.
The file name you specified cannot be found. Either the filename or the path is incorrect. Enter the
correct filename/path and try again. In some instances the file WBTRVDEF.DLL is missing from your
directory. This file is required for reading Data Dictionary files along with WBTRCALL.DLL.
File permission error.
You have requested a file for which you do not have permission. You must gain the necessary permission
before you can activate the file.
Incorrect Borland Custom Control DLL (BWCC.DLL) installed. Version m.n or higher required.
The program is finding and using a version of BWCC.DLL that is too old for proper program operation.
Here's how this can happen:
BWCC.DLL is installed in the CRW directory (the same directory in which CRW.EXE or CRW32.EXE
resides) during program installation.
The CRW directory is added to the end of the path statement in AUTOEXEC.BAT during installation (if
you allowed the installation program to update the path statement).
If an older version of BWCC.DLL has been installed in the Windows directory, the Windows System
directory, or a directory that appears earlier in the path than the CRW directory (the result of an earlier
installation), the program picks up that version, not the newer version in the CRW directory.
To correct this problem
The correct version of BWCC.DLL is shipped with Crystal Reports. To correct the problem, delete older
versions of BWCC.DLL that reside in directories earlier in the path than CRW.
If this does not solve the problem, move the latest version of BWCC.DLL from the CRW directory to
the Window's directory.
Internal Error: PrintDlg fail: 4100.
There is no printer driver installed in the Windows Control Panel. When Crystal Reports opens a report,
it looks for the printer that was saved with the report. If that printer cannot be found, it looks for the
default printer. If there is no default printer set, the error message results.
Insufficient memory available.
There is not enough memory available to do what you want the program to do. Free up memory and
try again.
2011-05-06251
Formulas

Invalid DOS version.
You are using a version of DOS earlier than Version 3.0. Install DOS Version 3.0 or higher and try
again.
Invalid file handle.
You have specified a file handle that does not exist. Enter the correct file handle and continue.
No default printer selected. You may use the Control Panel to select a default printer.
Please use the Control Panel to select a printer and start the program again.
You cannot begin to utilize the program unless you have a default printer selected. Trying to start the
program without a default printer results in this error message.
To select a default printer.
Click the Printers icon in the Windows Control Panel; the Printers dialog box appears with all installed
printers listed in the Installed Printers box.
If you have not yet installed the printer, install it first, and then double-click its listing.
Note:
• A printer must first be given the status Active before it can be selected as the default printer.
• For additional information in installing printers and default printers, please refer to the documentation
that came with Microsoft Windows.
Non unique folder reference: foldername.
This is usually caused if a folder name contains an underscore or is more than 15 characters long, or
starts with a number.
Not enough arguments have been given to this function.
The function requires more arguments than you have entered. Enter the missing argument(s) and
recheck.
Not enough memory.
There is not enough memory available to process the command. Close any reports that are not needed,
and exit any programs that are not essential. Then try again.
Numeric overflow.
An intermediate result or the final result cannot be represented because it is too big. Restructure or
subdivide the formula to create smaller results, and then recheck.
Physical database not found.
The program is unable to locate either a DLL or the database. Check to make certain that the directories
that hold these files are listed in the path statement.
Please cancel printing before closing.
Your Report Engine call is attempting to close a job while it is still in progress. Make certain that you
cancel the printing before you close the print job.
2011-05-06252
Formulas

Printer not available.
There are problems connecting to the selected printer. Reselect the printer through the Windows Control
Panel and try again.
Report file already exists. Overwrite sample.rpt?
You are attempting to save a report under the same name as an existing report. This will overwrite the
existing report and make it no longer available. Click Yes to overwrite the report, No to stop the saving
process to give you a chance to select a different name.
Report has changed. Save changes to sample.rpt before closing?
You are attempting to close a report window without first saving it, even though you have made changes
to the report since you opened it. The changes will be lost unless you save the report before closing.
Click Yes to save the changes, No to close the report without saving the changes.
'sampleFunction' must be assigned a value within the custom function.
You must assign a value to the function within the custom function.
Sorry, this feature is not yet implemented. Try again later.
You have attempted to use a feature that has not been implemented in the current release. Wait till an
upgrade that implements the feature and try again.
The formula cannot be evaluated at the time specified.
You are trying to force an object, formula, or function to be evaluated earlier than is possible. Evaluation
time functions can only force a later evaluation time, never an earlier one. Change the formula to
accommodate the required evaluation time.
The formula is too complex. Try simplifying it.
The formula could not be evaluated because it exceeds the limit of 50 pending operations. Pending
operations are operations that are on hold due to order of precedence rules; they will be performed
once the operations with higher level precedence are finished.
Sometimes it is possible to rearrange the formula and calculate the same value without requiring as
many pending operations. As a very simplified example, in the formula 2+3*4, the addition cannot be
performed until the multiplication has been done. The addition thus becomes pending, on hold until the
multiplication is complete. If the formula is written as 3*4+2 instead, the operations can be performed
left-to-right with the same result, thus eliminating the pending operation.
Correct the formula and recheck.
The matching } for this object name is missing.
Object names must be enclosed in braces { }. You have entered one of the required braces but not the
other. Insert the missing brace and recheck.
The matching ' for this string is missing.
A string that begins with a ' must end with a ' before the end of the line. You have used the ' in one of
those positions but not the other. Insert the missing punctuation and recheck.
2011-05-06253
Formulas

The matching " for this string is missing.
A string that begins with a " must end with a " before the end of the line. You have used the " in one of
those positions but not the other. Insert the missing punctuation and recheck.
The number of copies of the string is too large or not an integer.
Using the ReplicateString function, you have requested too many copies or you are requesting a
non-integer number of copies. Lower the number of copies requested or specify an integer number of
copies and try again.
The number of days is too large or not an integer.
When adding days to dates, or subtracting days from dates, you can use only an integer number of
days (a whole number); you cannot add or subtract non-integer numbers of days (1/2 days, 3.6 days,
and so on). Additionally, once you add or subtract days from a date, the resulting date must fall within
the allowable (year) date range, 0000-9999. If you enter a non-integer number of days or if your result
falls outside the allowable range, the Formula Editor displays this warning. Correct the problem and
recheck.
The number of decimal places is too large or not an integer.
The second argument to the Round(x, # places) or ToText(x, # places) functions must be a small integer
(whole number). You have entered a number as the second argument (# places) that specifies too
many decimal places or that is not an integer. Change the number to a small integer and recheck.
The record selection formula cannot include 'PageNumber', 'RecordNumber', 'GroupNumber',
'Previous', or 'Next'.
You cannot include the following Print State functions in your record selection formula: PageNumber,
RecordNumber, GroupNumber, Previous, or Next. Eliminate the object(s) and recheck.
The record selection formula cannot include a summary object.
You have included a summary object in a record selection formula. The program does not allow this.
Remove the summary object and recheck.
The remaining text does not appear to be part of the formula.
You have provided a formula operand (the item on which a formula operation is to be performed) where
none is expected. Often this means that you have forgotten an operator, or an earlier part of a function,
or some required syntax item. Correct the error and then recheck.
The result of a formula cannot be a range.
You have created a formula that results in a range. A formula must result in a single value. Correct the
formula and recheck.
The result of a formula cannot be an array.
You have created a formula that results in an array. A formula must result in a single value. Correct the
formula and recheck.
The result of the selection formula must be a Boolean.
You have created a selection formula that returns something other than a Boolean value. Reconstruct
the formula using comparison operators (=, and so on) and recheck.
2011-05-06254
Formulas

The special variable object could not be created.
This message typically indicates that there is not enough memory available. Close any reports that are
not needed, and exit any programs that are not essential. Then try again.
The string is non-numeric.
The argument to the ToNumber function must be a number stored as a string (for example, a customer
number, an ID number, and so on). The string may be preceded by a minus sign and may contain
leading and trailing blanks. You have used an argument that is non-numeric and therefore cannot be
converted to a number. Change the argument to numeric and recheck.
The summary object could not be created.
This message typically indicates that there is not enough memory available. Close any reports that are
not needed, and exit any programs that are not essential. Then try again.
The variable could not be created.
The variable you declared could not be created. Check the spelling and syntax of your declaration
statement and try again.
The keyword 'Else' is missing.
In an If-Then-Else expression, you have left out (or misplaced) the 'Else' component and the formula
will not function. Insert (or reposition) the 'Else' component and recheck.
The keyword 'Then' is missing.
In an If-Then-Else expression, you have left out (or misplaced) the 'Then' component and the formula
will not function. Insert (or reposition) the 'Then' component and recheck.
There are too many characters in this object name.
An object name may have at most 254 characters. You have entered an object name that exceeds that
number. Enter an object name that has an allowable number of characters and try again.
There are too many characters in this string.
Strings in formulas are allowed to be up to 65534 characters long. You have entered a string that
exceeds that limit. Reduce the length of the string (or break it into 2 or more concatenated strings) and
recheck.
There are too many letters and digits in this name.
A variable name can have at most 254 characters. You have entered a name that exceeds that number.
Shorten the name to conform to the limit and continue.
There is an error in this custom function. Please edit it for more details.
You have tried to save a custom function that has an error in it. Correct the error that was indicated
and try again.
There must be a subtotal section that matches this object.
You have entered a subtotal in a formula without there being a corresponding subtotal in the report
itself. Any subtotal you enter in a formula must duplicate a subtotal already in your report. Add the
required subtotal to the report and then re-enter the formula, or delete the formula, and then recheck.
2011-05-06255
Formulas

This array must be subscripted. For example: Array [i].
You have entered an array without enclosing it in brackets. Enclose the array in brackets and recheck.
This object cannot be summarized.
You have entered a summary object that does not already exist in your report. Any summary object
you enter in a formula must duplicate a summary object already in your report. Either enter the summary
object in your report first and then re-enter it in the formula, or do not enter the summary object in the
formula at all.
This object cannot be used as a subtotal condition object.
The object you are entering as a condition object causes the subtotal in the formula not to match any
subtotal in the report. Any subtotal you enter in a formula must duplicate a subtotal already in your
report. Either enter the subtotal in your report first and then re-enter it in the formula, or do not enter
the subtotal in the formula at all.
This object cannot be used because it must be evaluated later.
You are trying to force an object, formula, or function to be evaluated earlier than is possible. Evaluation
time functions can only force a later evaluation time, never an earlier one. Change the formula to
accommodate the required evaluation time.
This object has no previous or next value.
You have used an object for which there is no "previous" value as the argument for the Previous or
PreviousIsNull function, or you have used an object for which there is no "next" value as the argument
for the Next or NextIsNull function. To use either of those functions, replace the argument with an object
that contains the appropriate values.
This object must be in the same section as the current formula.
Since the object was put into the formula as an operand, it has been moved to a section where it is no
longer a valid operand.
This object name is not known.
You have entered an object name that does not appear in any of the active databases. Correct the
spelling of the object name and/or its alias, and then recheck. Or, to enter an object name from a
database that is not currently active, activate the database first and then re-enter the object name.
This formula cannot be used because it must be evaluated later.
You are trying to force an object, formula, or function to be evaluated earlier than is possible. Evaluation
time functions can only force a later evaluation time, never an earlier one. Change the formula to
accommodate the required evaluation time.
This function cannot be used because it must be evaluated later.
You are trying to force an object, formula, or function to be evaluated earlier than is possible. Evaluation
time functions can only force a later evaluation time, never an earlier one. Change the formula to
accommodate the required evaluation time.
2011-05-06256
Formulas

This function cannot be used within a custom function.
You have tried to use a function or formula that will not work in a custom function, that is it is not
"stateless".
This group section cannot be printed because its condition object is non-existent or invalid.
Your report contains a group section that is based on a condition object that is either no longer in the
report or changed so it is invalid for the group section. Review your grouping criteria to identify and
correct the source of the problem.
This subtotal condition is not known.
You have entered a subtotal condition that does not appear anywhere in your report. Any subtotal you
enter in a formula must duplicate a subtotal already in your report. Change the condition and recheck.
Too many arguments have been given to this function.
You have entered an array as the argument to a non-array function. This kind of problem can occur,
for example, if you forget to use brackets (the required syntax items for an array) to enclose an array.
Too many items have been given for this array.
The program allows up to 50 values in an array. You have exceeded this limit. Reduce the number of
values in the array and recheck.
Too many open files.
You have too many open files (databases, reports) given the number of files you specified in the
CONFIG.SYS FILES = statement. To prevent this error from recurring, either use fewer files or increase
the number of files specified in the FILES = statement.
Missing or incorrect operand warnings.
The following warnings appear when the Formula Editor expects to find a specific kind of operand (the
item on which a formula operation is to be performed), and finds something different. For example, the
formula 5>a is comparing a number to text (the old comparing apples to oranges analogy). When the
Formula Editor sees that the number five is being compared to something, it expects that something
to be another number. If anything other than a number appears, it displays the warning: A number
is required here.
A Boolean array is required here.
A Boolean is required here.
A currency amount is required here.
A currency array is required here.
A currency range is required here.
A date array is required here.
A date is required here.
A date range is required here.
A number array is required here.
2011-05-06257
Formulas

A number array or currency array is required here.
A number, currency amount, Boolean value, or string is expected here.
A number, currency amount, Boolean, date, or string is required here.
A number, currency amount, date, or string is required here.
A number, currency amount, or date is required here.
A number object or currency amount object is required here.
A number is required here.
A number or currency amount is required here.
A number range is required here.
A string array is required here.
A string is required here.
A string or an array of values is required here.
An array of values is required here.
The custom function name 'sampleFunction' is expected here.
13.8 Creating Formulas with Crystal Syntax
This section provides you with an overview of various parts of a formula. You learn about Crystal syntax
and the techniques you can use when creating a formula.
13.8.1 Crystal syntax overview
Syntax rules are used to create a correct formula. Almost any formula written with one syntax can be
written with another.
13.8.2 Crystal syntax fundamentals
2011-05-06258
Formulas

The result of a formula, or the value that is printed when the formula is placed in a report, is called the
value returned by the formula. Every formula in Crystal Reports must return a value. For example, here
is a simple Crystal syntax formula that returns a value of 10:
10
The value returned by a formula can be one of the seven simple data types supported. These are
Number, Currency, String, Boolean, Date, Time, and DateTime.
Note:
Crystal Reports also supports range types and array types, but these cannot be returned by a formula.
For example, suppose a company has a shipping policy in which orders over $1,000 are insured, but
orders below that amount are not insured:
//A formula that returns a String value
If {Orders.Order Amount} >= 1000 Then
"Insured shipping"
Else
"Regular shipping"
Tip:
The text following the two forward slashes is a comment for someone reading this formula and is ignored
by the Crystal syntax compiler.
The formula returns the text string value "Insured shipping" if the value of the result object {Orders.Order
Amount} is greater than or equal to 1000; otherwise, it returns the text string value "Regular Shipping"
otherwise.
13.8.2.1 Crystal syntax is not case-sensitive
For example, the keyword Then could also be typed in as then or THEN. This is true of all variable
names, functions, and keywords used in a Crystal syntax formula.
Note:
The only exception to this rule is for strings. The string "Hello" is not the same as the string "hello".
13.8.3 Comments (Crystal syntax)
Formula comments are notes included with a formula to explain its design and operation. Comments
do not print and they do not affect the formula, but they appear on the Formulas page. You can use
comments to explain the purpose of a formula or explain the steps involved in writing it.
Comments begin with two forward slashes (//) and are followed by the text of the comment. Everything
that follows the slashes on the same line is treated as being part of the comment:
//This formula returns the string "Hello"
//This is another comment
2011-05-06259
Formulas

"Hello" //Comments can be added at the end of a line
//Comments can occur after the formula text
13.8.4 Objects (Crystal syntax)
Many of the objects used in the construction of a report can be referred to in your formulas. For example,
database, parameter, running total, SQL expression, summary, and group name objects can all be
used in a formula. You can also refer to other formulas in your formula.
The easiest way to insert an object into your report is to select it when prompted from the list of result
objects. This ensures that the correct syntax for the object is used.
Click the appropriate link to jump to that section:
13.8.4.1 How objects appear in formulas
Database, parameter, formula, running total and SQL expression objects have their names surrounded
by braces. Result object names are taken from the database. For example:
Result object: {Employee.Last Name}
Parameter, formula, running total, and SQL expression object names are specified when the objects
are created.
• Parameters also includes a question mark: {?my parameters}.
• Formulas include an at sign: {@another formula}.
• Running totals objects include a pound sign: {#my running total}.
• SQL expression objects include a percent sign: {%my SQL expression}.
Summary and group name objects look like function calls. However, they are really shorthand notation
for a report object.
• Sum summary object: Sum({Orders.Order Amount}, {Orders.Ship Via}).
• Group name object: GroupName({Orders.Ship Via}).
13.8.4.2 Sample formulas using objects (Crystal syntax)
2011-05-06260
Formulas

The formula in this example uses the Xtreme database. To find out how many days it takes to ship the
product from the date when the order was placed, you can just subtract the ship date result object from
the order date result object:
//A formula that uses database fields
{Orders.Ship Date} - {Orders.Order Date}
To find the total dollar amount of a given product that was ordered, multiply its unit price by the quantity
ordered:
{Orders Detail.Unit Price} * {Orders Detail.Quantity}
To calculate a sale price of 80 percent of the original unit price:
{Orders Detail.Unit Price} * 0.80
13.8.5 Expressions (Crystal syntax)
An expression is any combination of keywords, operators, functions, and constant values that result in
a value of a given type. For example:
//An expression that evaluates to the Number value 25
10 + 20 - 5
//An expression that evaluates to the String value
//"This is a string."
"This is a string."
A Crystal syntax formula consists of a sequence of expressions. The value of the final expression is
the value returned by the formula and what gets printed. Each expression must be separated from the
previous expression by a semicolon (;).
Click the appropriate link to jump to that section:
13.8.5.1 Multiple expressions (Crystal syntax)
Typically, each expression takes one line, but you can continue an expression onto the next line if you
need more space.
The formula below consists of five expressions. It returns the Number value 25 since that is the value
of the last expression in the formula.
Example
//Expressions example
//The first expression. Its value is the Number
//value 30
10 + 20;
//The second expression. Its value is the String
//"Hello World". It takes up two lines.
"Hello " +
"World";
2011-05-06261
Formulas

//The third expression. Its value is of Number type
{Orders Detail.Quantity} * 2 - 5;
//The fourth expression. Its value is of String type
If {Orders Detail.Quantity} > 1 Then
"multiple units"
Else
"one unit";
//The fifth and final expression. Its value is the
//Number value 25
20 + 5
Placing a semicolon after the last expression in the formula is also allowed, but is optional. For example,
the above formula could have ended with:
20 + 5;
Some of the sample formulas in the Expressions (Crystal syntax) section do not have semicolons. This
is because they consist of a single expression, and a semicolon is optional after the last expression.
Many formulas in Crystal syntax can be written as a single expression.
Notice that there is no semicolon after the "multiple units" string. In fact, if you put a semicolon there,
the program will report an error. This is because a semicolon separates expressions, and the
Else
"one unit";
is not a separate expression. It does not stand alone apart from the If. In fact, it is an integral part of
the If expression since it describes the value that the If expression will return under certain circumstances.
Note:
The example is not a practical example because the first four expressions in the formula did not have
any effect on the last expression.
13.8.5.2 How earlier expressions affect later expressions (Crystal syntax)
The fact that a Crystal syntax formula is a sequence of expressions whose result is the value of the
final expression is the most important concept in understanding Crystal syntax. This expression-based
syntax allows you to write very short formulas with a lot of functionality.
Example
//First expression. It declares the Number variable x
//and then returns the value of an uninitialized
//Number variable, which is 0.
NumberVar x;
//Second expression. It assigns the value of 30 to x,
//and returns 30.
x := 30
The above formula would give an error if the first expression were omitted. This is because the second
expression refers to the Number variable x, and the program needs to have x declared before it
understands expressions involving it.
In general, you use variables to get the earlier expressions in a formula to affect the final expression.
For more information, see Variables (Crystal syntax).
2011-05-06262
Formulas
13.8.5.3 Using the If expression (Crystal syntax)
The If expression is one of the most widely used features of Crystal syntax. It also provides insight
into the nature of expressions. Consider the earlier If expression as a separate formula. Notice that
because this formula is a single expression, it does not need a semicolon:
If {Orders Detail.Quantity} > 1 Then
"multiple units"
Else
"one unit"
Suppose you wanted to modify this formula so that it either prints "multiple units" or the number 1.
//An erroneous formula
If {Orders Detail.Quantity} > 1 Then
"multiple units"
Else
1
This formula will result in an error. This is because the values in this expression are different types:
"multiple units" is a String value and 1 is a Number value. Crystal Reports requires that the value of an
expression always be of a single type.
Note:
This example can be corrected by using the CStr function to convert the Number 1 to a String value.
For example, the Number 1 is converted to the string "1" by calling CStr (1, 0).
//A correct formula
If {Orders Detail.Quantity} > 1 Then
"multiple units"
Else
CStr (1, 0) //Use 0 decimals
For more information on the If expression, see Control structures (Crystal syntax).
13.8.6 Assignment (Crystal syntax)
The assignment operator is a colon followed by an equals sign (:=).
Example
//Assign the Number value of 10 to the variable x
x := 10;
//Assign the String value of "hello" to the
//variable named greeting
greeting := "hello";
The equality operator (=) is used to check when two values are equal. A common error is to use the
equality operator when the assignment operator is actually intended. This can generate a mysterious
2011-05-06263
Formulas

error message or no error message at all since it is often syntactically correct to use the equality operator.
For example:
greeting = "hello";
The above formula checks if the value held by the variable greeting is equal to the value "hello". If it is,
then the expression's value is True, and if is not then the expression's value is False. In any case, it
is a perfectly correct Crystal syntax expression (assuming that the greeting is a String variable).
13.8.7 Simple data types (Crystal syntax)
The simple data types in Crystal Reports are Number, Currency, String, Boolean, Date, Time, and
DateTime.
13.8.7.1 Number (Crystal syntax)
Enter numbers without any comma separators or currency symbols (generally you would want to have
formatted numbers appearing as the result of a formula and not in the formula itself).
Example
10000
-20
1.23
13.8.7.2 Currency (Crystal syntax)
Use the dollar sign ($) to create a Currency value.
Example
$10000
-$20
$1.23
You can also use the CCur function. The initial C in CCur stands for convert and it can be used to
convert Number values to Currency values:
CCur (10000)
CCur (-20)
CCur (1.23)
2011-05-06264
Formulas

13.8.7.3 String (Crystal syntax)
Strings are used to hold text. The text must be placed between double quotation marks (") or apostrophes
(') and cannot be split between lines. If you want to include double quotation marks in a string delimited
by double quotation marks, use two consecutive double quotation marks. Similarly, if you want to include
an apostrophe in a string delimited by apostrophes, use two consecutive apostrophes.
Example
"This is a string."
"123"
"The word ""hello"" is quoted."
'This is also a string.'
'123'
'Last Year''s Sales'
If you use double quotes for the left side of the string, you must use double quotes on the right side.
Similarly for apostrophes. The following example is incorrect:
'Not a valid string."
You can extract individual elements or substrings from a string by specifying the character position or
a range of character positions. Negative values are allowed; they specify the position starting from the
end of the string.
"hello" [2] //Equal to "e"
"hello" [-5] //Equal to "h"
"604-555-1234" [1 to 3] //Equal to "604"
"abcdef" [-3 to -1] //Equal to "def"
You can also extract substrings from a string using the Left, Right and Mid functions.
13.8.7.4 Boolean (Crystal syntax)
The valid Boolean values are:
True
False
Note:
Yes can be used instead of True and No instead of False.
13.8.7.5 Date, Time, and DateTime (Crystal syntax)
2011-05-06265
Formulas
The DateTime type can hold date-times, dates only, or times only and thus is rather versatile. The Date
type holds dates only and the Time type holds times only. The Date and Time types are more efficient
than the DateTime type, and so can be used in situations where the added functionality and flexibility
of the DateTime type is not needed.
You can create DateTime values directly using the date-time literal construction, which is formed by
typing in the date-time between two pound (#) signs. Many different formats are supported.
Note:
Date-time literals cannot be split between lines.
Examples
#8/6/1976 1:20 am#
#August 6, 1976#
#6 Aug 1976 13:20:19#
#6 Aug 1976 1:30:15 pm#
#8/6/1976#
#10:20 am#
Even though #10:20 am# looks like it could have the Time type and #8/6/1976# looks like it could have
the Date type, they do not. They both have the DateTime type, as do all date-time literals. For example,
you can think of #10:20 am# as a DateTime value with a null date part. To convert it to the Time type
use CTime (#10:20 am#).
Instead of using date-time literals, you can use CDateTime to convert a String to a DateTime. For
example,
CDateTime ("8/6/1976 1:20 am")
CDateTime ("10:20 am")
However, there is one key difference between using date-time literals and the above usage of CDateTime.
Date-time literals always use U.S. English date formats rather than settings from the locale of the
particular computer on which Crystal Reports is running. Thus, the date-time literal examples above
would work on all computers. On the other hand, on a French system, you could use constructions like:
CDateTime ("22 aout 1997") //Same as #Aug 22, 1997#
Date values can be constructed with CDate and Time values with CTime:
CDate ("Aug 6, 1969")
CDate (1969, 8, 6) //Specify the year, month, day
//Converts the DateTime argument to a Date
CDate (#Aug 6, 1969#)
CTime ("10:30 am")
CTime (10, 30, 0) //Specify the hour, minute, second
CTime (#10:30 am#)
13.8.8 Range data types (Crystal syntax)
Ranges are designed to handle a spectrum of values. Range types are available for all the simple types
except for Boolean. That is: Number Range, Currency Range, String Range, Date Range, Time Range
and DateTime Range. You can generate ranges using the To, _To, To_, _To_, UpTo, UpTo_, UpFrom,
and UpFrom_ keywords. In general, To is used for ranges with two endpoints, and UpTo and UpFrom
2011-05-06266
Formulas

are used for open ended ranges (only one endpoint). The underscores are used to indicate whether or
not the endpoints are in the range.
Examples of Number Range values
The range of numbers from 2 to 5 including both 2 and 5:
2 To 5
The range of numbers from 2 to 5, not including 2 but including 5:
2 _To 5
All numbers less than or equal to 5:
UpTo 5
All number less than 5:
UpTo_ 5
Examples of DateTime Range values:
#Jan 5, 1999# To #Dec 12, 2000#
UpFrom #Jan 1, 2000#
13.8.8.1 Using ranges in formulas (Crystal syntax)
There are twenty-seven functions in Crystal Reports that specify date ranges. For example, the function
LastFullMonth specifies a range of date values that includes all dates from the first to last day of the
previous month. So if today's date is September 15, 1999 then LastFullMonth is the same as the range
value CDate (#Aug 1, 1999#) To CDate (#Aug 31, 1999#).
Ranges are often used with If or Select expressions. The following example computes student letter
grades based on their test scores. Scores greater than or equal to 90 receive an "A", scores from 80
to 90, not including 90, receive a "B" and so on.
//Compute student letter grades
Select {Student.Test Scores}
Case UpFrom 90 :
"A"
Case 80 To_ 90 :
"B"
Case 70 To_ 80 :
"C"
Case 60 To_ 70 :
"D"
Default :
"F";
The above example uses the Select expression which is discussed in more detail in the control structures
section. You can check if a value is in a range by using the In operator. For example:
5 In 2 To 10; //True
5 In 2 To_ 5; //False
5 In 2 To 5; //True
2011-05-06267
Formulas

The Maximum and Minimum functions can be used to find the endpoints of a range:
Maximum (2 To 10) //Returns 10
13.8.9 Array data types (Crystal syntax)
Arrays in Crystal Reports are ordered lists of values that are all of the same type. These values are
known as the array's elements. The elements of an array can be any simple type or range type. Arrays
can be created using square brackets ([ ]).
Examples
An array of three Number values. The first element is 10, the second is 5, and the third is 20.
[10, 5, 20]
An array of seven String values:
["Sun", "Mon", "Tue", "Wed", "Th", "Fri", "Sat"]
An array of two DateTime Range values:
[#Jan 1, 1998# To #Jan 31, 1998#,
#Feb 1, 1999# To #Feb 28, 1999#]
You can extract individual elements out of an array using square brackets containing the index of the
element you want. This is called subscripting the array:
[10, 5, 20] [2] //Equal to 5
Number ranges can also be used to subscript arrays. The result is another array. For example:
[10, 5, 20] [2 To 3] //Equal to [5, 20]
Arrays are most useful when used with variables and so will be discussed in more detail in the Variables
(Crystal syntax) section. Using variables, you can change the individual elements of an array and resize
the array to accommodate more elements. For example, you can accumulate result object values into
a global array variable in a detail level formula, and then use a formula in a group footer to perform a
calculation based on those values. This enables you to perform a wide variety of customized summary
operations.
13.8.10 Variables (Crystal syntax)
This section describes the key components of variables and shows you how to create variables and
assign values to them.
2011-05-06268
Formulas

13.8.10.1 Variables overview
A variable represents a specific data item, or value, and acts as a placeholder for that value. When a
formula encounters a variable, the formula searches for the value of the variable and uses it in the
formula. Unlike a constant value, which is fixed and unchanging, a variable can be repeatedly assigned
different values. You assign a value to a variable and the variable maintains the value until you later
assign a new value. Because of this flexibility, it is necessary for you to declare variables before you
use them so that Crystal Reports is aware of them and understands how you intend to use them.
Example
If you wanted to report on customers by area code, you could create a variable that extracts the area
code from a customer fax number. The following is an example of a variable called areaCode:
Local StringVar areaCode;
areaCode := {Customer.Fax} [1 To 3];
The first line of the variable example is the variable declaration; it gives the variable a name and type.
The result object {Customer.Fax} is a String object and [1 To 3] extracts the first three characters from
its current value. The variable areaCode is then assigned this value.
13.8.10.2 Variable declarations (Crystal syntax)
Before using a variable in a formula, you must declare it.
A variable can hold values of a given type. The allowed types are the seven simple types (Number,
Currency, String, Boolean, Date, Time and DateTime), the six range types (Number Range, Currency
Range, String Range, Date Range, Time Range and DateTime Range) and variables that hold arrays
of the previously mentioned types. This gives a total of 26 different types that a variable can have.
When you declare a variable, you also specify its name. A variable cannot have the same name as any
function, operator or other keyword that is valid for Crystal syntax. For example, your variable cannot
be named Sin, Mod or If because Sin is a built in function, Mod is a built in operator and If is a built in
keyword. When typing formulas on the Formulas page, the names of the built in functions, operators
and other keywords are highlighted in a different color and so it is easy to check if the variable name
conflicts.
Once a variable is declared, it can be used in the formula. For example, you might want to assign it an
initial value:
Local NumberVar x; //Declare x to be a Number variable
x := 10; //Assign the value of 10 to x
2011-05-06269
Formulas

Note:
The keyword for declaring the Number variable has a Var at the end. This is true for all the variable
types in Crystal syntax.
A variable can only hold values of one type. For example, if a variable holds a Number value, you cannot
later use it to hold a String.
Example
Local StringVar y;
y := "hello";
//OK- the Length function expects a String argument
Length (y);
//Error- y can only hold String values
y := #Jan 5, 1993#;
//Error- y can only hold String values
y := ["a", "bb", "ccc"];
//Error- the Sin function expects a Number argument
Sin (y);
You can combine declaring a variable and assigning it a value in a single expression. For example:
Local NumberVar x := 10 + 20;
Local StringVar y := "Hello" + " " + "World";
Local DateVar z := CDate (#Sept 20, 1999#);
Local NumberVar Range gradeA := 90 To 100;
This is a good practice because it is more efficient and helps prevent the common mistake of having
incorrectly initialized variables.
Here are some more examples of declaring and initializing range variables:
Local NumberVar Range gradeA;
Local DateVar Range quarter;
gradeA := 90 To 100;
quarter := CDate (1999, 10, 1) To CDate (1999, 12, 31);
13.8.10.3 Variable Scope (Crystal syntax)
Variable scopes are used to define the degree to which variables in one formula are made available to
other formulas. There are three levels of scope in Crystal Reports: local, global and shared. Every
variable has a scope, and this scope is specified when the variable is declared.
13.8.10.3.1 Local Variables (Crystal syntax)
Variables with local scope, also known as local variables, are declared using the Local keyword followed
by the type name (with the Var suffix) followed by the variable name as in the above examples.
Local variables are restricted to a single formula and a single evaluation of that formula. This means
that you cannot access the value of a local variable in one formula from a different formula.
Example
//Formula A
Local NumberVar x;
x := 10;
//Formula B
2011-05-06270
Formulas

EvaluateAfter ({@Formula A})
Local NumberVar x;
x := x + 1;
The function call EvaluateAfter ({@Formula A}) ensures that Formula B will be evaluated after Formula
A is evaluated. Formula A returns a value of 10 and Formula B returns a value of 1. Formula B does
not have access to Formula A's x and thus cannot use the value of 10 and add 1; instead, it uses the
default value for the uninitialized local variable x found in Formula B, which is 0, and adds 1 to it to get
1.
You can also create local variables with the same name but different types in different formulas. For
example, the type declarations in formulas A and B do not conflict with:
//Formula C
Local StringVar x := "hello";
Local variables are the most efficient of the three scopes. They also do not interfere with one another
in different formulas. For these reasons, it is best to declare variables to be local whenever possible.
13.8.10.3.2 Global variables (Crystal syntax)
Global variables use the same memory block to store a value throughout the main report. This value
is then available to all formulas that declare the variable, except for those in subreports. You declare
a global variable as in the following example:
Global StringVar y;
You can also omit the Global keyword which creates a Global variable by default:
StringVar y; //Same as: Global StringVar y;
However, even though global variables are easy to declare, it is recommended that you use them only
when local variables do not suffice.
Since global variables share their values throughout the main report, you cannot declare a global variable
in one formula with one type and then declare a global variable with the same name in a different formula
with a different type.
Example
//Formula A
Global DateVar z;
z := CDate (1999, 9, 18)
//Formula B
NumberVar z;
z := 20
In this case, if you enter and save Formula A first, Crystal Reports will return an error when you check
or try to save Formula B. This is because the declaration of the Global variable z as a Number conflicts
with its earlier declaration in Formula A as a Date.
Using Global variables
Global variables are often used to perform complex calculations where the results of a formula depend
upon the grouping and page structure of the actual printed report. This is accomplished by creating
several formulas, placing them in different sections of the report, and having the different formulas
interact via global variables.
2011-05-06271
Formulas

Example
//Formula C
Global NumberVar x;
x := 10;
//Formula D
//Call the function WhileReadingRecords
WhileReadingRecords;
Global NumberVar x;
x := x + 1
If Formula C is placed in the Report Header and then Formula D is placed in a detail section, Formula
C will be evaluated before Formula D. Formula C will be evaluated once and then Formula D will be
evaluated for each record appearing in the detail section. Formula C returns 10. For the first detail
record, Formula D returns 11. This is because the value 10 of x is retained from when it was set by
Formula C. Formula D then adds 1 to this value, setting x to 11 and then returns 11. For the second
detail record, formula D return 12, adding 1 to the previously retained value of x which was 11. This
process continues for the remaining detail records.
The call to WhileReadingRecords tells Crystal Reports to re-evaluate Formula D as it reads in each
record of the report. Otherwise, since the formula does not contain any result objects, the program
evaluates it only once before reading the records from the database. The formula will then return the
value 11 instead of 11, 12, 13, ... as the successive records are processed.
If the expression x := x + 1 is replaced by x := x + {Orders Detail.Quantity}, you create the effect of a
running total based on {Orders Detail.Quantity}, although it is one starting at 10 rather than 0 because
of Formula C. In this case, you can omit the call to WhileReadingRecords, since it will automatically
occur because the formula contains a result object.
13.8.10.3.3 Shared variables (Crystal syntax)
Shared variables use the same memory block to store the value of a variable throughout the main report
and all of its subreports. Thus shared variables are even more general than global variables. To use a
shared variable, declare it in a formula in the main report as in the following example:
Shared NumberVar x := 1000;
and declare it in a formula in the subreport as in the following example:
Shared NumberVar x;
In order to use shared variables, the variable must be declared and assigned a value before it can be
passed between the main report and the subreport.
13.8.10.4 Declaring array variables (Crystal syntax)
You can declare array variables by following the type name with the keyword Array.
Example
//Declare x to be a Global variable of
//Number Array type
Global NumberVar Array x := [10 , 20, 30];
//cost is a Global variable of Currency Array type
2011-05-06272
Formulas
//It is automatically Global since the scope specifier
//(one of Local, Global or Shared) is omitted.
CurrencyVar Array cost := [$19.95, $79.50, $110.00,
$44.79, $223.99];
//payDays is a Global variable of Date Array type
Global DateVar Array payDays := [CDate(1999, 5, 15),
CDate(1999, 5, 31)];
//y is a Shared variable of String Range Array type
Shared StringVar Range Array y := ["A" To "C",
"H" To "J"];
//days is a Local variable of String Array type
Local StringVar Array days;
days := ["Sun", "Mon", "Tue", "Wed", "Th",
"Fri", "Sat"];
13.8.10.4.1 Using array variables (Crystal syntax)
You can assign values to elements of an array and also use the values of the elements for other
computations.
Example
StringVar Array x := ["hello", "bye", "again"];
x [2] := "once"; //Now x is ["hello", "once", "again"]
//The expression below would cause an error if not
//commented out since the array has size 3
//x [4] := "zap";
//The formula returns the String "HELLO"
UpperCase (x [1])
The Redim and Redim Preserve keywords can be used to resize an array if you want to add extra
information to it. Redim erases the previous contents of the array first before resizing it whereas Redim
Preserve preserves the previous contents.
Local NumberVar Array x;
Redim x [2]; //Now x is [0, 0]
x [2] := 20; //Now x is [0, 20]
Redim x [3]; //Now x is [0, 0, 0]
x [3] := 30; //Now x is [0, 0, 30]
Redim Preserve x [4]; //Now x is [0, 0, 30, 0]
"finished"
Local StringVar Array a;
Redim a [2];
//Assign a value to the first element of the array a
a[1] := "good";
a[2] := "bye";
//The & operator can be used to concatenate strings
a[1] & a[2] //The formula returns the String "goodbye"
13.8.10.4.2 Using Arrays with For loops
Arrays are commonly used with For loops. The following example creates and then uses the Array [10,
20, 30, ..., 100] using a For loop. For more information, see For loops (Crystal syntax).
Local NumberVar Array b;
Redim b[10];
Local NumberVar i;
For i := 1 To 10 Do
(
b[i] := 10 * i
);
b [2] //The formula returns the Number 20
2011-05-06273
Formulas

13.8.10.5 Default values for the simple types (Crystal syntax)
An uninitialized variable will have the default value for its type. In general, it is not a good programming
practice to rely on the default values of types. For example, initialize all local variables in your formula,
initialize all global variables in a formula placed in the Report Header and initialize all shared variables
in a formula placed in the Report Header of the main report.
When an array is resized using the Redim keyword, the entries are filled with default values for the
type. It is useful to know about default values when using If and Select expressions.
13.8.10.5.1 Default values
Number
0
Currency
$0
String
"" //The empty string
Date
Date (0, 0, 0) //The null Date value
Time
The null Time value. Value held by an uninitialized Time variable.
DateTime
The null DateTime value. Value held by an uninitialized DateTime variable.
Note:
It is not recommended that your formulas rely on the values of uninitialized range or array variables.
13.8.10.6 Automatic type conversions (Crystal syntax)
Generally in Crystal Reports, values of one type cannot be used where values of another type are
expected without explicitly supplying a type conversion function. For example:
Local StringVar postalCode;
//Error- assigning a Number value to a String
postalCode := 10025;
//OK - use the type conversion function CStr
//to create "10025"
postalCode := CStr (10025, 0);
2011-05-06274
Formulas

However, there are a few conversions that are made automatically:
• Number to Currency.
• Date to DateTime.
• Simple type to Range value of the same underlying simple type.
For example, the following assignments are correct:
Local CurrencyVar cost;
//Same as: cost := $10
cost := 10;
Local DateTimeVar orderDate;
//Same as: orderDate := CDateTime (1999, 9, 23, 0, 0, 0)
orderDate := CDate (1999, 9, 23);
Local NumberVar Range aRange;
//Same as: aRange := 20 To 20
aRange := 20;
Local NumberVar Range Array aRangeArray;
//Same as : aRangeArray := [10 To 10, 20 To 25, 2 To 2]
aRangeArray := [10, 20 To 25, 2];
Note:
The opposite conversions are not allowed. For example:
Local NumberVar num;
num := 5 + $10; //Error
//OK- convert to Number type using the CDbl function
num := CDbl (5 + $10) //Could also use ToNumber
5 is converted to $5 and added to $10 to make $15. However, this Currency value cannot be automatically
assigned to the Number variable num since automatic conversions from Currency to Number are not
allowed. Similarly, functions accepting a Currency argument can be supplied a Number argument
instead, and the Number argument will be converted to a Currency, whereas functions accepting a
Number argument cannot be supplied a Currency argument without first explicitly converting the Currency
to a Number using CDbl.
13.8.11 Functions (Crystal syntax)
When using a function in a formula, type the name of the function and supply the arguments required.
For example, the Length function requires a String argument and computes the length of the string.
Local StringVar x := "hello";
Length (x) //The formula returns the Number 5
Supplying arguments of the incorrect type required by the function produces an error. For example,
calling Length (3) would produce an error since Length does not accept a Number argument. Functions
sometimes can accept different numbers of arguments or types of arguments. For example, the CDate
function which could accept a single String argument to form a Date value or three Number values
holding the year, month and day respectively and form a Date value from them. For more information,
see Date, Time, and DateTime (Crystal syntax).
Example with the Mid function
Local StringVar x := "hello";
Local StringVar y;
//Start at position 2, go to the end of the string
2011-05-06275
Formulas

y := Mid (x, 2); //y is now "ello"
//Start at position 2, extract 1 character
y := Mid (x, 2, 1) //y is now "e"
These classes of functions are: Math, Summary, Financial, String, Date/Time, Date Range, Array, Type
Conversion, Programming Shortcuts, Evaluation Time, Print State, Document Properties and Additional
Functions. There are also some functions specific to conditional formatting formulas.
13.8.11.1 Non reporting-specific functions (Crystal syntax)
The Math, Financial, String, Date/Time, Type Conversion, and Programming Shortcuts groups consist
mainly of functions that are not specific to reporting, but might be found in any full featured programming
environment.
For example, the Length function is the traditional Crystal syntax function for finding the length of a
string. Crystal syntax also supports Len as a synonym.
13.8.11.2 Summary functions (Crystal syntax)
The Summary function group provides functions for creating summary objects such as:
Sum({Orders.Order Amount}, {Orders.Ship Via})
Summary objects are normally created by inserting them from the Palette and modifying them in the
"Properties" view. They then appear in the "Outline" view and can be added to a formula. However,
they do not need to be created in this way. You can create a summary object exclusively for use by
your formula by filling in the arguments to one of the functions in the Summary functions section
appropriately. However, any groups in the report that the summary object refers to must already exist
in the report.
13.8.11.3 Date Ranges (Crystal syntax)
This category of functions was discussed in the section Range data types (Crystal syntax). One additional
comment is that the Date ranges produced by these functions depend on the current date. For example,
if today's date is September 18, 1999, then LastFullMonth is the Date Range value:
CDate(#Aug 1, 1999#) To CDate(#Aug 31, 1999#)
This functionality is often useful, but what if you want to determine a date range based on a result object
such as {Orders.Order Date}? The Date/Time functions can be used instead.
2011-05-06276
Formulas

For example:
Local DateVar d := CDate ({Orders.Order Date});
Local DateVar Range dr;
dr := DateSerial (Year(d), Month(d) - 1, 1) To
DateSerial (Year(d), Month(d), 1 - 1);
//At this point dr is the Date Range value holding
//the last full month before {Orders.Order Date}
The DateSerial function makes this easy because you don't have to worry about special cases. It never
lets you create an invalid date. For example, DateSerial (1999, 1 - 1, 1) is December 1, 1998.
Note:
In the above example, {Orders.Order Date} is actually a DateTime object and so the CDate function is
used to convert it to a date by truncating the time part.
13.8.11.4 Array functions (Crystal syntax)
The array functions compute summaries of an array's elements. For example, the Sum function when
applied to an array returns the sum of the elements of the array. For example, the following formula
returns 100:
Sum ([10, 20, 30, 40])
13.8.11.5 Evaluation Time functions (Crystal syntax)
These are the reporting specific functions BeforeReadingRecords, WhileReadingRecords,
WhilePrintingRecords and EvaluateAfter. You can use these functions to guide Crystal Reports as to
when your formula should be evaluated.
Should the formula be evaluated before retrieving the records from the database, while reading the
records from the database but before the records have been grouped, sorted and summarized, or while
printing the report, when the records are grouped, sorted and summarized? In general, Crystal Reports
sets an appropriate evaluation time for your formula, based on how much information the formula needs.
For example, if a formula uses a result object, then it cannot be evaluated before the records are read
from the database. However, you sometimes need to force a later evaluation time than normal to get
the desired effect. See Global variables (Crystal syntax) for an example.
13.8.11.6 Print State functions (Crystal syntax)
2011-05-06277
Formulas

These are once again reporting specific functions. For example, the notation {Orders.Order Date} is
used to refers to the value of the object in the current record whereas Previous ({Orders.Order Date})
refers to the value in the immediately preceding record and Next ({Orders.Order Date}) in the next
record. IsNull ({Orders.Order Date}) checks if the object's value is null.
Other examples are PageNumber and TotalPageCount that you can use to access pagination information
about your report.
13.8.11.7 Document Properties functions (Crystal syntax)
These are specific functions, such as PrintDate and ReportTitle, that refer to the report document as a
whole.
13.8.11.8 Conditional formatting functions (Crystal syntax)
To write a conditional formatting formula, right-click the report area or object the formula will affect in
the "Formula Workshop" and click Conditional Formatting. Select the condition and enter the conditional
formula on the "Formulas" page. For example, you can format the {Customer.LAST_YEARS_SALES}
object to print sales of more than $100,000 in green, sales of less than $15,000 in red, and all other
sales in black.
Example
//Conditional formatting example 1
If {Customer.Last Year's Sales} > 100000 Then
crGreen
Else If {Customer.Last Year's Sales} < 15000 Then
crRed
Else
crBlack
Since this is a font color formatting function, the list of Color Constants appears as a commented list
on the Formulas page. This example uses three: crGreen, crRed and crBlack. You could have used
the actual numeric values of the color constants instead. For example, crRed is 255 and crGreen is
32768. However, the formula is more understandable using the color constants. All constant functions
in Crystal syntax can have the "cr" prefix.
Crystal syntax still supports constant functions from previous versions without the "cr" prefix. For
example, you can use "Red" instead of "crRed". However, using the "cr" prefix organizes constant
functions and is recommended.
2011-05-06278
Formulas

Note:
Some formatting attributes do not use constant functions. For example, if you wanted to not print
{Customer.LAST_YEARS_SALES} values if the sales were less than $50,000, you could write the
following conditional formatting formula for the suppress attribute:
//Conditional formatting example 2
If {Customer.Last Year's Sales} < 50000 Then
True //suppress the value
Else
False //do not suppress the value
Or more simply:
//Conditional formatting example 3 -
//equivalent to example 2
{Customer.Last Year's Sales} < 50000
If the last year's sales are less than $50,000, then the expression
{Customer.Last Year's Sales} < 50000
is True, and so the formula returns True. On the other hand, if the last year's sales are greater than or
equal to $50,000, then
{Customer.Last Year's Sales} < 50000
is False and so the formula returns False.
13.8.11.9 General purpose conditional formatting functions (Crystal syntax)
There are three general purpose conditional formatting functions:
• CurrentObjectValue
• DefaultAttribute
• GridRowColumnValue
These functions are displayed at the top of the Functions tree whenever appropriate. DefaultAttribute
can be used for any formatting formula, CurrentObjectValue for any formatting formula where you are
formatting an object value, and GridRowColumnValue for any formatting formula where you are formatting
an object value in a Cross-Tab.
In particular, CurrentObjectValue allows you to conditionally format the cells of a Cross-Tab based on
their value while GridRowColumnValue lets you conditionally format the cells of a Cross-Tab based on
the values of the row or column headings. These two functions are essential in this situation since there
is no other way in the formula language to refer to the values of these objects. For example, if you
wanted Cross-Tab cells to be suppressed if the values are less than 50,000:
//Conditional formatting example 4
CurrentObjectValue < 50000
2011-05-06279
Formulas

13.8.12 Operators (Crystal syntax)
This chapter contains examples of operators in Crystal syntax.
13.8.12.1 Arithmetic operators
The arithmetic operators are addition (+), subtraction (-), multiplication (*), division (/), integer division
(\), percent (%), modulus (Mod), negation (-) and exponentiation (^). Arithmetic operators are used to
combine numbers, numeric variables, numeric objects and numeric functions to get another number.
Examples
//Outstanding preferred stock as a percent of
//common stock
{Financials.Preferred Stock} %
{Financials.Common Stock};
//The square root of 9, Sqr(9) is 3
//The formula returns 17
7 + 2 * 3 - 2 + Sqr(6 + 3) * Length("up");
13.8.12.1.1 Order of precedence (Crystal syntax)
When you create arithmetic expressions that involve several operators, the order that the program
evaluates the various elements of the expression becomes important. In general, the program evaluates
expressions from left to right. However, it also follows the rules of precedence from basic math.
Example
Multiplication and division are performed first from left to right and then addition and subtraction are
performed.
For example, 5 + 10 * 3 = 5 + 30 = 35. You can change this order of precedence by using parentheses.
For example, (5 + 10) * 3 = 15 * 3 = 45. If you are unsure of the order of precedence, it is a good idea
to clarify your intentions with parentheses.
13.8.12.1.2 List of arithmetic operators, from highest precedence to lowest
• Exponentiation (^)
• Negation (-)
• Multiplication, division, and percent (*, /, %)
• Integer Division (\)
• Modulus (Mod)
2011-05-06280
Formulas

• Addition and subtraction (+, -)
13.8.12.2 Comparison operators (Crystal syntax)
The comparison operators are equal (=), not equal (<>), less than (<), less than or equal (<=), greater
than (>) and greater than or equal (>=).
Comparison operators are usually used to compare operands for a condition in a control structure such
as an If expression. Comparison operators as a group all have lower precedence than the arithmetic
operators. Thus, expressions like 2 + 3 < 2 * 9 are the same as (2 + 3) < (2*9).
13.8.12.3 Boolean operators (Crystal syntax)
The Boolean operators are, in order of precedence from greatest to lowest: Not, And, Or, Xor, Eqv and
Imp.
Boolean operators are typically used with comparison operators to generate conditions for control
structures. Boolean operators as a group have lower precedence than the comparison operators. Thus
for example, the expression 2 < 3 And 4 >= -1 is the same as (2 < 3) And (4 >= -1).
13.8.12.4 Null objects and how to use IsNull (Crystal syntax)
In general, when Crystal Reports encounters a null valued object in a formula, it immediately stops
evaluating the formula and produces no value. If you want to handle null object values in your formula,
you must explicitly do so using one of the special functions designed for handling them: IsNull,
PreviousIsNull or NextIsNull.
Example
The {Product.Color} object contains both basic colors such as "red" and "black" and more descriptive
two word colors such as "steel satin" and "jewel green". Here's an example of a formula that writes out
"basic" for the basic colors and "fancy" for the others.
If InStr({Product.Color}, " ") = 0 Then
formula = "basic"
Else
formula = "fancy"
2011-05-06281
Formulas

The function call to InStr searches the {Product.Color} string for a space. If it finds a space, it returns
the position of the space, otherwise it returns 0. Since basic colors are only one word with no spaces,
InStr will return 0 for them.
For some products, such as the Guardian Chain Lock, a color value was not recorded and so the
{Product.Color} object has a null value in the database for that record. Thus, the Guardian Chain Lock
record does not have any word printed beside it.
Here is an example of how to fix the above example using IsNull:
If IsNull({Product.Color}) Or
InStr({Product.Color}, " ") = 0 Then
"basic"
Else
"fancy"
Relating to operators, when Crystal Reports evaluates the condition:
IsNull({Product.Color}) Or
InStr({Product.Color}, " ") = 0
It first evaluates IsNull ({Product.Color)), and when it determines that this is True, it knows that the
whole condition is True, and does not need to check whether
InStr({Product.Color}, " ") = 0
In other words, Crystal Reports will stop evaluating a Boolean expression when it can predict the results
of the whole expression. In the following example, the formula guards against attempting to divide by
zero in the case that denom is 0:
Local NumberVar num;
Local NumberVar denom;
...
If denom <> 0 And num / denom > 5 Then
...
13.8.13 Control structures (Crystal syntax)
Formulas without control structures execute each expression in the formula exactly once when the
formula is evaluated. The expressions are executed in a sequential fashion, from the first expression
in the formula to the last. Control structures enable you to vary this rigid sequence. Depending upon
which control structure you choose, you can skip over some of the expressions or repeatedly evaluate
some expressions depending on if certain conditions hold. Control structures are the primary means
of expressing business logic and typical report formulas make extensive use of them.
13.8.13.1 If expressions (Crystal syntax)
2011-05-06282
Formulas

The If expression is one of the most useful control structures. It allows you to evaluate an expression
if a condition is true and evaluate a different expression otherwise.
Note:
The correct Crystal syntax for If statements is if <condition> then <then> else <else>,
where <condition>, <then>, and <else> are all single expressions. If you have multiple expressions
after the <then> or <else>, convert them into single expressions by surrounding them in parentheses.
For example:
Global stringVar lastValue;
if {Branch_View.Branch_ID} = lastValue
then
(lastValue := {Branch_View.Branch_ID};
crRed;)
else
(lastValue := {Branch_View.Branch_ID};
crBlack;)
Note:
• When formatting with conditional formulas, always include the Else keyword; otherwise, values that
don't meet the If condition may not retain their original format. To prevent this, use the DefaultAttribute
function (If...Else DefaultAttribute).
• When creating record selection formulas that include If expressions, always include the Else keyword;
otherwise, no records or unexpected records may be returned. For example, a record selection such
as If {parameter} = "less than 100" then {object} < 100" evaluates as False and
returns no records. To correct this problem, complete the formula with Else True.
Example
A company plans to pay a bonus of 4 percent to its employees except for those who work in Sales who
will receive 6 percent. The following formula using an If expression would accomplish this:
//If example 1
If {Employee.Dept} = "Sales" Then
{Employee.Salary} * 0.06
Else
{Employee.Salary} * 0.04
In this example, if the condition {Employee.Dept} = "Sales" evaluates as true, then the
{Employee.Salary} * 0.06
expression is processed. Otherwise the expression following the Else, namely the
{Employee.Salary} * 0.04
is processed.
Suppose another company wants to give employees a 4% bonus, but with a minimum bonus of $1,000.
The following example shows how. Notice that the Else clause is not included; it is optional, and not
needed in this case.
//If example 2
Local CurrencyVar bonus := {Employee.Salary} * 0.04;
If bonus < 1000 Then
bonus := 1000;
//The final expression is just the variable 'bonus'.
//This returns the value of the variable and is the
//result of the formula
bonus
2011-05-06283
Formulas

Another way of accomplishing example 2 is to use an Else clause:
//If example 3
Local CurrencyVar bonus := {Employee.Salary} * 0.04;
If bonus < 1000 Then
1000
Else
bonus
Now suppose that the previous company also wants a maximum bonus of $5,000. You now need to
use an Else If clause. The following example has only one Else If clause, but you can add as many as
you need. Note, however, that there is a maximum of one Else clause per If expression. The Else clause
is executed if none of the If or Else If conditions are true.
//If example 4
Local CurrencyVar bonus := {Employee.Salary} * 0.04;
If bonus < 1000 Then
1000
Else If bonus > 5000 Then
5000
Else
bonus
13.8.13.1.1 If example (Crystal syntax)
Suppose that a company wants to compute an estimate of the amount of tax an employee needs to
pay and write a suitable message. Income below $8,000 is not taxed, income from $8,000 to $20,000
is taxed at 20% income from $20,000 to $35,000 is taxed at 29% and income above $35,000 is taxed
at 40%.
//If example 5
Local CurrencyVar tax := 0;
Local CurrencyVar income := {Employee.Salary};
Local StringVar message := "";
If income < 8000 Then
(
message := "no";
tax := 0
)
Else If income >= 8000 And income < 20000 Then
(
message := "lowest";
tax := (income - 8000)*0.20
)
Else If income >= 20000 And income < 35000 Then
(
message := "middle";
tax := (20000 - 8000)*0.20 + (income - 20000)*0.29
)
Else
(
message := "highest";
tax := (20000 - 8000)*0.20 + (35000 - 20000)*0.29 +
(income - 35000)*0.40
);
//Use 2 decimal places and the comma as a
//thousands separator
Local StringVar taxStr := CStr (tax, 2, ",");
"You are in the " & message & " tax bracket. " &
"Your estimated tax is " & taxStr & "."
Note:
The use of variables is to simplify the logic of the computation. Also, there are two expressions that are
executed when one of the conditions are met; one assigns the tax variable, and the other assigns the
message variable. It is often useful to have multiple expressions executed as a result of a condition.
2011-05-06284
Formulas
13.8.13.1.2 More details on If expressions (Crystal syntax)
The If expression is an expression. In other words it evaluates to a value of a given type. If there is
no Else clause, and the condition is not true, then the value is the default value for the type. For example:
If Length ({Employee.First Name}) < 5 Then
"short"
The above If expression returns a String value. The string value is "short" if the Employee's first name
has fewer than 5 letters and the empty String "" otherwise.
Consider the formula:
If Year({Orders.Order Date}) >= 1995 Then
{Orders.Order Date}
For order dates before 1995, the above If expression returns the null DateTime value. It is a DateTime
value rather than a Date value since {Orders.Order Date} is a DateTime result object. The null DateTime
value is not printed by Crystal Reports so if the above formula is placed in a report, the formula would
be blank for order dates before 1995. Null Time values and null Date values behave similarly.
Here is an example that illustrates the use of parentheses to have more than one expression executed
as the outcome of an If condition. A company charges a 5 percent fee for orders shipped within three
days and a 2 percent fee otherwise. It wants to print messages such as "Rush shipping is $100.00" or
"Regular shipping is $20.00" as appropriate.
Local StringVar message;
Local CurrencyVar ship;
If {Orders.Ship Date} - {Orders.Order Date} <= 3 Then
(
message := "Rush";
//A semicolon at the end of the next line
//is optional
ship := {Orders.Order Amount} * 0.05
) //A semicolon cannot be placed here
Else
(
message := "Regular";
ship := {Orders.Order Amount} * 0.02;
);
//The preceding semicolon is required to separate the
//If expression from the final expression below
message & " shipping is " & CStr (ship)
When expressions are grouped together with parentheses, the whole group is considered as a single
expression, and its value and type are the value and type of the final expression inside the parentheses.
//The parentheses group expression as a whole has
//Currency type
(
//The first expression in the parentheses has
//String type
message := "Rush";
//The second and final expression in parentheses
//has Currency type
ship := {Orders.Order Amount} * 0.05;
)
Thus, for example, the following formula gives an error. The reason is that the Then part of the If
expression returns a Currency value while the Else part returns a String value. This is not allowed,
since the If expression is an expression and so must always return a value of a single type.
//An erroneous formula
Local StringVar message;
Local CurrencyVar ship;
2011-05-06285
Formulas
If {Orders.Ship Date} - {Orders.Order Date} <= 3 Then
(
message := "Rush";
ship := {Orders.Order Amount} * 0.05
)
Else
(
//The following 2 lines were interchanged
ship := {Orders.Order Amount} * 0.02;
message := "Regular";
);
message & " shipping is " & CStr (ship)
One way of fixing up the erroneous formula without being careful about expression order is just to make
the If expression return a constant value of the same type in every branch. For example, the If expression
now returns the Number value 0:
//Repaired the erroneous formula
Local StringVar message;
Local CurrencyVar ship;
If {Orders.Ship Date} - {Orders.Order Date} <= 3 Then
(
message := "Rush";
ship := {Orders.Order Amount} * 0.05;
0
)
Else
(
ship := {Orders.Order Amount} * 0.02;
message := "Regular";
0
);
message & " shipping is " & CStr (ship)
13.8.13.2 Select expressions (Crystal syntax)
The Select expression is similar to an If expression. Sometimes however, you can write clearer and
less repetitive formulas using the Select expression. For example, to evaluate the {Customer.Fax}
object to determine if the area code is for Washington state (206, 360, 509) or British Columbia, Canada
(604, 250):
//Select example 1
Select {Customer.Fax}[1 To 3]
Case "604", "250" :
"BC"
Case "206", "509", "360" :
"WA"
Default :
"";
The expression right after the Select keyword is called the Select condition. In the above example it is
{Customer.Fax}[1 To 3]. The Select expression tries to find the first Case that matches the Select
condition, and then executes the expression following the colon for that Case. The Default case is
matched if none of the preceding cases match the Select condition. Notice that there is also a colon
after the Default.
//Same effect as Select example 1
Local StringVar areaCode := {Customer.Fax}[1 To 3];
If areaCode In ["604", "250"] Then
"BC"
Else If areaCode In ["206", "509", "360"] Then
"WA"
2011-05-06286
Formulas

Else
"";
Example
This formula groups the number of Oscar nominations a movie received into low, medium, high or
extreme categories and in the process, shows some of the possibilities for the expression lists following
the Case labels:
//Select example 2
Select {movie.NOM}
Case 1,2,3, Is < 1 :
(
//Can have expression lists by using
//parentheses
10 + 20;
"low"
)
Case 4 To 6, 7, 8, 9 :
"medium"
Case 10 :
"high"
Default :
"extreme"
The Default clause of the Select expression is optional. If the Default clause is missing and none of the
cases are matched, then the Select expression returns the default value for its expression type. For
example, if in the above example the Default clause were omitted and {movie.NOM} = 11, it would
return the empty string "". The Select expression is an expression, and similar comments as in the More
details on If expressions (Crystal syntax) section apply to it as well.
13.8.13.3 For loops (Crystal syntax)
For loops enable you to evaluate a sequence of expressions multiple numbers of times. This is unlike
the If and Select expressions where the program passes through each expression at most once during
the formula's evaluation. For loops are best when you know the number of times that the expressions
needs to be evaluated in advance.
13.8.13.3.1 The syntax of the For loop through examples
Example 1
Suppose you want to reverse the {Customer.CUSTOMER_NAME} string. For example, "City Cyclists"
becomes "stsilcyC ytiC".
//Reverse a string version 1
Local StringVar str := "";
Local NumberVar strLen :=
Length ({Customer.CUSTOMER_NAME});
Local NumberVar i;
For i := 1 To strLen Do
(
Local NumberVar charPos := strLen - i + 1;
str := str + {Customer.CUSTOMER_NAME}[charPos]
);
str
2011-05-06287
Formulas

Examine how this formula works assuming that the current value of the object
{Customer.CUSTOMER_NAME} is "Clean Air". The variable strLen is assigned to be the length of
"Clean Air", namely 9. The variable i is known as a For counter variable since its value changes
with each iteration of the For loop. In other words, it is used to count the iterations of the loop. The For
loop will iterate 9 times, during the first time, i is 1, then i is 2, then i is 3 and so on until finally i equals
9. During the first iteration, the ninth character of {Customer.CUSTOMER_NAME} is appended to the
empty string variable str. Thus str equals "r" after the first iteration. During the second iteration, the
eighth character of {Customer.CUSTOMER_NAME} is appended to str and so str equals "ri". This
continues until after the ninth iteration, str equals, "riA naelC" which is the reversed string.
Example 2
Here is a simpler version of the above formula that uses a Step clause with a negative Step value of
-1. For the "Clean Air" example, i is 9 for the first iteration, 8 for the second, 7 for the third and so on
until it is 1 in the final iteration.
//Reverse a string version 2
Local StringVar str := "";
Local NumberVar strLen :=
Length ({Customer.CUSTOMER_NAME});
Local NumberVar i;
For i := strLen To 1 Step -1 Do
(
str := str + {Customer.CUSTOMER_NAME}[i]
);
str
Example 3
The simplest version is to use the built in function StrReverse:
//Reverse a string version 3
StrReverse ({Customer.CUSTOMER_NAME})
The built in String functions in Crystal Reports can handle many of the string processing applications
that would traditionally be handled using a For loop or some other kind of loop. However, For loops
provide the most flexibility in processing strings and also power in processing arrays, which can be
essential if the built-in functions do not cover your intended application.
13.8.13.3.2 For loop example
Here is a more full featured example of Crystal Reports' string processing capabilities. The Caesar
cipher is a simple code that is traditionally credited to Julius Caesar. In this code, each letter of a word
is replaced by a letter five characters further in the alphabet. For example, "Jaws" becomes "Ofbx".
Notice that "w" is replaced by "b"; since there are not 5 characters after "w" in the alphabet, it starts
again from the beginning. Here is a formula that implements applying the Caesar cipher to the object
{Customer.CUSTOMER_NAME} in the Xtreme database:
//The Caesar cipher
//The input string to encrypt
Local StringVar inString := {Customer.CUSTOMER_NAME};
Local NumberVar shift := 5;
Local StringVar outString := "";
Local NumberVar i;
For i := 1 To Length(inString) Do
(
Local StringVar inC := inString [i];
Local StringVar outC;
Local BooleanVar isChar :=
LowerCase(inC) In "a" To "z";
Local BooleanVar isUCaseChar :=
2011-05-06288
Formulas

isChar And (UpperCase (inC) = inC);
inC := LCase(inC);
If isChar Then
(
Local NumberVar offset :=
(Asc(inC) + shift - Asc("a")) Mod
(Asc("z") - Asc("a") + 1);
outC := Chr(offset + Asc("a"));
If isUCaseChar Then outC := UpperCase(outC)
)
Else
outC := inC;
outString := outString + outC
);
outString
In the above example there is an If expression nested within the expression block of the For loop. This
If expression is responsible for the precise details of shifting a single character. For example, letters
are treated differently from punctuation and spaces. In particular, punctuation and spaces are not
encoded. The general points here are that control structures can be nested within other control structures
and that multiple expressions can be included in the (parentheses enclosed) expression blocks of other
control structures.
13.8.13.3.3 Using Exit For (Crystal syntax)
You can exit from a For loop by using Exit For. The following example searches the Global array names
for the name "Fred". If it finds the name, it returns the index of the name in the array. Otherwise it returns
-1.
For example, if the names array is:
["Frank", "Helen", "Fred", "Linda"]
Then the formula returns 3.
Global StringVar Array names;
//The names array has been initialized and filled
//in other formulas
Local NumberVar i;
Local NumberVar result := -1;
//The UBound function returns the size of its array
//argument
For i := 1 to UBound (names) Do
(
If names [i] = "Fred" Then
(
result := i;
Exit For
)
);
result
When considered as an expression, the For loop always returns the Boolean value True. Thus you will
almost never want a For loop to be the last expression in a formula, since then the formula will then
just display the value True rather than your intended result.
13.8.13.4 While Loops (Crystal syntax)
2011-05-06289
Formulas
Another looping mechanism is the While loop. A While loop can be used to execute a fixed block of
statement an indefinite amount of time.
13.8.13.4.1 The 2 different types of While loops
ExampleExplanationType of While Loop
While
condition
Do
expression
The While ... Do loop evaluates
the condition, and if the condi-
tion is true, then it evaluates the
expression following the Do.
When it has finished doing this,
it evaluates the condition again
and if the condition is true, it
evaluates the expression follow-
ing the Do again. It continues
repeating this process until the
condition is false.
While ... Do
Do
expression
While
condition
The Do ... While loop evaluates
the expression once no matter
what.
It then evaluates the condition,
and if the condition is true,
evaluates the expression again.
This process continues until the
condition is false.
Do ... While
Note:
• The While loops support an Exit While statement to immediately jump out of the loop. Its use is
analogous to the use of Exit For in For loops.
• As with the For loop, the While loop when considered as an expression always returns the Boolean
value True.
13.8.13.4.2 While ... Do loop example (Crystal syntax)
The following example searches for the first occurrence of a digit in an input string. If a digit is found,
it returns its position, otherwise it returns -1. In this case, the input string is set explicitly to a string
constant, but it could be set equal to a String type result object instead. For example, for the input String,
"The 7 Dwarves", the formula returns 5, which is the position of the digit 7.
Local StringVar inString := "The 7 Dwarves";
Local NumberVar strLen := Length (inString);
Local NumberVar result := -1;
Local NumberVar i := 1;
2011-05-06290
Formulas
While i <= strLen And result = -1 Do
(
Local StringVar c := inString [i];
If NumericText (c) Then
result := i;
i := i + 1;
);
result
13.8.13.5 Safety mechanism for loops (Crystal syntax)
There is a safety mechanism to prevent report processing from hanging due to an infinite loop. Any
one evaluation of a formula can have at most 100,000 loop condition evaluations per formula evaluation.
This will be explained by the example below.
For example:
Local NumberVar i := 1;
While i <= 200000 Do
(
If i > {movie.STARS} Then
Exit While;
i := i + 1
);
20
If {movie.STARS} is greater than 100,000 then the loop condition (i <= 200000) will be evaluated more
than the maximum number of times and an error message is displayed. Otherwise the loop is OK.
Note:
The safety mechanism applies on a per formula base, not for each individual loop. For example:
Local NumberVar i := 1;
For i := 1 To 40000 Do
(
Sin (i);
);
i := 1;
While i <= 70000 Do
(
i := i + 1;
)
The above formula also triggers the safety mechanism since the 100,000 refers to the total number of
loop condition evaluations in the formula and this formula will have 40001 + 70001 such evaluations.
13.8.13.6 Option Loop (Crystal Syntax)
The Option Loop statement can be used to specify the maximum number of loop condition evaluations
per evaluation of a formula. This statement should only be used when the default maximum loop count
of 100,000 is not sufficient for the given formula.
2011-05-06291
Formulas

Note:
The Option Loop statement must be used before any other statements.
13.8.13.6.1 The syntax of the Option Loop
The syntax of the Option Loop is:
Option Loop maxIterations
Where maxIterations = the maximum number of times you want the condition to be evaluated per
evaluation of a formula. It must be a positive integer.
For example:
//option loop example
option loop 256;
//make name upper case
Local StringVar outString;
Local StringVar inString := {Customer.CUSTOMER_NAME};
Local NumberVar i;
For i:=1 to Length(inString) do
outString := outString + upperCase(inString[i]);
outString
If Customer.CUSTOMER_NAME is greater than 255, an error message will be shown: "A loop was
evaluated more than the maximum number of times allowed."
13.8.14 Limitations (Crystal syntax)
For reference purposes, here are the sizing limitations of the formula language:
• The maximum length of a String constant, a String value held by a String variable, a String value
returned by a function or a String element of a String array is 65,534 characters.
• The maximum size of an array is 1000 elements.
• The maximum number of arguments to a function is 1000. (This applies to functions that can have
an indefinite number of arguments such as Choose).
• The maximum number of loop condition evaluations per evaluation of a formula is 100,000. (See
Safety mechanism for loops (Crystal syntax) for the precise meaning of this). Note that you can use
the Option Loop (Crystal Syntax) statement to change this limit.
• There is no limit on the size of a function.
2011-05-06292
Formulas

Subreports
A subreport is a report within a report. With subreports, unrelated reports can be combined into a single
report. You can coordinate data that otherwise cannot be linked and present different views of the same
data in a single report. This section shows you how to create and use subreports.
14.1 What are subreports?
A subreport is a report within a report. The process for creating a subreport is similar to the process of
creating a regular report. A subreport can have most of the characteristics of a main report. The only
differences between a subreport and a main report are as follows:
• It is inserted as an element into a main report; it cannot stand on its own.
• It can be placed in any report section, and the entire subreport will print in that section.
• It cannot contain another subreport.
• It does not have Page Header or Page Footer sections.
Subreport is typically used for the following purposes:
• To combine unrelated reports into a single report.
• To present different views of the same data within a single report.
Note:
You can increase the performance of reports containing subreports by using on-demand subreports
instead of regular, in-place subreports.
Related Topics
• Combining unrelated reports by using subreports
• Showing different views of the same data in a report
• Creating an on-demand subreport
14.2 Unlinked vs. linked subreports
2011-05-06293
Subreports

14.2.1 Unlinked
Unlinked subreports are free-standing; their data is not in any way coordinated with the data of the main
report.
In unlinked subreports, there is no attempt to match up the records in one report with records in the
other. An unlinked subreport does not have to use the same data as the main report; it can use the
same data source or a different data source entirely. Regardless of the underlying data sources, the
reports are treated as unrelated.
14.2.2 Linked
Linked subreports use data that is coordinated with data in the main report. The program matches up
the data in the subreport with data in the main report. If you create a main report with customer
information and a subreport with order information and link them, the program creates a subreport for
each customer and includes in that subreport all the orders for that customer.
Subreports can be linked with data-passing links or with subreport filters.
14.2.2.1 Subreport filters
Use subreport filters to modify the subreport query so that the data in the subreport is co-ordinated with
the data in the main report.
When you first create a subreport, subreport filters are automatically suggested. The suggested filters
will vary depending on where you insert your subreport. For example:
• If you place the subreport in the "Group Header" or the "Group Footer", links will be created between
all objects in the group, if a possible match can be made.
• If you place the subreport in the "Body", links will be made between all objects in the subreport.
• If you place the subreport in the "Report Header", "Report Footer", "Page Header", or "Page Footer",
no automatic matching will occur.
Even though subreport filters may be suggested, you can modify them, remove them, and add additional
filters.
2011-05-06294
Subreports

14.2.2.2 Data passing links
Data passing links connect result objects, formulas, or parameters in the main report to a parameter in
the subreport. The subreport parameter is set to the value of the specified element at runtime.
Unlike subreport filters, data passing links do not modify the subreport query.
Note:
When you initially set up a report, the data passing links page appears only if you specify parameters
in the "Query Panel" or if you use an existing report with parameters as your subreport. However, after
you have created a subreport, you can add data passing links from the "Data" tab.
14.3 Inserting subreports
You can insert a new report as a subreport, or you can insert an existing report as a subreport.
The process for creating a subreport is similar to the process of creating a regular report. A subreport
can have most of the characteristics of a report.
The data source used in a subreport must be of the same type as the data source used in the main
report. It must also be located on the same BI platform server.
A subreport can be placed in any report section and the entire subreport will print in that section.
However, a subreport cannot stand on its on; it is always inserted as an element into a main report.
Note:
You cannot insert a subreport into another subreport.
14.3.1 To insert a new report as a subreport
1.
On the "Insert" tab, click Subreport.
The program displays an element frame.
2.
Move the frame to where you want it to appear in the report, and click to place it.
The "Insert Subreport" dialog box appears.
3.
Select Create a new report.
4.
Type a name for the report in the "Report Name" text box.
2011-05-06295
Subreports
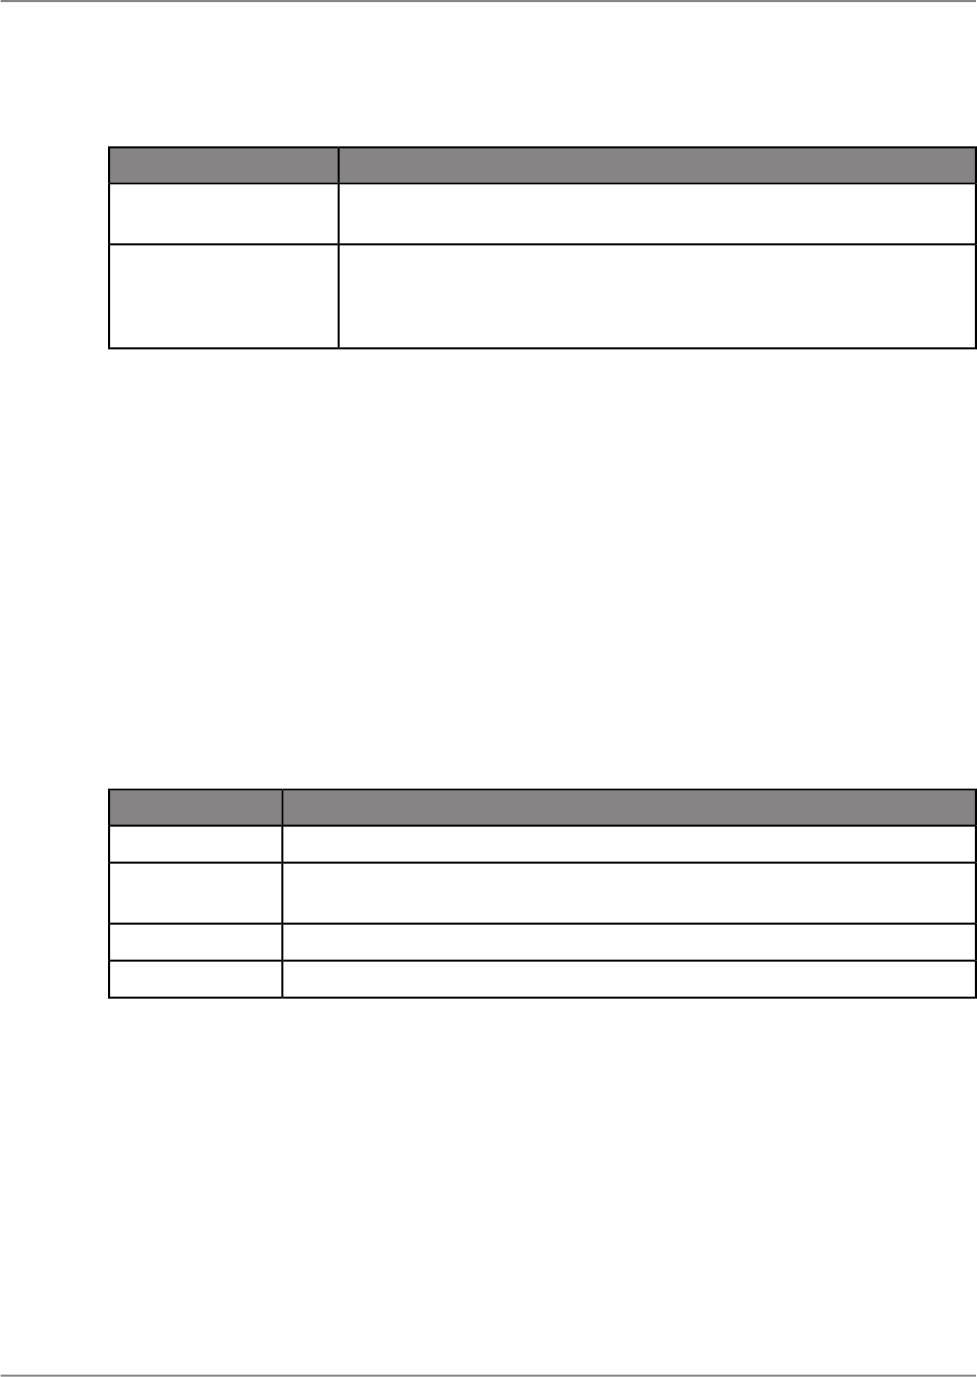
5.
Choose an option from the "Data Connection" area, and click Next:
DescriptionOption
a.
The "Edit Query" page appears.
Use Main Report Data
Source
a.
The Browse server panel appears.
b.
Select a data source, and then click Next.
c.
The "Edit Query" page appears.
Connect to a new Data
Source
6.
In the "Query Panel", select the result objects you want to use for your report and drag them to the
"Result Objects for Query #1" panel.
Note:
The "Query Panel" will not appear if you connect to Analysis View.
7.
Click Next.
If there are parameters in the query you specified, the Data Passing Links page appears.
• Set up the appropriate links, and click Next.
The "Create Subreport Filters" page appears.
8.
Create links between your main report and your subreport by clicking Add.
9.
Click Next.
The "Insert Subreport" page appears.
10.
Select a layout for your subreport:
DescriptionOption
All of the sections except the "Body" are hidden.
Detail Only
All of the sections except the "Report Header" are hidden, and a default chart
is created.
Chart
All of the sections except the "Report Header" are hidden.
Total
None of the sections are hidden.
Custom
11.
Click Finish.
A subreport is inserted in your main report.
14.3.2 To insert an existing report as a subreport
1.
On the "Insert" tab, click Subreport.
The program displays an element frame.
2011-05-06296
Subreports

2.
Move the frame to where you want it to appear in the report, and click to place it.
The "Insert Subreport" wizard appears.
3.
Select Use existing report, and then click Browse.
The "Open" dialog box appears.
4.
Select the report that you would like to use, and then click Open.
5.
Click Next.
If the report you selected contains parameters, the Data Passing Links page appears.
• Set up the appropriate links, and click Next.
The "Create Subreport Filters" page appears.
6.
Create links between your main report and your subreport by clicking Add.
7.
Click Finish.
The report that you selected is added as a subreport.
14.4 Saving a subreport as a main report
You may want to save a subreport as a main report to distribute it to a variety of audiences. For example,
the main report containing the subreport may be relevant for a stockholders' meeting at the end of the
fiscal year; however, the data contained in the subreport may be relevant for everyday use by your
managers. In such cases, it is easy to save a subreport as a main report.
14.4.1 To save a subreport as a main report
1.
Right-click the subreport frame, and click Save Supbreport As.
The "Save As" dialog box appears.
2.
Type a new name for the subreport.
3.
Click Save.
The subreport is saved as a main report so that you can open it separately when necessary.
14.5 Re-importing subreports
2011-05-06297
Subreports

While you can update the data in a subreport without re-importing it, you may want to re-import to ensure
the subreport is the most up-to-date version. Re-importing will update the formatting, grouping, and
structure of the subreport.
Note:
Re-importing is available only for subreports that were created from a report file.
Caution:
If you have made formatting changes to the subreport from the main report (using the Format Subreport
dialog box), re-importing the subreport will overwrite those changes. To avoid this, before re-importing
the subreport, do the following: Click File > Open to open the report that is being used as the subreport,
make the formatting changes to that report, and click Save."
14.5.1 To re-import subreports
• Right-click the subreport frame, and then click Re-import Subreport.
14.6 Formatting subreports
You can edit the properties of a subreport after you have inserted it into your main report.
14.6.1 To format subreports
1.
Right-click the subreport frame and click Format Subreport.
The Format dialog box appears.
2.
Edit the values.
For example, you can change the name of the subreport, edit the font, and so on.
3.
Click Close.
Note:
Re-importing the subreport will overwrite changes made using the Format Subreport dialog box. To
avoid this, before re-importing the subreport, do the following: Click File > Open to open the report that
is being used as the subreport, make the formatting changes to that report, and click Save.
2011-05-06298
Subreports

14.7 Linking a subreport to the main report with subreport filters
The data in subreports is often used to supplement the data in the main report. For example, you might
have customer data in a main report, and use subreports to show the orders for each customer.
In such cases, you will need to coordinate the data in the main report with the data in the subreport so
that the orders in each subreport match up with the correct customer.
You do this by creating a link between an object that is common to both the subreport and the main
report. With the "Subreport Filters" dialog box, you create a link between the two common objects (for
example Customer and Orders). Crystal Reports uses the link to match up records from the main report
to those in the subreport. The link makes certain that the Orders data in the subreport sits on the same
row as the corresponding Customer data in the main report.
14.7.1 To link a subreport to the main report with subreport filters
1.
Double-click the subreport frame to open a new view of the subreport.
2.
On the "Data" tab, click Subreport > Edit Subreport Filters.
The "Subreport Filters" dialog box appears.
3.
Click Add.
A list of result objects appears.
4.
Select the object you want to use as a link object in the main report.
Crystal Reports tries to match the object you chose to an object in the subreport.
5.
To change the subreport object that the program chose, click that object in the "Subreport" list, and
choose a different object.
The two objects are added as a link object.
6.
Repeat steps 3 to 5 for each additional link as desired.
7.
Click OK.
When you run the report, the program will synchronize the data in the main report with the data in the
subreport.
14.8 Linking a subreport to the main report with data passing links
Another way to pass data from the main report to the subreport is to use data passing links.
2011-05-06299
Subreports

Data passing links can link to more types of data than subreport filters because they do not modify the
query of the subreport. Data passing links create a parameter in your subreport that is linked to a result
object, formula, or parameter in the main report.
For example, you may want to use data passing links to display the value of a formula from your main
report in your subreport. For example, if your main report has a formula that calculates the sum of the
internet sales orders, you can link to it with a parameter in your subreport.
14.8.1 To link a subreport to a main report with data passing links
1.
Double-click the subreport frame to go to a new view of the subreport.
2.
On the "Data" tab, click Subreport > Edit Subreport Data Passing Links.
The "Subreport Data Passing Links" dialog box appears.
3.
Click Add.
A list of result objects appears.
4.
Select the object you want to use as a link object in the main report from the list.
Crystal Reports matches the object you chose with a parameter it creates in the subreport.
5.
To change the subreport parameter that the program created, click that parameter in the "Subreport
Parameters" list and choose a different parameter.
The object and the parameter are added as a link object.
6.
Repeat steps 3 to 5 for each additional link, as desired.
7.
Click OK.
The "Change Current Data Set" dialog box appears.
8.
Follow the parameter prompt, and click OK.
When you run the data in the main report, the program will set the value of the parameter in the subreport
to the object you specified.
14.9 Modifying the record selection formula with a data passing link
You can update the record selection formula of a data passing link at any time.
For example, you might have a report with an Employee ID object in your main report that is an 11
character value consisting of a two-character department code and the employee's nine-character
Social Security Number (for example, HR555347487). You can link the Employee ID object to a Social
Security Number object in your subreport, and then create a formula that will extract the SSN from the
Employee ID object.
2011-05-06300
Subreports

An example formula would be:
{employee.EMPLOYEE ID} [-9 to -1]
- or -
{employee.EMPLOYEE ID} [3 to 12]
For the value HR555347487, either formula would return the value 555347487.
14.9.1 To modify the record selection formula with a data passing link
1.
Create the main report that contains the Employee ID object.
2.
Create a subreport that contains the Social Security number object.
Note:
Do not create any subreport filter links when you are creating the subreport.
For more information, see To insert a new report as a subreport.
3.
Double-click the subreport frame to go to a new view of the subreport.
4.
On the "Data" tab, click Subreport > Edit Subreport Data Passing Links.
The "Subreport Data Passing Links" dialog box appears.
5.
Click Add.
A list of result objects appears.
6.
Select Employee ID from the list of result objects.
Note:
The program automatically creates the parameter Create parameter: Employee ID in the "Subreport
Parameters" column.
7.
Click OK.
The "Change Current Data Set" dialog box appears.
8.
Follow the parameter prompt, and click OK.
9.
On the "Data" tab, select Formulas.
The "Formula Workshop" appears.
10.
Select the Record Filter node.
11.
Type the formula.
For example, {file.SSN} = {?MainReport.EMPLOYEE ID} [3 to 12].
12.
Click Save and Close.
"The Record Filter has been changed" dialog box appears.
13.
Click Refresh Data.
2011-05-06301
Subreports

14.10 Combining unrelated reports by using subreports
At times, you may wish to combine unrelated reports into a single report. For example, you may want
to create a single report that presents:
• Sales grouped by sales representative.
• Sales grouped by item.
While both reports deal with sales data, there is no real linear relationship between the reports.
Subreports can be used to combine unrelated reports into a single report like this. While the reports
could be based on the same data set, they do not have to be. They could each be based on entirely
different data sets.
Each of these reports is free-standing; the data in any of the reports is not linked in any way to data in
another report. This is the easiest of the subreport options to work with.
14.10.1 To combine two unrelated reports
1.
Create the report you want printed first as the main report.
2.
Create a new subreport.
3.
Place the subreport into the "Report Footer" and it will print immediately after the main report.
14.10.2 To combine three or more unrelated reports
1.
Create the report you want printed first as the main report.
2.
On the "Insert" tab, click Section and insert enough new sections in the "Report Footer" to match
the number of subreports that you are using.
For example, if you want to use three subreports, insert two new sections in the "Report Footer" so
that you have a total of three "Report Footer" sections.
3.
On the "Insert" tab, click Subreport.
4.
In the "Report Footer" A section, create the subreport you want printed immediately after the main
report.
5.
In the "Report Footer" B section, create the subreport you want printed next, and so forth.
The main report will print first and then the subreports will print in the order that you placed them in
the report.
2011-05-06302
Subreports

Note:
Subreports can be placed side-by-side in the same "Report Footer" section. They will print next to
each other at the end of the report.
Related Topics
• Working with sections
14.11 Creating an on-demand subreport
On-demand subreports can be especially useful when you want to create a report that contains multiple
subreports.
The difference between regular subreports and on-demand subreports is that the actual data of an
on-demand subreport is not read from the data source until the user isolates it. This way only data for
on-demand subreports that are actually viewed will be retrieved from the data source. This makes the
subreports much more manageable.
14.11.1 To create an on-demand subreport
1.
Place an ordinary subreport in your main report.
2.
Right-click the subreport, and click Format Subreport.
3.
Click the Subreport option, and select On Demand.
For more information, see Adding captions to on-demand subreports.
14.11.2 Adding captions to on-demand subreports
To further organize a report, you can create captions for the Subreport "Page" mode and for the
placeholder frame of an on-demand subreport.
Note:
Placeholder frame captions only apply to on-demand subreports, while tab text captions apply to both
on-demand subreports and regular subreports. Since the data from a regular subreport is visible in
"Page" mode, there is no need for a frame caption when you format a regular subreport.
2011-05-06303
Subreports
14.11.2.1 To add a caption
1.
Right-click the subreport, and click Format Subreport.
2.
Click the Subreport option.
3.
In the "On Demand Caption" text box, type the text you want to use as a caption.
You can also write a caption as a conditional formula. Both placeholder frame captions and "Page"
mode captions can include object names from the main report for use in a conditional formula.
14.11.2.2 To add a caption with a conditional formula
1.
Right-click the subreport, and click Format Subreport.
2.
Click the Subreport option.
3.
Beside either "On Demand Caption" or "Preview Tab Caption", click the Conditional Formula
icon.
The "Formula Workshop" dialog box appears.
4.
In the code window, type your formula and select objects from the "Add Objects" list..
For example, you might type the following text:
"More Information About " + {Customer.CUSTOMER_NAME}
Depending on the data source you are connected to, this formula would give you a caption like "More
Information About Pathfinders" or "More Information About Rockshocks for Jocks."
5.
Click Page mode to see the result of your formula.
Related Topics
• Creating a formula
14.12 Showing different views of the same data in a report
Subreports can be used to provide a different view of the data in the main report. For example, you
might want to show summary values at the top of a report and details at the bottom.
This can be done in a variety of ways. The two easiest methods are:
2011-05-06304
Subreports

• By creating the summary report as the main report and the details report as the subreport. In this
method, the details subreport would be placed in the "Report Footer" area.
• By creating the details report as the main report and the summary report as the subreport. In this
method, the summary report would be placed in the "Report Header" area.
Use the appropriate link objects to link the report and coordinate the data.
2011-05-06305
Subreports

2011-05-06306
Subreports

Multilingual Reporting
Multilingual reporting allows you to translate your reports in a variety of languages and display them in
the correct language based on the user's Preferred Viewing Locale (PVL). The PVL can be set in the
SAP Crystal Reports for Enterprise designer or in the BI platform user preferences.
Users will rarely have to set their own PVL because BI platform uses its web browser's locale setting
by default. If the user's PVL does not match any available translations, BI platform uses the Fallback
Locale to determine which language to display. For example, if you set English as the Fallback Locale
for a report with English and German translations, users with a French PVL will see the report in English.
You can set a fallback at the report and data levels of the system.
Multilingual reporting is available for all SAP Crystal Reports for Enterprise users, while a limited version
is available for SAP Crystal Reports 2011 users on SAP systems.
Note:
See the
SAP Crystal Reports 2011 User Guide
for more details.
Related Topics
• To configure viewing preferences
15.1 Levels of multilingual reporting
Crystal Reports for Enterprise supports multilingual reporting at three levels:
• Multilingual Reports: The translated report template (including such elements as column headings,
text, and information surrounding the data of the report) using the Translation Management Tool.
Note:
The Translation Management Tool is included in the BOE Client install.
• Multilingual Metadata: The translated names of query objects.
Note:
In BOE XI 4.0, Multilingual Metadata is supported by the Crystal Reports for Enterprise designer
when connected to SAP systems only.
• Multilingual Data: The translated data retrieved from a query depending on the PVL. For example,
address listings with translated country names.
2011-05-06307
Multilingual Reporting

Note:
Multilingual Data is only available from multilingual data sources.
15.2 Creating multilingual report templates
You can translate your reports for specific locales in the BOE Translation Management Tool. Translation
management includes the following features:
• Add languages.
• Translate the report template.
• Export data to translate in an external editor.
• Set and monitor the status of the translations.
• Set the visibility for each language.
• Set the fallback locale.
15.2.1 To create a multilingual report template
1.
Select the reports you want to translate and click Add.
The added reports appear in the document area.
2.
Click Finish.
Each report opens as a new tab in the Translation Management Tool.
3.
From the Language Management view, add the required languages to the report.
Note:
The language used for the "Original Content Language" cannot be tagged with a locale. You must
add the original language separately from the "Available Languages" list.
The languages that have been added appear in the "Selected Languages" area of the Language
Management view.
4.
For each selected language, click View to display the language in the document area.
5.
Click Visible to make the translation visible in the report.
Tip:
To prevent users from seeing incomplete translations, make languages visible only after the translation
is complete.
6.
To select a fallback language, click Fallback.
7.
Select a language column and translate the relevant content in the corresponding language column.
The report is organized into the report elements that you would see in "Structure" mode.
2011-05-06308
Multilingual Reporting

8.
On the Text Editor tab, select the translation status in the Status list and click Apply.
Note:
Any change to the translated string will reset the status to TRANSLATED.
9.
Click Save.
10.
(Optional) Click Export translated strings.
You can also export translations into an XLIFF file, which is an open standard that can be modified
in an external editor. Modified XLIFF files are then imported the translation is complete.
15.3 Scheduling multilingual reports
Users can schedule multilingual reports without working on the multilingual aspects of the reports.
Scheduled reports will run in the user's PVL.
Administrators use the Central Management Console to choose alternate multilingual schedule locales
for a report. You can schedule some or all of the languages that your report has been translated into.
Alternate schedules will create separate report runs with the correct PVL, which is particularly important
for multilingual data.
15.3.1 To schedule a multilingual report
You can schedule reports in the Central Management Console.
1.
Find your report folder, right-click it and click Schedule.
The "Schedule" dialog box appears.
2.
In the "Navigation" area, expand Scheduling and click Languages.
3.
In the "Languages" view, select the languages to schedule your report in.
• To use your PVL, click Schedule the report in Preferred Viewing Locale.
• To use more than one locale, click Schedule the report in Multiple Locales.
4.
(Optional) To limit languages available when Schedule the report in Multiple Locales is selected,
select Show Document Locales Only.
5.
In the All Locales list, add the languages to the Selected Instance Locales list.
6.
(Optional) In the "Navigation" area, you can set default language options by expanding "Default
Settings" and clicking Languages.
7.
Click Schedule to confirm your choices.
A report will be run for every locale you choose.
The "History" view appears.
8.
When the "Status" object shows Success, select a language to preview from the View in list.
2011-05-06309
Multilingual Reporting

To display the error message when the "Status" is set to Failed, click on the "Status" object to open
the "Instance Details" dialog box.
15.4 Viewing multilingual reports
Users view multilingual reports in the same way they view traditional reports. Users will see the report
translation based on their PVL settings.
Note:
Administrators can view the multilingual report history to ensure that the reports are displaying correctly.
15.4.1 To configure viewing preferences
The default setting for Product Locale and Preferred Viewing Locale is set to Use browser locale. If
you want to choose another locale, you can set your PVL in the Central Management Console.
1.
Click Preferences.
The "Preferences" dialog box appears.
2.
In the CMC Preferences view, select your preferred Product Locale from the list.
Note:
Only installed Language Packs will display in the Product Locale list.
3.
Select your preferred Preferred Viewing Locale from the list.
The Preferred Viewing Locale list will display all possible locale choices.
4.
Click Save.
Note:
Users must log out and log back in before the updated viewing preferences will apply because report
view instances are cached in the user's browser session.
2011-05-06310
Multilingual Reporting

Creating Accessible Reports
16.1 About accessibility
When you create Crystal reports for a large audience across the organization—and around the
world—you need to account for the diverse needs of that audience. Report designers often create
reports for specific languages, countries, job tasks, or work groups, but it is also important to consider
the accessibility requirements of users.
Report users may have physical, sensory, or cognitive limitations that affect their ability to access the
Web. They may not be able to see, move, or hear. They may have low vision or limited movement.
Some people have dyslexia, color-blindness, or seizure disorders; others have difficulty reading or
understanding text. They may have a combination of disabilities, with varying levels of severity.
People with disabilities often use assistive technologies: products or techniques that help people perform
tasks they cannot perform otherwise. Assistive technologies include adaptive software programs such
as screen readers (which translate text into audible output), screen magnifiers, and speech-recognition
software. People with disabilities may also use special browsers that allow only text or voice-based
navigation. They may use assistive devices such as refreshable Braille displays, or alternative keyboards
that use "sip-and-puff" switches or "eyegaze" technology.
To meet the reporting needs of people with disabilities, your reports should be designed to work with
as many assistive technologies as possible.
Despite the wide range of potential accessibility issues, you can use the techniques described in this
section to create reports that are useful for everyone.
16.1.1 Benefits of accessible reports
As more business and government leaders adopt new standards for delivering web content to people
with disabilities, accessible design is becoming critical to information management and delivery.
Accessible design provides many benefits:
• Accessible reports are easier for everyone to use.
2011-05-06311
Creating Accessible Reports

Many accessibility guidelines result in improved usability. An accessible report must provide logical
and consistent navigation. Its content must be clearly written and easy to understand.
• Accessible reports are more compatible with a variety of technologies, new and old.
Accessible content is easier to export to simple formats that are more compatible with mobile phone
browsers, personal digital assistants (PDAs), and other devices with low-bandwidth connections.
Some people may not have a keyboard or a mouse. They may have a text-only screen, a small
screen, or a slow Internet connection. Accessible design makes it easier for people with limited
technology to access information.
• Accessible content is easier to reuse for other formats.
In the viewers, accessible reports are more accurately copied or exported to other formats.
• Accessible reports improve server efficiency.
You may reduce the number of HTTP requests on the server, by providing clear navigation so people
can find. what they need faster. Providing text-only alternatives can reduce the number of graphics,
which take up valuable bandwidth.
• Recent initiatives indicate a worldwide trend towards providing accessible web content.
More companies are making accessibility a requirement for their web content. Accessibility is quickly
becoming an essential part of web content delivery.
• You may be legally required to provide accessible content.
Each year, more countries introduce anti-discrimination laws that ensure equal opportunities for
people with disabilities. Even if you are not legally required to meet accessibility guidelines, you may
want to do business with an organization that is required to adhere to them.
• Creating accessible reports is easier than modifying existing reports to make them accessible.
If you build accessible features into your reports now, it will be significantly less expensive than to
redesign existing reports later.
16.2 Improving report accessibility
To begin improving the accessibility of your Crystal reports, start with accessibility guidelines that are
quick and easy to implement. A small change in your design conventions or company template may
have a significant impact on accessibility.
Simple navigation and clearly-written content are critical for accessibility, but they are easy to implement
and useful for all report users.
The following sections provide tips and guidelines on how to design reports with accessibility in mind.
Click the appropriate link to jump to that section:
• Placing elements in reports
2011-05-06312
Creating Accessible Reports

• Text
• Color
• Navigation
• Parameters
16.2.1 Placing elements in reports
There are a few general guidelines to keep in mind when you place elements on a report.
When you place elements on reports, make sure their placement is clear and logical, especially when
you need to imply a relationship between two elements in a report. For example, if you include a text
description of a chart, ensure that it is close enough to the chart to make the connection clear.
Many assistive technologies read from left to right and from top to bottom; therefore, if you include a
text description and title for a chart, you should decide which one you want the user to read first. This
will ensure that the elements in a report are read in the correct order.
16.2.1.1 Placing elements in order
When you publish a report to SAP BusinessObjects Business Intelligence platform, the HTML version
organizes the elements in the report according to the consecutive order that you added them in Crystal
Reports, not according to where they were positioned on the report. The report appears the same on
the screen, but the underlying HTML code lists the reports elements in the order they were inserted.
Instead of reading the report from left to right and top to bottom, screen readers and other assistive
devices may follow the order specified in the HTML. To make a report accessible, you must add elements
to reports in the order that you want a screen reader to read them.
For example, you place Quarter, Year, and Invoice objects in the "Body" section and then add the report
title “Invoices by Quarter” to the "Report Header". When you publish the report to the BI platform, it
looks the same as it did in Crystal Reports, but the underlying HTML displays the result object headings
first, followed by the title. Instead of reading the report title first, a screen reader reads the headings
first: “Quarter, Year, Invoice, Invoices by Quarter”.
To avoid this, insert the “Invoices by Quarter” title first. Before you add the data table, you could provide
an introductory text element that describes the table. Finally, add the result objects to the "Body" section.
The report will now make more sense in a screen reader, which will read the following information before
reading the data:
“Invoices by Quarter. The following table lists our invoices for each quarter. Quarter, Year, Invoice.”
To create accessible reports, you must plan the order of your report before you begin working in Crystal
Reports. Plan it on paper. Make sure you know which elements you want to add and where you want
2011-05-06313
Creating Accessible Reports

them. Include all calculations, images, and charts on your plan. When you create a new report based
on your plan, you can start adding elements from the upper left corner and work your way to the bottom
right corner of the report. Once the elements are placed, you can make changes to them afterwards
without affecting their order.
Note:
If you create a text-only alternative of your report, add it to your report as a subreport and, most
importantly, add the subreport before you add any other element to your report.
After you add all elements to the report, you can test their placement order by tabbing through the
elements.
Related Topics
• Text
16.2.2 Text
The most common accessibility issue encountered by report designers is also one of the easiest to
resolve: providing text-only versions of non-text elements. A non-text element is an element that conveys
meaning through a picture or sound. Non-text elements include pictures, charts, graphical buttons,
graphical representations of text, sounds, animations, and audio or video clips.
People who use assistive technologies are accustomed to text-only substitutes and, therefore, will
respond well to the text-only alternatives you provide.
There are a number of ways you can use text to substantially improve your reports' accessibility:
• Provide text equivalents for elements in reports.
• Provide text alternatives for reports.
• Ensure that text is written and formatted clearly.
Text is a useful tool for creating accessible reports. Most assistive technologies require text input,
including screen readers, speech synthesizers, and Braille displays. You can easily resize and format
text, and text is the most flexible medium for import and export.
16.2.2.1 Providing text equivalents
When you create reports, there are many opportunities to use text equivalents to clarify non-text
elements.
• Place a descriptive text element next to a non-text element, and be sure to add them to the report
in consecutive order (for more details see Placing elements in order).
2011-05-06314
Creating Accessible Reports

Whenever possible, a text equivalent should communicate the same information as its corresponding
element in the report. If a report displays data in a pie chart, for example, include a text box next to
the chart that summarizes its contents.
Describe the purpose of the non-text element. For example, if an image performs an action when
you click it, describe the action. For a button that opens your web site, provide a text box labeled
"Click to view our web site".
• If a report includes audio links, provide a transcript for significant audio clips.
• If a report links to a multimedia or video presentation, provide a transcript. You may also want to
provide captioning for the audio portion and an audio description of the visual portion. Captioning
should be synchronized with the audio.
16.2.2.2 Providing text-only alternatives
If there are too many non-text elements on a report, or if you do not have the resources to integrate
accessible design into all of your reports, then you can provide complete text-only alternatives. For
reports that represent data using only charts and graphics, for example, you can provide a link to a
text-only alternative that provides the same data in data tables and text elements.
Whenever possible, a text-only alternative should provide the same information as the original report.
The information conveyed through images in the main report should also be described using text
elements on the alternative report.
Note:
If you cannot produce a complete text-only version of the report, you can still improve accessibility by
providing a descriptive summary of key information or conclusions illustrated by the report.
It is good practice to provide the text-only alternative on a subreport, linked from the top left corner of
the main report, so the user has the opportunity to switch to the text-only version as soon as possible.
Add the subreport to the report before any other element to ensure that a screen reader will read it first.
If you want the subreport link to appear only for people using screen readers or similar software, you
can create a subreport link that is the same color as the background color. The link will appear as a
small blank space, but a screen reader will read the text for the link.
16.2.2.2.1 To add a text-only alternative to a subreport
1.
Create a text-only version of the report and save it.
2.
Open a new report.
3.
On the Insert menu, click Subreport.
4.
In the "Insert Subreport" dialog box, select Use existing report and click Browse to locate the report
you created in step 1.
5.
Click Next.
6.
If necessary, define the links between the main report and the subreport, and then click Finish.
7.
Right-click the subreport and then choose Format Subreport from the context menu.
2011-05-06315
Creating Accessible Reports

8.
In the Format dialog bpx, on the Subreport node, select On-demand.
9.
To hide the subreport link, on the Font tab, choose the color that matches the background color of
the report.
Note:
Instead of hiding the subreport link, you can conditionally suppress the section that contains the
subreport.
10.
Click Close.
16.2.2.3 Using punctuation
To improve the logical flow of spoken text, you may need to add extra punctuation to create pauses.
Without extra punctuation, screen readers may read several text elements as one continuous sentence,
making the content difficult to understand. For example, information in data sources may be read without
stop. To prevent this, you can break up information in data sources by inserting periods between result
objects.
Certain punctuation marks are read aloud, which may be distracting if used too frequently. For example,
when a screen reader reads a colon ":", it may read it aloud as "colon" instead of a pause. You can
change the amount of spoken punctuation in your screen reader's settings.
To troubleshoot your report's punctuation, it is good practice to read the report using a screen reader.
Do elements run together too quickly? Or are there too many pauses? Are any punctuation marks read
aloud? Does this improve or deter from the usability of the report?
16.2.2.4 Formatting text
After you create text equivalents or alternatives for non-text elements, ensure that the text is clearly
written and easy to read. Observe the following design guidelines:
• Use a larger font.
Although people with visual impairments can use the Zoom feature to increase the size of the report,
they will not need to magnify the report as much if the font size is larger. For example, chart labels
or legends can appear in a small font by default. For general legibility, it is good practice to use a
font larger than 8 point. For accessibility, ensure that text is larger than 11 point.
• Use a "sans serif" font.
Simple fonts such as Arial and Helvetica can be easier to read than serif fonts like Times or Palatino.
• Choose left or justified alignment.
Left-aligned or justified text is easier to read than centered or right-aligned text.
2011-05-06316
Creating Accessible Reports

• Ensure that text follows the guidelines for color usage. For details, see Color.
Note:
You can allow users to choose different font settings using a parameter and conditional formatting. For
details, see Accessibility and conditional formatting.
16.2.2.5 Finding the right balance between text and non-text elements
Text equivalents are very flexible and often the best solution for accessibility, but they are not always
necessary or preferred.
Not all non-text elements require text equivalents. You need to include text alternatives only for non-text
elements that provide information or navigation elements that the user cannot do without. Images used
for decorative purposes do not need a text description. If a report has a watermark image that acts as
a background for the data, you do not need to provide a text equivalent. Adding text descriptions for
decorative elements can produce unnecessary clutter.
Text versions of visual or auditory elements in reports should be used as a complement to the
element—not as a replacement. You do not need to remove non-text elements. Visual elements in
reports can be very helpful, especially for people with learning disabilities such as attention deficit
disorder, or for people who are deaf. People with hearing impairments may be accustomed to visual
communication such as sign language, and may find images more useful than text.
No one presentation method can meet the needs of all users. Audio clips can be very useful for people
with visual impairments, but people with hearing impairments will be unable to use them. To help both
groups, provide a combination of audio and text. Multimedia presentations may provide audio information
for people with visual impairments, as well as video information for people who are deaf or hard of
hearing. Multimedia presentations are particularly effective for people with attention deficit disorder.
However, people with certain mental health disabilities may be distracted by visual or audio elements.
The best approach is to communicate the same information with both text and non-text elements. Add
descriptive text to support the images, and add images that support the text.
If text elements begin to overwhelm your report, you may want to provide a complete text-only version
in a separate report or a subreport. For details, see Providing text-only alternatives.
To learn more strategies on how to choose presentation methods that meet the needs of a variety of
audiences, see Designing for flexibility.
16.2.3 Color
2011-05-06317
Creating Accessible Reports

The colors you choose for elements in reports can have a significant impact on accessibility for people
with visual impairments, low vision, or color blindness. Ensure that your reports can be understood
when viewed without color.
16.2.3.1 Contrasting colors
Users with limited vision may be unable to distinguish between colors. To test the color contrast in your
report, print or view a black and white copy. You should be able to distinguish between values or objects
displayed in different colors (in a pie chart, for example).
If you cannot distinguish between colors on the report, try different colors or use gray shading. If this
does not resolve the issue, you can change other characteristics.
For text, use the "Format" dialog box to change the font, size, or style. You can add borders, underlining,
or background shading to differentiate text elements from each other.
16.2.3.1.1 To convert a chart into black and white
1.
Select the chart and choose Chart Expert from the Format menu.
2.
In the Chart Expert, click the Options tab.
3.
In the "Chart color" area, select Black and white, and then click OK.
The chart colors convert to a variety of high-contrast pattern and color fills.
16.2.3.1.2 To change the fill for a chart value
1.
Select the chart, then click the shaded area you want to change.
2.
On the Chart menu, point to Chart Options, and then click Format Background.
3.
In the Format Background dialog box, on the Fill tab, choose a color and click Pattern.
4.
In the Choose A Pattern dialog box, click a pattern, then click OK.
Note:
You can also select a texture, gradient, or picture as a fill for the chart value. See the
Chart Help
for
more information.
16.2.3.2 Using color to convey information
Do not use color as the only identifying characteristic for critical information in a report.
For example, a text object may instruct users to "click the green button" to open a subreport. Users with
limited vision cannot tell which button is green. The button should be recognizable by another defining
characteristic besides its color. For example, you can change the button graphic to a shape that is not
2011-05-06318
Creating Accessible Reports

used elsewhere on the report, and instruct users to "click the green arrow button". This solution provides
color information for people who can distinguish colors, and extra information for people who cannot.
Other common situations where color may be used to provide important information include:
• Highlighting
To highlight particular values in a table, do not change only the color of the value. If you highlight
outstanding invoices in red, for example, they may look the same as the paid invoices to someone
with limited vision. In the Highlighting Expert dialog box, change a font characteristic other than
color, such as font style.
• Hyperlinks
Using color as the only method for identifying hyperlinks may also cause problems for color-blind
users. When you print your report in black and white, check the hyperlinks to ensure that they are
still visible.
• Identifying important areas of the report
Do not organize a report by using color as a background or as a separator between different sections
or areas. Instead of using color to identify sections, establish clear and consistent navigation for the
entire report.
16.2.4 Navigation
As with other aspects of accessible design, providing several alternative navigation methods can help
you meet the reporting needs of more people. Simplicity is critical for intuitive navigation; just maintain
clarity and consistency.
You may want to use report parts to navigate a report (or to connect several reports). If you provide a
series of links in a page header, keep in mind that screen-reading software will reread the navigation
information every time the user refreshes the page or views a new page. In this case, simple navigation
is preferable.
For a large report, you could provide a list of navigation links as a table of contents in the report header.
More extensive navigation can be useful when you have a large volume of data. To allow users to skip
the list, you could start with a "Skip the table of contents" link that jumps ahead to the first page header.
In general, report navigation should follow these guidelines:
• Identify the target of each link.
• Provide information at the start of the report that describes the layout and navigation.
• Use navigation consistently.
• Provide the opportunity to skip repetitive navigation links.
2011-05-06319
Creating Accessible Reports

16.2.5 Parameters
When you include parameters in a report, make sure they are clear and simple. Although parameters
can be a useful tool for providing accessible content, they can also introduce several accessibility
concerns. It is important to test all parameters for accessibility.
Parameters should follow these guidelines:
• Provide a list of default values for the user to choose from.
Avoid requiring the user to type a value for a parameter. When users provide their own values, they
need to make sure the format of the value will be recognized by the parameter field. A list of default
values is easier to use, and it ensures that the user chooses from values with valid formats.
• Try to avoid complex parameters.
A complex parameter field may be more accessible when it is broken down into multiple parameters.
When you test the accessibility of your parameters, pay particular attention to parameters that require
a range. It may be easier to understand if you provide two parameters that prompt for discrete values
for the top and bottom of the range, rather than ask the user to choose both values in the same
parameter field.
• For date fields, do not allow users to choose their own values.
The calendar used to select date values is not currently accessible. Provide a pick-list of default
date values. Using a list of default values also helps avoid invalid date formats.
16.3 Designing for flexibility
Flexibility is the key to providing accessible reports. Because different users require different levels of
accessibility, it is good practice to provide a variety of presentation styles and methods to meet the
needs of as many people as possible. For a detailed report, however, you may not be able to provide
multiple presentation styles without cluttering the report with extra objects.
To address this problem, plan the degree to which you want to integrate accessible formats into your
reports. You can provide accessible formatting for each object, for each section, or as a subreport. You
can then allow users to choose their own accessibility options using a parameter that prompts them to
choose whether or not to display accessible formats.
Using this parameter, you can conditionally format objects, or conditionally suppress sections that
address different access needs. Or you can provide different display options by using subreports.
2011-05-06320
Creating Accessible Reports

16.3.1 Accessibility and conditional formatting
Using the accessibility parameter in simple formulas, you can provide multiple formats for any object
in a report. If a user chooses "Yes" when prompted by the parameter, the conditional formulas will
ensure that the objects are modified with accessible formatting conventions. If a user chooses "No",
then the report appears without accessible formatting, perhaps in the standard company template.
For accessible text formatting, you can follow the guidelines suggested by this section and by the W3C,
or you can survey your report users to determine the formats that work best for them. After you determine
the formatting options you want to use, you can create conditional formulas that define the options. For
example, you can display all database fields in a large Arial font, in white text on a black background,
with the Can Grow option enabled.
The following procedure creates a conditional formatting formula based on the ?Access parameter.
The formula increases the font size if the ?Access parameter is set to "Yes". You can use similar
formulas to change colors, add borders, or enable the Can Grow setting. For complete instructions on
conditionally formatting fields and using the Format Formula Editor, see the
Crystal Reports Online
Help
.
Note:
If text objects are too small to accommodate the enlarged font, you can use a similar conditional
formatting formula to enable the Can Grow setting, which appears on the Common tab of the Format
Editor.
16.3.1.1 To apply accessible settings to font size conditionally
1.
Open the report in the Structure mode of Crystal Reports.
2.
In the "Body" section, right-click the object you want to conditionally format, and select Format from
the context menu.
3.
In the "Format" dialog box, click the Font tab.
4.
Click the Formula button that corresponds to the Size list.
The Format Formula Editor opens a new formula named Font Size.
5.
In the Formula text window, type this formula:
if {?Access} = "Yes"
then 20
else 10
This formula ensures that the font size for the currently selected field is increased from 10 point to
20 point when the user chooses to display accessible formatting.
6.
Click Save and close.
2011-05-06321
Creating Accessible Reports

7.
Click Close in the "Format" dialog box.
16.3.2 Accessibility and suppressing sections
Instead of formatting individual objects conditionally, you can create separate sections for accessible
versions of the report content, then use the accessibility parameter field to conditionally suppress
sections. The accessible and non-accessible sections can be suppressed or shown, based on the
parameter value the user selects.
Creating separate sections for accessible versions of report content may be more time-consuming, but
there are a few situations where suppressing sections conditionally can be more practical than formatting
on the object level:
• If a report contains many objects, suppressing sections may require fewer conditional formulas.
• Not all settings and features can be formatted conditionally. By suppressing sections, however, you
can make any formatting changes you want.
• You may want to provide completely different types of information for people viewing the accessible
version of the report. For example, you may want to split visual and audio objects into two different
sections and conditionally suppress them based on the parameter value the user chooses.
16.3.2.1 To suppress an accessible section
1.
Right-click the left boundary of the section you want to suppress conditionally, and click Format
Section.
2.
In the "Format" dialog box, click the General node and then click the Formula button that corresponds
to Hide.
The Format Formula Editor opens a new formula.
3.
In the Formula text window, type this formula:
if {?Access} = "No" then True
This formula selects the Suppress option if the user chooses not to view accessible report content.
4.
Click Save and close.
5.
Click OK in the "Format" dialog box.
16.3.3 Accessibility and subreports
2011-05-06322
Creating Accessible Reports

Accessible report design may become too cumbersome using conditionally formatted objects and
suppressed sections. Two situations in particular may be problematic:
• To make the report accessible, you may need to change the overall organization of the report
sections, or you may need to provide different objects.
• If the report contains a large number of objects or sections, it may take too much time to create
conditional formulas for all of them.
For example, if a report contains many non-text objects displayed in a complex series of groups and
sections, you may want to provide a text-only version that uses different objects and a simplified group
structure to meet accessibility guidelines. The easiest way to address this problem is to create a subreport
that displays the accessible version of the report and place the subreport at the beginning of the main
report. For details on creating a text-only accessible subreport, see Providing text-only alternatives.
If you want only screen readers to be able to see the subreport, you can hide it by changing the subreport
link to the same color as the background. Alternatively, you can use the ?Access parameter field to
allow users to choose whether or not the subreport appears in the report. Place the subreport in its own
section and conditionally suppress the section based on the ?Access parameter field. For details, see
Accessibility and suppressing sections.
16.4 Improving data table accessibility
Large tables of data can be difficult to interpret if a person is using a non-visual means of accessing
the web, such as a screen reader. People using screen magnifiers or the Zoom feature may also find
data tables hard to navigate because they cannot see the table headings at all times. It can easily
become difficult to associate the value that a screen reader is reading with the corresponding column
and row headings. Users need to be able to understand the data value's position in the table and its
relationship to other values.
To improve data table navigation, you can use text objects to provide contextual information with each
value. Using conditional formatting or suppression, you can create a report that displays these objects
only if the user chooses to view them. Other design guidelines can help make large tables of data easier
to understand, such as providing summary paragraphs and expanded column headings.
Note:
In these guidelines, the term data table refers to values arranged in columns and rows. In Crystal
Reports, data tables take the form of group or page headings combined with database fields in the
Details section. Do not confuse data tables with database tables, which are data sources used by
Crystal Reports.
16.4.1 Text elements and data table values
2011-05-06323
Creating Accessible Reports

You can make a large table easier to understand and navigate by adding text elements that provide
information about each value in the table.
Include whatever information is necessary to establish the meaning and context of the value displayed.
When appropriate, include information that describes column headings or neighboring fields. For
example, if a report displays employee names and salaries, you can add a text element before the
Salary database field that reads "{Last Name}'s salary is". The user can determine the context and
meaning of the value by reading the accompanying text element.
Ensure that your text elements use punctuation that will make the content easier to understand when
read aloud by a screen reader. Without accessibility-orientated punctuation, data tables may be read
as one long sentence, making navigation and interpretation very difficult. For example, you can add
periods after values so a screen reader will pause between columns and rows. For details, see Using
punctuation.
As with all elements in reports, the order in which you place text elements on the report can affect
accessibility. Screen readers read the elements in the order they were originally added. (For details,
see Placing elements in order.) The correct placement order is critical when you add a text element
that identifies the contents of a particular column in a data table. If you add the text elements at the end
of the design process, they may be read after the columns that they refer to. When you add text elements
that describe values in a report, ensure that you place them on the report in the order that you want
them to be read.
Before you can create an accessible data table, you must plan your report in advance, determining
which elements and result objects you want to include. Because elements must be placed in the order
you want them to be read, planning your content for accessibility is essential. As part of this planning,
it is good practice to choose how you will use text elements to identify data table values. You can simply
add text elements before each result object. Or you can conditionally suppress text elements or use
formulas to combine text elements and values.
16.4.1.1 Labeling data tables with text elements
Before each object, add a text element that describes the object's position in the table. For example,
the text box can provide information about the Employee ID number. When the report is read with a
screen reader, each number is preceded by the brief explanation in the text box.
Providing extra information for each value can make a data table appear cluttered for people without
vision impairments, so you may want to hide the extra text elements by changing the font color to the
same color as the background. The extra text is invisible, but is still detected and read by screen readers.
16.4.1.2 Labeling data tables conditionally
2011-05-06324
Creating Accessible Reports

Although adding text elements is relatively easy to implement, it does not address all accessibility
concerns. Invisible text is read by screen readers, but does not help people with limited vision. You can
allow the user to choose whether or not to display text descriptions in the data table by conditionally
formatting or suppressing text elements.
Make sure your report includes an accessibility parameter. For instructions on how to create the ?Access
accessibility parameter, see Designing for flexibility.
You can use the parameter to suppress the text elements conditionally. While it has the same effect
as changing the font color to the background color, conditionally-suppressed text also allows you to
use the parameter to specify other formatting options such as font size and style.
To display the text elements only when the user chooses Yes for the ?Access parameter, the following
report uses a simple conditional formula to enable the Suppress option on the Common tab of the
Format Editor.
{?Access}="No"
The formula must be added for each text element you want to suppress.
When the user chooses Yes for the ?Access parameter, the text elements are not suppressed; the data
table displays text descriptions.
When the user chooses No for the ?Access parameter, the conditional formula suppresses the text
elements, leaving spaces in the report in place of the text elements.
16.4.1.3 Labeling data tables with formulas
Another method for adding explanatory text to a data table is to create formulas that combine text, result
objects, and conditional formatting. By adding the text and the result objects together in a conditional
formula based on the ?Access parameter, you can provide optional text for values in a table without
leaving blank spaces in the report. Using formulas also reduces the number of elements on the report,
making it easier to maintain the proper placement order.
Note:
Do not use this method if the report has summary objects or calculated objects. Although formulas
provide the best display of data, they can interfere with calculations because the data is converted to
text.
You can create a report that uses formulas in the Details section that combine the result objects and
the extra text. When the user chooses Yes for the ?Access parameter, each formula builds a string that
includes the description and the value.
The following formulas show examples of the typs of formulas that you can create:
@Employee ID
If {?Access}="Yes" then "Employee ID "
+ ToText({Employee.Employee ID},0) + ". "
else ToText({Employee.Employee ID},0)
2011-05-06325
Creating Accessible Reports

@Last Name
If {?Access}="Yes" then "Employee last name is "
+ {Employee.Last Name} + "."
else {Employee.Last Name}
@Salary
If {?Access}="Yes" then {Employee.Last Name} + "'s Salary is " + ToText({Employee.Salary}) + "."
else ToText({Employee.Salary})
Notice the added punctuation. The periods at the end of each formula improve screen reader legibility
by creating a pause between objects.
Note:
• The report also uses the ?Access parameter to enable the Can Grow option and increase the font
size.
• In @Employee ID, ?Access parameter has been set to "0" to enable the Can Grow option and
increase the font size.
When the user chooses No for the ?Access parameter, the formula returns only the data. The report
does not display blank spaces in place of the conditional text elements. Both versions of the report are
easy to read.
16.4.2 Other data table design considerations
In addition to labelling data values with text elements, other report design techniques can help you
create data tables that are easier to understand and navigate.
• Include an introductory paragraph that summarizes the content of the table. The summary should
be brief: one or two sentences if possible.
• Ensure that headings provide enough information to clearly identify the values that they label.
• To test a table's accessibility, read its headings and values in a linear fashion from left to right and
from top to bottom. For example, if a report displays last and first name objects for each customer,
it may read better if it displays first name followed by last name. Whenever possible, test the report
using assistive technologies such as screen reading software.
The final accessible report includes a summary of the data table.
To display the table summary conditionally, the report designer divided the Page Header into two
sections. The first page header is suppressed when the ?Access parameter is set to No. The second
page header is suppressed if the user chooses Yes. For details, see Accessibility and suppressing
sections.
2011-05-06326
Creating Accessible Reports

Report Coexistence Between Versions of SAP Crystal
Reports
The new Crystal Reports for Enterprise engine coexists with the Crystal Reports 2011 engine in SAP
BusinessObjects Business Intelligence platform 4.0. Coexistence provides backward compatibility,
allowing you to continue to use existing reports with the new technology or migrate your reports to take
advantage of the new features. You only need to install and run the servers necessary to access the
features of Crystal Reports you want, which will reduce the resources needed to run SAP
BusinessObjects.
17.1 Versions of SAP Crystal Reports
There are two versions of Crystal Reports in SAP BusinessObjects XI 4.0.
Crystal Reports 2011
Crystal Reports 2011 is the newest version of the standard Crystal Reports. Crystal Reports 2011 is
backwards compatible with all existing reports and supports the same data sources as Crystal Reports
2008. You do not have to transfer your reports to Crystal Reports for Enterprise unless you want access
to its new features or the Common Semantic Layer.
Crystal Reports for Enterprise
Crystal Reports for Enterprise allows for reporting on Common Semantic Layer data sources: SAP,
Universes (unx), and Analysis Views. Crystal Reports for Enterprise comes with a new engine and
designer.
17.2 Reports processed separately
SAP BusinessObjects Enterprise (BOE) runs Crystal Reports 2011 and Crystal Reports for Enterprise
on separate engines:
• Reports saved in SAP Crystal Reports 2011 run on Crystal Reports 2011 servers.
• Reports saved in SAP Crystal Reports for Enterprise reports run on SAP Crystal Reports for Enterprise
servers.
2011-05-06327
Report Coexistence Between Versions of SAP Crystal Reports

Both servers can be configured and run separately for increased user control.
Note:
For more information on server configuration, see the
SAP BusinessObjects XI 4.0 Administrator's
Guide
.
Universes
BOE XI 4.0 has two types of universes:
• unv: Created with the universe designer and consumed by Crystal Reports 2011.
• unx: Created with the Information Design Tool and consumed by SAP Crystal Reports for Enterprise.
Note:
See the Information Design Tool entry to learn more about creating unx universes.
Server List
Crystal Reports uses the following servers:
Crystal Reports servers shared by both 2011 and next-generation stacks
• Crystal Reports Cache Server
Crystal Reports servers using the Crystal Reports 2011 stack
• Crystal Reports 2011 Processing Server
• Crystal Reports 2011 Job Server
• Report Application 2011 Server
Crystal Reports servers using the next-generation Crystal Reports stack
• Crystal Reports Processing Server
• Crystal Reports Job Server
17.3 Update existing reports
Crystal Reports for Enterprise designer allows you to run regular Crystal Reports reports on Crystal
Reports for Enterprise. Opening older reports in Crystal Reports for Enterprise designer brings up a
wizard to help you connect your report to the Common Semantic Layer. The wizard will note any
problems that may appear in your report as a result of this transfer.
Common problems include missing features, such as:
• Maps
• OLAP Grids
• Custom Functions
• UFLs
You should ensure that your report continues to function after connecting to the Common Semantic
Layer before proceeding.
2011-05-06328
Report Coexistence Between Versions of SAP Crystal Reports

17.4 Audit reports
In addition to the standard administrative information, audits also show whether reports are running on
Crystal Reports 2011 servers or Crystal Reports for Enterprise servers. This information allows
administrators to determine which servers to keep running when migrating to Crystal Reports for
Enterprise.
Note:
For information on accessing report audits, see the
SAP BusinessObjects XI 4.0 Administrator's Guide
.
2011-05-06329
Report Coexistence Between Versions of SAP Crystal Reports

2011-05-06330
Report Coexistence Between Versions of SAP Crystal Reports
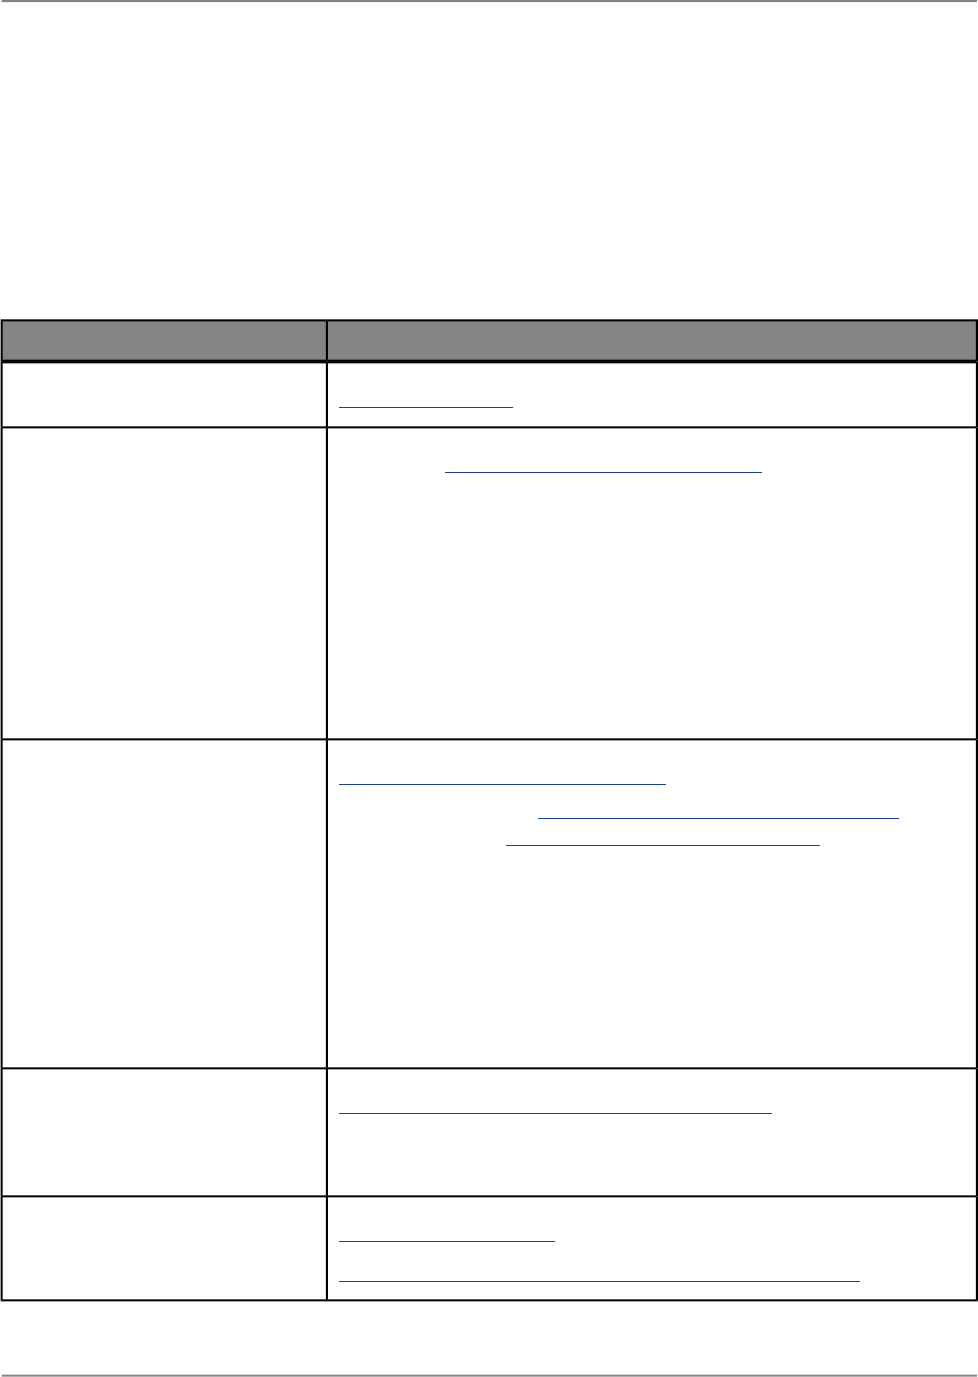
More Information
LocationInformation Resource
http://www.sap.com
SAP BusinessObjects product infor-
mation
Navigate to http://help.sap.com/businessobjects and on the "SAP Busi-
nessObjects Overview" side panel click All Products.
You can access the most up-to-date documentation covering all SAP
BusinessObjects products and their deployment at the SAP Help Portal.
You can download PDF versions or installable HTML libraries.
Certain guides are stored on the SAP Service Marketplace and are not
available from the SAP Help Portal. These guides are listed on the Help
Portal accompanied by a link to the SAP Service Marketplace. Customers
with a maintenance agreement have an authorized user ID to access
this site. To obtain an ID, contact your customer support representative.
SAP Help Portal
http://service.sap.com/bosap-support > Documentation
• Installation guides: https://service.sap.com/bosap-instguides
• Release notes: http://service.sap.com/releasenotes
The SAP Service Marketplace stores certain installation guides, upgrade
and migration guides, deployment guides, release notes and Supported
Platforms documents. Customers with a maintenance agreement have
an authorized user ID to access this site. Contact your customer support
representative to obtain an ID. If you are redirected to the SAP Service
Marketplace from the SAP Help Portal, use the menu in the navigation
pane on the left to locate the category containing the documentation you
want to access.
SAP Service Marketplace
https://cw.sdn.sap.com/cw/community/docupedia
Docupedia provides additional documentation resources, a collaborative
authoring environment, and an interactive feedback channel.
Docupedia
https://boc.sdn.sap.com/
https://www.sdn.sap.com/irj/sdn/businessobjects-sdklibrary
Developer resources
2011-05-06331
More Information
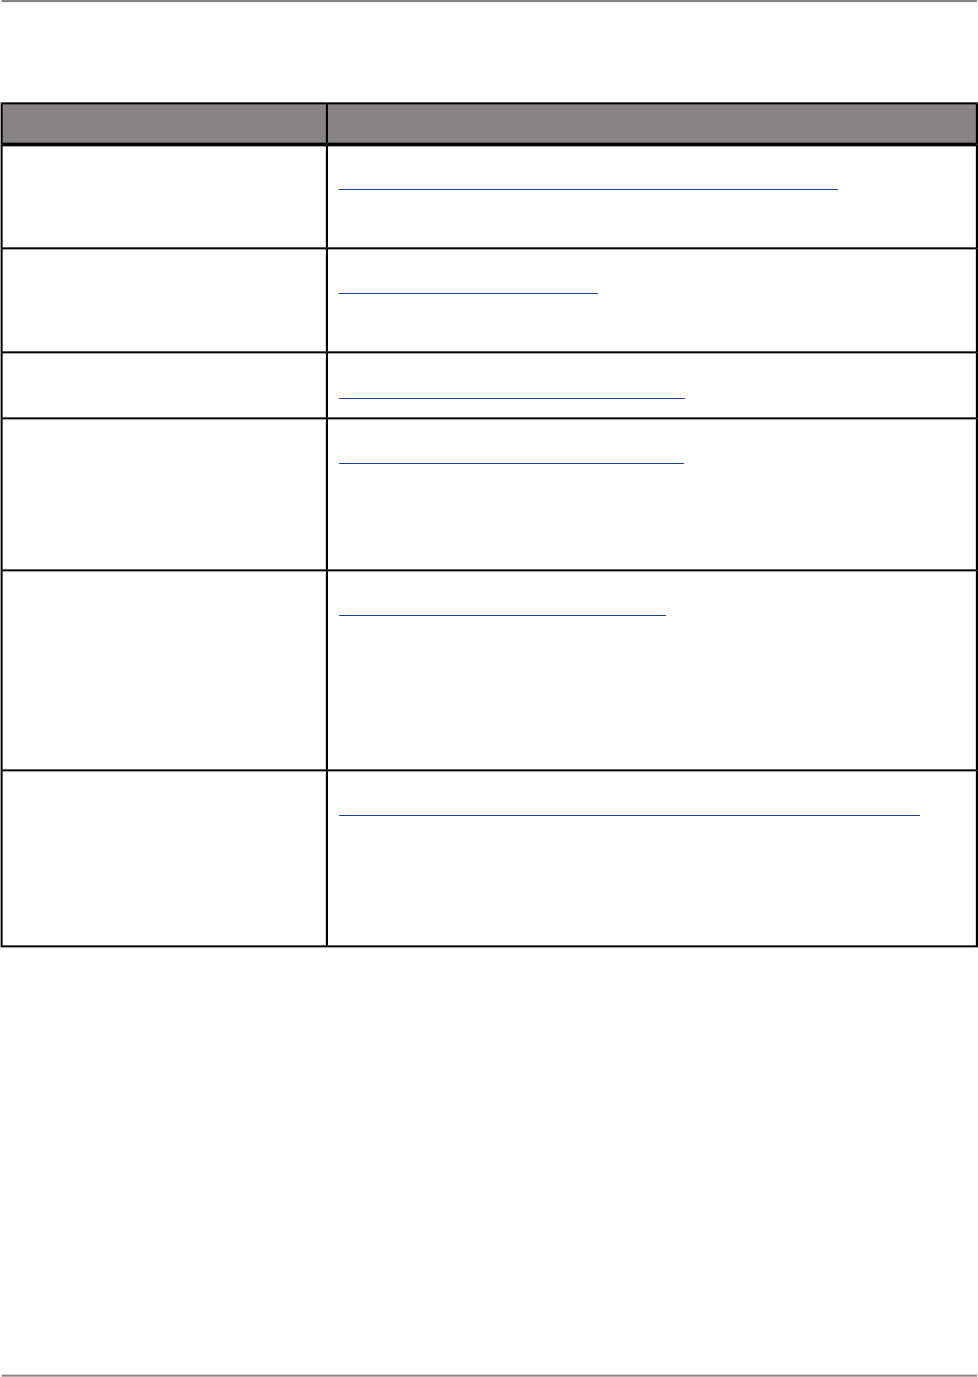
LocationInformation Resource
https://www.sdn.sap.com/irj/boc/businessobjects-articles
These articles were formerly known as technical papers.
SAP BusinessObjects articles on
the SAP Community Network
https://service.sap.com/notes
These notes were formerly known as Knowledge Base articles.
Notes
https://www.sdn.sap.com/irj/scn/forums
Forums on the SAP Community
Network
http://www.sap.com/services/education
From traditional classroom learning to targeted e-learning seminars, we
can offer a training package to suit your learning needs and preferred
learning style.
Training
http://service.sap.com/bosap-support
The SAP Support Portal contains information about Customer Support
programs and services. It also has links to a wide range of technical in-
formation and downloads. Customers with a maintenance agreement
have an authorized user ID to access this site. To obtain an ID, contact
your customer support representative.
Online customer support
http://www.sap.com/services/bysubject/businessobjectsconsulting
Consultants can accompany you from the initial analysis stage to the
delivery of your deployment project. Expertise is available in topics such
as relational and multidimensional databases, connectivity, database
design tools, and customized embedding technology.
Consulting
2011-05-06332
More Information

Index
3-D Surface chart 151
A
absolute formatting 98
accessibility 311
benefits 311
Crystal Reports 311
design considerations 312
accounting conventions 100
alerts 30
adding 30
alignment, modifying for cells 172
Analysis view
connecting 46
area chart 151
arithmetic operators
Crystal syntax 280
array data types, Crystal syntax 268
array functions
Crystal syntax 277
assignment operator
Crystal syntax 263
assistive technology 311
attribute properties, conditional 104
audits
reports 329
auto generate report 66
OLAP data sources 67
relational data sources 66
auto-arranging
charts 167
automatic type conversions, Crystal
syntax 274
B
background colors, formatting
(rows/columns) 172
bar chart 151
BI platform
publishing reports to 182
blank lines
deleting with multiple sections 112
Boolean operators
Crystal syntax 281
borders
adding to objects 98
Bottom N
selecting groups 137
selecting percentages 137
boxes 100
adding 99
editing 99
formatting 100
inserting 99
bubble chart 151
C
calculated members 53
cross-tabs 175
adding blank 176
calculation formulas 177
changing processing order 176
group value formulas 178
header formulas 177
insertion formulas 179
calculation formulas 177
captions, adding to subreports 303
cascading parameter groups 227
cells
modifying
alignment 172
width/height 172
charts 151
auto-arranging 167
charting concepts 151
creating 160
on cross-tab totals 161
trendlines 165
definitions 151
drilling down 160
dual axis charts 166
editing 162
changing axis options 163
changing series options 163
formatting 163
conditionally 165
format dialog box 162
group type "for all records"
required values 158
group type "for each record"
required values 156
group type "on change of"
required values 154
keyboard shortcuts 20
placing 159
specifying
category 153
label 153
series 153
charts
(continued)
specifying
(continued)
total 153
type 153
types
3-D Surface 151
area 151
bar 151
bubble 151
doughnut 151
funnel 151
Gantt 151
gauge 151
histogram 151
line 151
numeric axis 151
pie 151
radar 151
XY Scatter 151
working with 162
coexistence
reports 327
audits 329
processed separately 327
updating existing 328
versions of SAP Crystal Reports
327
color
accessibility 317
adding to objects 98
contrast 317
Comma Seperated Values (CSV)
exporting to 215
comments
Crystal syntax 259
comparison operators
Crystal syntax 281
conditional
messages in form letters 116
on/off properties 104
operators 103
running totals 145
values 103
conditional attribute properties 104
conditional formatting 103
accessibility 321
changing element width 108
changing X position 108
charts 165
creating page footers after first
page 107
2011-05-06333

conditional formatting
(continued)
keyboard shortcuts 21
page margins 106
pictures 108
using Crystal syntax 278
configuration properties
export
in SAP BusinessObjects
Business Intelligence
platform 202
in SAP Crystal Reports for
Enterprise 188
connecting to an SAP BusinessObjects
Business Intelligence platform
server 182
contrast, color 317
control structures
Crystal syntax 282
cross-tabs 169
advanced features 174
calculated members 175
adding blank 176
calculation formulas 177
changing processing order 176
group value formulas 178
header formulas 177
insertion formulas 179
creating 170
displaying hierarchies 175
embedded totals 179
formatting 172
individual elements 173
row/column background color
172
several elements at a time 173
hiding
data 173
empty rows and columns 173
grand totals 174
inserting charts 161
modifying
cell alignment 172
cell width/height 172
printing cross-tabs that span
multiple pages 171
repeat row labels 172
totals
display direction 174
values as percentages 171
working with 171
Crystal Reports 11
versions
coexistence 327
Crystal syntax 258
array data types 268
assignment operator 263
Crystal syntax
(continued)
Boolean values 265
comments 259
conditional formatting 278
control structures 282
currency 264
DateTime values 265
expressions 261
multiple 261
formulas 258
functions 275
array 277
date ranges 276
evaluation time 277
non reporting-specific 276
summary 276
fundamentals 258
if expressions 263, 282
looping
For Loop syntax 287
for loops 287
safety mechanisms 291
while loops 289, 290
numbers 264
objects 260
operators 280
arithmetic 280
Boolean 281
comparison 281
null objects 281
order of precedence 280
range data types 266
select expressions 286
simple data types 264
sizing limitations 292
strings 265
variables 268
array 272
automatic type conversions 274
declaring 269
scope 270
CSV
exporting to 215
custom values in parameters 229
D
data
cross-tabs 169
formatting 31
accessibility 323
grouping 127, 128
custom 128
hierarchically 132
into intervals 130
on first letter of name 131
data
(continued)
placing on report 25
showing different views with
subreports 304
sort objects 123
sorting 123, 125
records within groups 129
specified order 127
totaling grouped 135, 136
Data Explorer 15
data passing links 295
linking subreports to main reports
299
modifying record selection formulas
300
data sources
connecting
to a universe 45
to an Analysis view 46
to an SAP BEx query 45
connections 45
OLAP
auto generate report 67
relational
auto generate report 66
selecting 23
verifying 83
date elements
formats on a Japanese system 98
date range functions 276
deleting
blank lines 112
formulas 242
interactive filters 224
parameters 229
designing reports 37
accessibility 312
adding 34
a title page 34
comments 35
creating prototypes 42
deciding on content 37
determining structure 39
finding data 39
formatting
data 31
grouping 32
inserting 29
hyperlink objects 29
predefined objects 27
text elements 27, 28
manipulating data 40
placing
data 25
formulas 26
parameters 26
2011-05-06334
Index

designing reports
(continued)
placing
(continued)
picture elements 28
running total objects 27
printing characteristics 41
sorting 32
stating purpose 38
totaling 32
discrete values in parameters 230
distributing
reports 182
through SAP BusinessObjects
Business Intelligence
platform 182
document properties functions
Crystal syntax 278
doughnut chart 151
drilling down
on charts 160
dual axis charts 166
E
Edit Mask, using in parameters 233
editing
managed reports 182
elements
accessibility 313
changing width conditionally 108
formatting
individual in cross-tab 173
several at a time 173
keyboard shortcuts 19
repeating on horizontal pages 101
selecting multiple 94
text 27, 114
in form letters 114
variable-length 112
emailing
reports 183
embedded objects
hiding blank lines 92
embedded totals
cross-tabs 179
error messages
formulas 248
semantic 117
evaluation time functions 277
examples in documentation
understanding 12
exporting
configuration properties
in SAP BusinessObjects
Business Intelligence
platform 202
exporting
(continued)
configuration properties
(continued)
in SAP Crystal Reports for
Enterprise 188
Excel
page-based 185
format types 185
reports 184
to HTML 215
to Separated Values (CSV) 215
expressions
Crystal syntax 261
select 286
F
filters 55, 74
combining 60, 79
with And/Or operators 59, 78
with prompts 57, 76
creating 55, 74
interactive 223
lists of values 232
reference to operators 57, 76
subreports 294
folders
selecting 24
fonts
changing conditionally 106
TrueType 97
for loops (Crystal syntax) 287
form letters 113
creating 114
creating with text elements 114
inserting a date 114
inserting address 115
printing conditional messages 116
salutations 115
format dialog boxes 17
charts 162
Format Painter 109
formatting 85
absolute 98
accessibility 316
accounting conventions 100
blank lines
adding conditionally 113
boxes 99
cells
alignment 172
width/height 172
charts 163
conditional 98, 103
cross-tabs 172
elements individually 173
formatting
(continued)
cross-tabs
(continued)
row/column background color
172
crosstabs
several elements at a time 173
data 31
deleting blank lines 112
elements
repeating on horizontal pages
101
lines 99
objects
borders, color, and shading 98
properties 98
shapes 100
subreports 298
using the Format Painter 109
with Boolean formulas 104
formula compiler warnings 248
Formula Workshop 237
accessing 238
buttons 239
formula text window 239
Navigation panel 238
Objects Panel 238
formulas 235
Boolean 104
components 236
creating 241
running totals 147
Crystal syntax 258
array data types 268
comments 259
conditional formatting 278
control structures 282
expressions 261
functions 275
fundamentals 258
if expressions 282
looping 287
objects 260
operators 280
order of precedence 280
print state 277
range data types 266
select expressions 286
simple data types 264
sizing limitations 292
variables 268
debugging 243
deleting 242
specifications 243
Document Properties functions
(Crystal syntax) 278
editing 242
2011-05-06335
Index

formulas
(continued)
Formula Workshop 237
incorporating parameters 233
inserting 26, 242
looping
For Loop syntax 287
modifying 241
removing 243
searching and replacing text 242
types 237
typical uses 235
with parameters 220
functions
array
Crystal syntax 277
conditional formatting
Crystal syntax 278
Crystal syntax 275
date ranges
Crystal syntax 276
document properties
Crystal syntax 278
evaluation time
Crystal syntax 277
non reporting-specific, Crystal
syntax 276
print state
Crystal syntax 277
summary
Crystal syntax 276
funnel chart 151
G
Gantt chart 151
gauge chart 151
group footers 14
group headers 14, 139, 140
creating 140
drilling-down 141
standard group headers 140
suppressing 141
Group Tree 16
group value formulas 178
grouped data, isolate information 33
grouping 32
data into intervals 130
hierarchically 132
on first letter of name 131
groups 127, 128
calculating percentages 139
creating
running totals 144
running totals using formulas
147
custom 128
groups
(continued)
sorting
on totaled values 137
records within 129
specified sort order 127
subtotaling 135
totaling 135, 136
groups and sorts dialog box
keyboard shortcuts 20
H
header formulas 177
headers 140
creating standard group 140
drilling-down 141
live group headers 140
suppressing 141
height, modifying for cells 172
help
online 11
hidden prompts
in parameters 231
hiding 88, 89
blank lines
in embedded objects 92
cross-tab data 173
group headers 141
report objects 89
if duplicated 89
if zero 89
report sections 88
sections
to delete space 102
Show on Drill Only 88
hierarchies 51, 69
displaying in cross-tabs 175
SAP BEx queries 67
highlighting exceptions
accessibility 318
histogram chart 151
horizontal pages
numbering 102
repeating elements 101
HTML
exporting to 215
hyperlink objects, inserting 29
I
if expressions in Crystal syntax 263,
282
indenting lines 93
insertion formulas 179
interactive filters 223
adding additional 224
interactive filters
(continued)
creating 223
deleting 224
keyboard shortcuts 21
intervals, grouping data 130
isolate 33
on grouped data 33
K
keyboard shortcuts 17
charts 20
conditional formatting 21
elements 19
groups and sorts dialog box 20
interactive filters 21
objects 19
miscellaneous 20
Page mode 17
report canvas 18
side panels 17
statement editors 21
Structure mode 17
L
line chart 151
lines
adding 99
adding blank conditional 113
hiding blank
in embedded objects 92
modifying 99
spacing 95
linked subreports 294
data passing links 295
subreport filters 294
linking
subreports to main reports
with data passing links 299
with subreport filters 299
lists of values
dynamic
creating parameters 226
filters 232
null handling 234
separate values and descriptions
228
static
creating parameters 225
types 221
working with 225
live group headers
creating 140
logging on to SAP BusinessObjects
Business Intelligence platform 21
2011-05-06336
Index

loops
safety mechanism (Crystal syntax)
291
LOV 225
M
managed reports
editing 182
margins, page 106
member selector
calculated members 53
hierarchies 51, 69
named sets 52, 69
SAP BEx queries 68
selecting universe members 53, 70
universes 50
multi-line, text-based elements 92
multilingual reporting 307
creating templates 308
levels 307
scheduling reports 309
viewing reports 310
multiple column reports 85
multiple sections 112
deleting blank lines 112
multiple values in parameters 229
N
named sets 52, 69
navigating
accessibility 319
keyboard shortcuts 17
Navigation panel
Formula Workshop 238
new connections 21
non-text elements
accessibility 314
null handling 234
numeric axis chart 151
numeric values
using accounting conventions 100
O
objects
changing X position conditionally
108
hiding 89
if duplicated 89
if zero 89
inserting
predefined objects 27
objects
(continued)
keyboard shortcuts 19
miscellaneous 20
quick reference 48, 71
sorting 123
truncated values 93
Objects Panel
Formula Workshop 238
on-demand subreports 303
on/off properties, conditional 104
opening
reports 217
from SAP BusinessObjects
Business Intelligence
platform 218
from your local computer 217
recently opened 218
operators
arithmetic
Crystal syntax 280
Boolean
Crystal syntax 281
comparison
Crystal syntax 281
conditional 103
null objects
Crystal syntax 281
reference to query filters 57, 76
optional parameters 222
order of precedence
Crystal syntax 280
Outline panel 16
P
page 97
margins 96, 106
size and orientation 96
page footers 14, 32
creating after first page 107
page headers 14, 32
Page mode 15
keyboard shortcuts 17
page-based Excel format 185
panels 15
keyboard shortcuts 17
parameters 219
accessibility 320
conditional formatting 321
creating 222
with dynamic lists of values 226
with static lists of values 225
custom values 229
deleting 229
discrete values 230
Edit Mask 233
parameters
(continued)
groups
cascading 227
incorporating into formulas 233
inserting 26
multiple values 229
optional 222
range values 230
with hidden prompts 231
working with 220
percentages
calculating
groups 139
totals 139
pictures 28
conditional 108
inserting 28, 90
section underlays 90
pie chart 151
pre-printed forms 91
predefined objects 27
inserting 27
print state functions
Crystal syntax 277
printing
cross-tabs that span multiple pages
171
report area characteristics 41
reports 216
sections 217
problems panel 17
prompts 55, 74, 219
building 56, 75
combining 60, 79
with filters 57, 76
dynamic lists of values 226
hidden 231
static lists of values 225
types 222
properties
conditional attribute 104
conditional on/off 104
prototypes, developing on paper 42
publishing
reports to SAP BusinessObjects
Business Intelligence platform
183
Q
queries
combined 61
copying specifications 65, 81
designing 47
editing 66, 81
filters 55, 74
2011-05-06337
Index

queries
(continued)
generate report
OLAP data sources 67
relational data sources 66
incompatible 60
object quick reference 48, 71
pasting specifications 65, 81
prompts 55, 74
properties 63
SAP BEx
building 68
connecting 45
data selection 68
designing 67
selecting context 61
simple 61
sorting 55, 73
universe queries
building 47
data selection 47
designing 47
View Script 65, 80
Query Panel
building 47
data selection 47
functions 62, 79
generate report 66
sorting 55, 73
R
radar chart 151
range data types (Crystal syntax) 266
range values in parameters 230
re-importing subreports 297
record selection formulas
modifying with data passing links
300
records
creating running totals 144
sorting 123
within groups 129
relational data sources
auto generate report 66
OLAP data sources 67
report canvas 13
keyboard shortcuts 18
report footers 14
report headers 14
report sections 110
characteristics 85
group footer 14
group header 14
page footer 14
page header 14
printing characteristics 41
report sections
(continued)
report footer 14
report header 14
reports
accessibility 312
adding 34
a title page 34
comments 35
audits 329
basic design 37
coexistence 327
combining unrelated with
subreports 302
creating new 22
creating prototypes 42
deciding on content 37
deleting sections 111
distributing 182
emailing 183
exporting 184
finding data 39
formatting
data 31
formulas on 26
grouping 32, 127
records 32
hiding 88
objects 89
report sections 88
Show on Drill Only 88
inserting
hyperlink objects 29
pictures 90
predefined objects 27
sections 111
text element 28
text elements 27
manipulating data 40
moving sections 111
multiple columns 85
multiple sections 110, 112
overflow object representation 93
page headers and footers 32
parameter on 26
placing
charts 159
data 25
multi-line, text-based elements
92
picture elements on 28
result objects on 26
pre-printed forms 91
preventing truncation of text inside
an element 91
printing 216
characteristics 41
reports
(continued)
processed separately 327
publishing to the BI platform 183
resizing sections 112
running total objects on 27
saving 181
locally 181
section underlays 90
sections 111
selecting multiple elements 94
sorting 32, 123
records 33
stating purpose 38
structure, determining 39
subtotals 33
totals 32, 33
updating existing 328
viewing 217
zooming in and out on 35
resizing
sections
to add space 102
to delete space 102
result objects 26
inserting 26
in text elements 28
selecting 24
rows
adding/deleting space between 102
running totals 142
creating 144
conditional 145
for a group 144
using formulas 147
placing 143
S
SAP BEx queries
building 68
connecting 45
data selection 68
designing 67
hierarchies 67
member selector 68
SAP BusinessObjects Business
Intelligence platform
connecting to server 182
logging on 21
opening reports from 218
publishing reports to 182
saving
reports 181
locally 181
screen readers 311
Search 16
2011-05-06338
Index

section underlays 90
pictures 90
sections 85, 110, 111
accessibility 322
deleting 111
group footer 14
group header 14
hiding
to delete space 102
inserting 111
moving 111
multiple in report 112
page footer 14
page header 14
printing 217
report footer 14
report header 14
resizing 112
to add space 102
to delete space 102
semantic error messages 117
Separated Values (CSV)
exporting to 215
shading
adding to objects 98
shapes, adding 100
Show on Drill Only 88
simple data types (Crystal syntax) 264
size, custom 97
smart guidelines 86, 87, 88
sort controls 125
sort objects 123
sorting 32, 123, 125
on totaled group values 137
records 123
within groups 129
sort controls 125
specified order 127
spacing
adding to sections by resizing 102
between rows 102
deleting by resizing 102
hiding sections to delete 102
specified sort order 127
standard group headers, creating 140
statement editors
keyboard shortcuts 21
Structure mode 13
areas and sections 14
keyboard shortcuts 17
subcolumns 88
subreport filters 294
linking subreports to main reports
299
subreports 293
accessibility 315, 323
subreports
(continued)
combining unrelated reports 302
different views of same data 304
formatting 298
inserting 295
a new report 295
an existing report 296
linked 294
data passing links 295
subreport filters 294
linking to main reports
with data passing links 299
with subreport filters 299
modifying record selection formulas
with data passing links 300
on-demand 303
adding captions to 303
re-importing 297
saving as main report 297
unlinked 294
subtotaling
groups 135
summary functions 276
syntax
Crystal syntax 258
T
tables
accessibility 323
design considerations 326
inserting text elements 324
text elements 27, 114
accessibility 314
formatting 316
punctuation 316
in form letters 114
inserting 28
result objects in 28
placing on the report 314
preventing truncation of text 91
text rotation 94
titles 34
adding a title page 34
Top N
selecting groups 137
selecting percentages 137
totaling 32
group values
sorting 137
grouped data 135, 136
totals 33
calculating percentages 139
cross-tabs
displaying from left to right 174
embedded 179
totals
(continued)
running totals 142
trendlines 165
TrueType fonts 97
U
universe queries
building 47
data selection 47
designing 47
universes
connecting 45
member selector 50
unlinked subreports 294
updating existing reports 328
V
values
conditional 103
cross-tabs
show as percentages 171
currency, display 93
numeric, display 93
variable-length elements 112
variables
Crystal syntax 268
array, declaring 272
automatic type conversions 274
declaring 269
default values 274
global 271
local 270
scope 270
shared 272
View Script 65, 80
viewing
reports 217
W
while loops
Crystal syntax 289, 290
width, modifying for cells 172
X
XY Scatter chart 151
Z
zooming in and out on reports 35
2011-05-06339
Index

2011-05-06340
Index
